. 2022 May;27(3):241-256.
doi: 10.1007/s12192-022-01264-2. Epub 2022 Mar 16.

Endoplasmic reticulum-unfolded protein response pathway modulates the cellular response to mitochondrial proteotoxic stress

Affiliations

Endoplasmic reticulum-unfolded protein response pathway modulates the cellular response to mitochondrial proteotoxic stress

Rajasri Sarkar et al. Cell Stress Chaperones. 2022 May.

Abstract

Mitochondria and endoplasmic reticulum (ER) remain closely tethered by contact sites to maintain unhindered biosynthetic, metabolic, and signalling functions. Apart from its constituent proteins, contact sites localize ER-unfolded protein response (UPR) sensors like Ire1 and PERK, indicating the importance of ER-mitochondria communication during stress. In the mitochondrial sub-compartment-specific proteotoxic model of yeast, Saccharomyces cerevisiae, we show that an intact ER-UPR pathway is important in stress tolerance of mitochondrial intermembrane space (IMS) proteotoxic stress, while disrupting the pathway is beneficial during matrix stress. Deletion of IRE1 and HAC1 leads to accumulation of misfolding-prone proteins in mitochondrial IMS indicating the importance of intact ER-UPR pathway in enduring mitochondrial IMS proteotoxic stresses. Although localized proteotoxic stress within mitochondrial IMS does not induce ER-UPR, its artificial activation helps cells to better withstand the IMS proteotoxicity. Furthermore, overexpression of individual components of ER-mitochondria contact sites is found to be beneficial for general mitochondrial proteotoxic stress, in an Ire1-Hac1-independent manner.

Keywords: ER stress; ER-mitochondria contact sites; Mito-UPR; Protein homeostasis; Proteotoxic stress; Unfolded protein response.


Conflict of interest statement

The authors declare no competing interests.

Figures

Fig. 1
Fig. 1
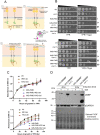
Proteotoxic stress in mitochondrial sub-compartments leads to growth defects and mitochondrial fragmentation of yeast cells. Ai and Aii A schematic representation of DNA cassette used for integration in yeast genome for expression and targeting of stressor proteins (and folded protein control) to mitochondrial intermembrane space (IMS) and matrix (MM). Cyb2SS indicates a signal sequence of yeast cytochrome b2 (Cyb2) (Ai) which is a bipartite targeting signal of total 167 amino acids containing N-terminal positively charged presequence (shown in gray) followed by hydrophobic membrane sorting stop transfer sequence of 19 amino acids shown in orange. Cyb2SS is used for specific targeting to mitochondrial IMS. The truncated version of Cyb2SS (Cyb2Δ19) which is deleted of stop transfer sequence (Aii) is used for specific targeting to mitochondrial matrix (MM). The proteins are expressed from the inducible Gal1 promoter and the Cyc1 terminator has been used for transcription termination (Gal1p and Cyc term in the schematic, respectively). Aiii Schematic representation of stressor proteins (and control) used for generating mitochondria IMS or MM specific stress model in yeast. Maltose-binding protein or wild-type MBP (as control of folded exogenous protein) from E. coli, its slow folding mutant version, DMMBP containing two substitutions V8G and Y283D and a third protein PMD which forms an amyloid type of aggregates are shown schematically. B Drop-dilution assay of yeast strains expressing the misfolded and aggregation-prone stressor proteins DMMBP and PMD along with control protein MBP targeted to mitochondrial IMS and matrix. Yeast strains grown until mid-log phase (OD600 0.5) were serially diluted (1:10) and spotted on solid agar media without inducer (YPR) and with inducer [YPR + 1% gal (yeast-extract-peptone-raffinose + 1% galactose as inducer)]. Slow growth phenotype of IMS-PMD, IMS-DMMBP, and MM-PMD strains are visible exclusively after induction of expression of stressor proteins in media with the inducer (YPR-gal plates) in comparison to the control (YPR plates). “I” and “M” indicate spots with visible growth phenotype in the case of IMS-PMD/DMMBP and MM-PMD strains, respectively. No growth phenotype was observed in YPR-gal plates in case of wild type yeast strain or strains expressing control folded protein MBP. Growth assay was performed at least three times and one representative picture has been shown. Plate pictures were taken after 36h of incubation at 30°C. C. Growth curves of Wt, IMS-MBP, IMS-DMMBP, and IMS-PMD strains were plotted after growing all the strains in liquid media without inducer (YPR) (upper panel) and with inducer (YPR + 1%gal) (lower panel). As shown in panel B in solid agar media, in media without inducer (YPR), all strains grow similarly (upper panel). In contrast, in presence of the proteotoxic stress due to the expression of stressor proteins DMMBP and PMD by galactose induction (YPR + gal media), prominent growth defect is visible in the case of IMS-DMMBP and IMS-PMD strains compared to Wt strain (lower panel). D Similar to panel C, growth curves of MM-MBP, MM-DMMBP, and MM-PMD strains are shown along with Wt yeast cells as control.E–F. Confocal fluorescence microscopy images of mitochondria of yeast strains (D panel-IMS-PMD and E panel-MM-PMD) by mitochondria-targeted yeGFP (yeast enhanced GFP) in the absence (upper panels) and presence (lower panels) of galactose (inducer of mitochondria-targeted stressor proteins). The upper panels show (without inducer) a tubular network of healthy mitochondria and lower panels (with inducer) display fragmentation and disruption of the tubular network of mitochondria due to proteotoxic stress. The scalebar represents 5 µm
Fig. 2
Fig. 2
Disrupting ER-UPR signalling is harmful during mitochondrial IMS proteotoxic stress while it imparts cellular fitness during matrix stress. A A schematic picture depicting ER-UPR signalling events of yeast S. cerevisiae. Step 1, ER-transmembrane protein Ire1 is the sole sensor of ER-UPR in yeast. Ire1 has a sensory domain within ER lumen (luminal domain or LD) and cytosol exposed domains harbouring kinase (KD) and RNAse activities (RnaseD). Step 2, upon sensing the stress within ER lumen, Ire1 binds to the misfolded proteins leading to its activation and oligomerization. Step 3, activated Ire1 binds and splices the HAC1 mRNA by its RNAse activity. Step 4, Spliced HAC1 mRNA translates to Hac1p protein and translocates to nucleus where it acts as a transcription factor to upregulate UPR-responsive genes. B Upper panel: IMS-PMD, MM-PMD, IMS-PMD-ire1Δ, and MM-PMD-ire1Δ strains were spotted along with wild-type yeast strain and ire1Δ strains as controls on YPR and YPR + gal plates to assess the any changes in growth phenotypes of IMS-PMD and MM-PMD strains in combination with ire1Δ. Plate pictures were captured after 52 h of incubation at 30 °C to capture the prominent growth defect of IMS-PMD-ire1Δ (denoted as I+) compared to IMS-PMD (I) and growth phenotype alleviation of MM-PMD-ire1Δ (denoted as M) compared to MM-PMD (M). Lower panel: IMS-PMD, MM-PMD, IMS-PMD-hac1Δ, and MM-PMD-hac1Δ strains were spotted and pictures were taken after 52 h of incubation at 30 °C to display the prominent growth defect of IMS-PMD- hac1Δ (I+) compared to IMS-PMD (I) and growth rescue of MM-PMD-hac1Δ (M) compared to MM-PMD (M). “*” indicates a contaminating spot due to spillage during spotting. C Growth curves of Wt, ire1Δ, hac1Δ, IMS-PMD, IMS-PMD-ire1Δ, IMS-PMD-hac1Δ strains were plotted after growing all the strains in liquid media without inducer (YPR) (upper panel) and with inducer (YPR + 1%gal) (lower panel). As shown in panel B in solid agar media, in media without inducer (YPR), all strains grow similarly (upper panel). In contrast, in presence of the proteotoxic stress due to the expression of stressor protein PMD by galactose induction (YPR + gal media), prominent growth defect is visible in the case of IMS-PMD strain compared to Wt strain (lower panel). Like Wt strain, ire1Δ, hac1Δ strains do not exhibit any difference in growth rate in YPR + gal media but when combined with IMS-PMD, IMS-PMD-ire1Δ, IMS-PMD-hac1Δ strains grow slower than IMS-PMD strain in YPR + gal media indicating the importance of ER-UPR signalling by IRE1-HAC1 pathway in stress tolerance during mitochondrial IMS proteotoxic stress. D Western blot by anti-MBP antibody to show the steady-state level of stressor protein DMMBP was performed using yeast whole-cell lysates made from IMS-DMMBP and IMS-DMMBP-ire1Δ strains, after 4 h and 8 h of galactose induction along with uninduced control. Middle and lower panel: GAPDH level and Amido-back stained PVDF membrane are shown as loading controls
Fig. 3
Fig. 3
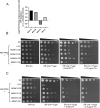
Inducing ER stress imparts cellular fitness against IMS proteotoxic stress but aggravates matrix proteotoxic stress in an IRE1-dependent manner. A Transcript levels of mitochondrial IMS oxidative folding machinery and small Tim proteins which act as chaperones and work in concert with the oxidative folding machinery were plotted. The Y-axis represents the Log2fold change of transcript levels compared to untreated control cells. Microarray data of yeast after DTT-induced ER stress compared to untreated control, as reported previously (Maity et al. 2016) was analyzed to plot the bars. B Drop-dilution assay of yeast strains expressing the stressor proteins DMMBP and PMD along with control protein MBP targeted to mitochondrial IMS (IMS-MBP, IMS-DMMBP and IMS-PMD) along with wild-type yeast strain as control, by spotting on the control plate (YPR), with inducer plate (YPR + gal) and on inducer with ER stressors (0.5 µg/ml) and DTT (5 mM) was performed as described in Fig. 1C. “I” indicates spots with visible growth phenotype in the case of IMS-DMMBP and IMS-PMD strains, while “I-” indicates alleviation in the phenotype of IMS-PMD strain while combined with treatment with ER stressors tunicamycin or DTT. The arrowheads indicate alleviation of phenotypes in plates with ER stressors combined with IMS proteotoxic stress in comparison to only IMS proteotoxic stress. Plate pictures were taken after 48 h of incubation at 30 °C. Experiments were performed at least three times and one representative picture has been displayed. C. Similar to panel B, MM-MBP, MM-DMMBP, and MM-PMD strains along with wild-type yeast strains were spotted on YPR, YPR + gal, and YPR + gal with ER stressors (0.5 µg/ml) and DTT (5 mM) plates as described in Fig. 1C. The arrowheads indicate an aggravation of phenotypes in plates with ER stressors combined with matrix proteotoxic stress in comparison to only matrix proteotoxic stress. Plate pictures were taken after 48 h of incubation at 30 °C. “M” indicates spots with visible growth phenotype in case of MM-PMD, while “M + ” indicates aggravation of phenotype of MM-PMD strain while combined with treatment with ER stressors tunicamycin or DTT. D IMS-PMD, MM-PMD, IMS-PMD- ire1Δ, and MM-PMD- ire1Δ strains were spotted along with wild-type yeast strain and ire1Δ strain as controls on YPR, (YPR + gal) and (YPR + gal) with ER stressors (0.5 µg/ml) and DTT (5 mM) plates as described in panel A and B. “I” and “M” indicate spots with visible growth phenotype in case of IMS-PMD and MM-PMD strains respectively on YPR + gal plates, while “I-” indicates alleviation of the phenotype of IMS-PMD strain when spotted on YPR + gal plates with ER stressors, DTT or tunicamycin and “M + ” indicates aggravation in the phenotype of MM-PMD strain while combined with ER stressors
Fig. 4
Fig. 4
Mitochondrial proteotoxic stress in its IMS or matrix does not induce ER-UPR. A Schematic representation of the UPRE-GFP reporter that is integrated into the genome of wild type yeast strain (YMJ003 strain) (Jonikas et al. ; Maity et al. 2016) used in this study. GFP is expressed under the UPR element (UPRE) and reports for induction of ER-UPR. As the reporter of cellular transcription and translation, a second fluorescent reporter protein, mCherry is expressed under constitutive Tef2 promoter. B Mitochondrial sub-compartment-specific proteotoxic stressor model yeast strains (IMS-PMD/DMMBP and MM-PMD/DMMBP) along with control strains expressing folded protein (IMS-MBP, MM-MBP), wild-type yeast strain and the yeast strain expressing the control protein MBP or stressor protein DMMBP specifically targeted to the endoplasmic reticulum (ER) were grown until mid-log phase and stressor (or control) proteins were induced with 1% galactose. After 4h and 8 h of galactose induction, GFP and mCherry fluorescence were measured by flow cytometry. The ratio of mean GFP and mCherry fluorescence was plotted as bar plots for all strains. Error bars represent standard deviation between repeats (n = 3). P value was calculated by unpaired Student’s T-test (2-tailed). NS indicates “not significant” with a P value of more than 0.05. C As described in panel B, yeast strains expressing the control protein MBP or stressor proteins DMMBP and PMD specifically targeted to the endoplasmic reticulum (ER) were taken and GFP and mCherry fluorescence were measured by flow cytometry after 4 h and 8 h of galactose induction (4h Ind and 8h Ind, respectively). At the same time points, uninduced cells (UI) were also taken for GFP and mCherry fluorescence measurement by flow cytometry. The ratio of mean GFP and mCherry fluorescence was plotted as bar plots for all strains. Error bars represent standard deviation between repeats (n = 3). P value was calculated by unpaired Student’s T-test (2-tailed). D Western blot by Kar2 polyclonal antibody was performed using yeast whole-cell lysates made from wild-type yeast strain, IMS-PMD and MM-PMD strain after 4h and 12h of galactose induction along with uninduced control (cells taken out at “0” time point of galactose induction). The Amido black-stained PVDF membrane after Western transfer of proteins has been shown as the loading control
Fig. 5
Fig. 5
Overexpression of components of ER-mitochondria encounter structure (ERMES) leads to alleviation of proteotoxic stress phenotype of mitochondrial IMS and matrix. A Transcript levels of yeast ERMES components after DTT-induced ER stress measured by microarray as reported previously (Maity et al. 2016) was plotted. The Y-axis represents the Log2fold change of transcript levels compared to untreated control cells. B–C Drop-dilution assay of yeast strains IMS-PMD (panel B) and MM-PMD (panel C) transformed with plasmids overexpressing (OE) individual components of yeast ERMES (MDM10, MDM12, MDM34, and MMM1) was performed by spotting the yeast strains along with wild-type yeast strain and same strains with empty vector (EV) as controls on the (SR-Ura) plates (synthetic media without uracil with 2% raffinose), with inducer plate (SR-Ura + gal) and (SR-Ura + gal) with ER stressors, tunicamycin (0.5 µg/ml), or DTT (5 mM) as described in Fig. 1C. Plate pictures were taken after 48 h of incubation at 30 °C
Fig. 6
Fig. 6
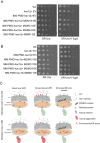
Overexpression of individual ERMES subunits alleviates mitochondrial proteotoxic stress phenotype independent of ER-UPR signalling. A–B Drop-dilution assay of yeast strains IMS-PMD-hac1Δ (panel A) and MM-PMD hac1Δ (panel B) transformed with plasmids overexpressing (OE) individual components of yeast ER-mitochondria contact sites (MDM10, MDM12, MDM34, and MMM1) was performed by spotting the strains along with wild-type yeast strain and same strains with empty plasmid vector (EV) as controls (SR-Ura), (SR-Ura + gal), (SR-Ura + gal) with ER stressors, tunicamycin (0.5 µg/ml), or DTT (5 mM) as described in Fig. 1C. Plate pictures were taken after 48 h of incubation at 30 °C. C A comprehensive model of the current work is summarized in panel C. The upper box of panel C shows the proteotoxic stress in mitochondrial IMS. The basal level of UPR is beneficial for stress tolerance for mitochondrial IMS proteotoxicity. Furthermore, activated ER-UPR by environmental stressors helps to ameliorate the IMS proteotoxic stress. Apart from role of ER-UPR, enhanced ER-mitochondria contact sites by ERMES complex is also helpful in stress tolerance in IMS in an ER-UPR-independent way. The lower box shows proteotoxic stress in mitochondrial matrix. In case of matrix stress, even basal UPR is not beneficial and mitochondrial matrix proteotoxicity is better managed if basal ER-UPR is disrupted. In corroboration, activated UPR by ER stressors is detrimental and aggravates the matrix proteotoxicity. Similar to IMS proteotoxic stress, increased ER-mitochondria contacts are also helpful in matrix proteotoxicity

Similar articles

Cited by

References

    1. Ali M, Boosi Narayana Rao K, Majumder P, Sarkar R, Mapa K. Alterations in inter-organelle crosstalk and Ca(2+) signaling through mitochondria during proteotoxic stresses. Mitochondrion. 2021;57:37–46. doi: 10.1016/j.mito.2020.12.003. - DOI - PubMed
    1. Baryshnikova A, et al. Synthetic genetic array (SGA) analysis in Saccharomyces cerevisiae and Schizosaccharomyces pombe. Methods Enzymol. 2010;470:145–179. doi: 10.1016/S0076-6879(10)70007-0. - DOI - PubMed
    1. Carreras-Sureda A, et al. Non-canonical function of IRE1alpha determines mitochondria-associated endoplasmic reticulum composition to control calcium transfer and bioenergetics. Nat Cell Biol. 2019;21:755–767. doi: 10.1038/s41556-019-0329-y. - DOI - PMC - PubMed
    1. Caspersen C, et al. Mitochondrial Abeta: a potential focal point for neuronal metabolic dysfunction in Alzheimer's disease. FASEB J. 2005;19:2040–2041. doi: 10.1096/fj.05-3735fje. - DOI - PubMed
    1. Chakraborty K, et al. Chaperonin-catalyzed rescue of kinetically trapped states in protein folding. Cell. 2010;142:112–122. doi: 10.1016/j.cell.2010.05.027. - DOI - PubMed

Publication types

MeSH terms

Substances

LinkOut - more resources