

Using Biomass Gasification Mineral Residue as Catalyst to Produce Light Olefins from CO, CO2 , and H2 Mixtures
- PMID: 35294803
- PMCID: PMC9314133
- DOI: 10.1002/cssc.202200436
Using Biomass Gasification Mineral Residue as Catalyst to Produce Light Olefins from CO, CO2 , and H2 Mixtures
Abstract
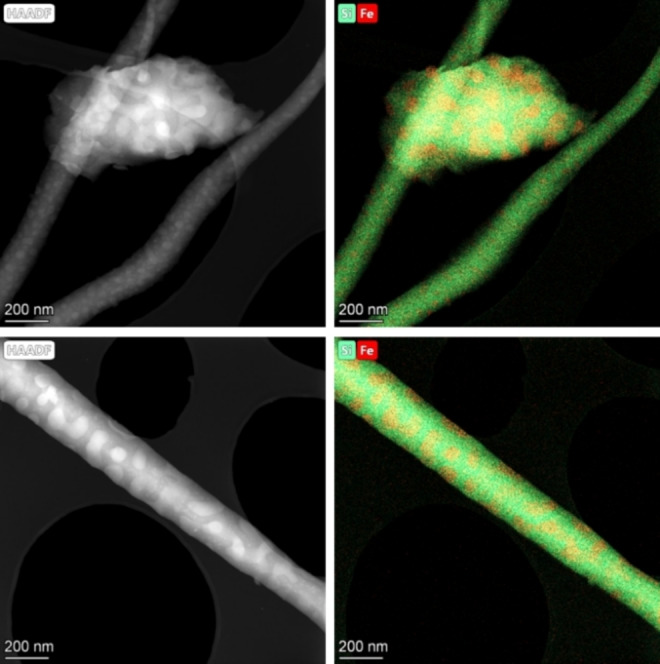
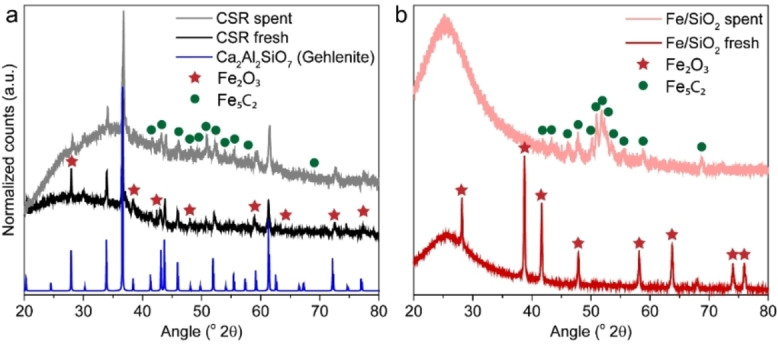
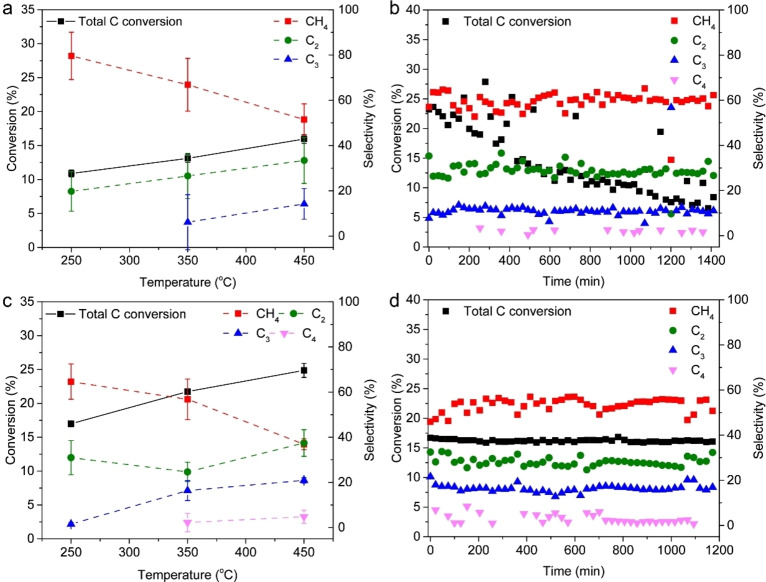
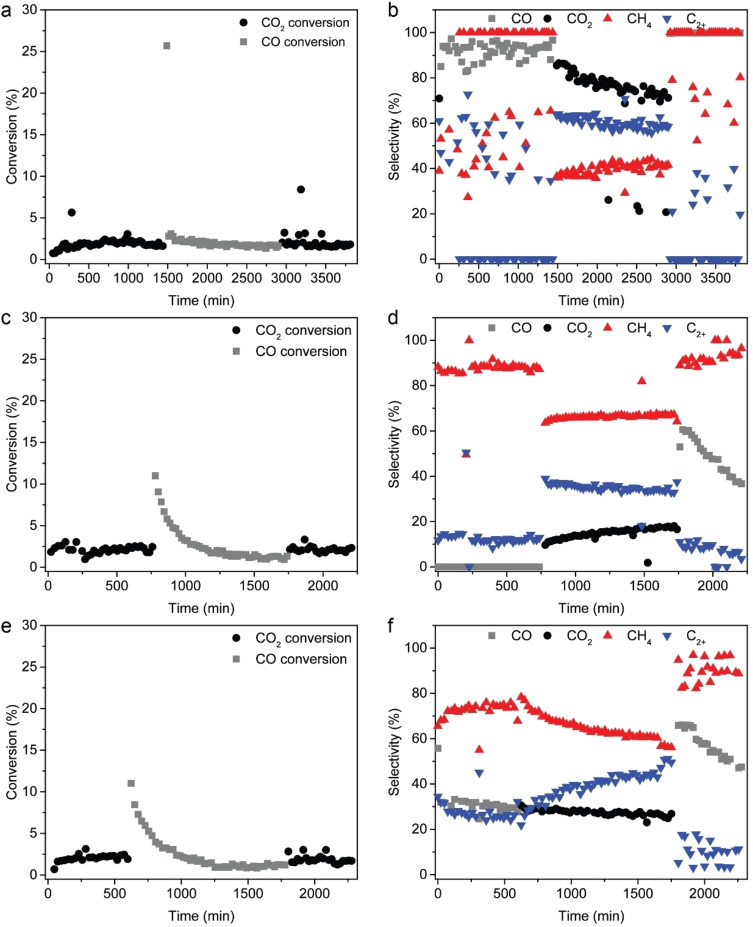
Gasification is a process to transform solids, such as agricultural and municipal waste, into gaseous feedstock for making transportation fuels. The so-called coarse solid residue (CSR) that remains after this conversion process is currently discarded as a process solid residue. In the context of transitioning from a linear to a circular society, the feasibility of using the solid process residue from waste gasification as a solid catalyst for light olefin production from CO, CO2 , and H2 mixtures was investigated. This CSR-derived catalyst converted biomass-derived syngas, a H2 -poor mixture of CO, CO2 , H2 , and N2 , into methane (57 %) and C2 -C4 olefins (43 %) at 450 °C and 20 bar. The main active ingredient of CSR was Fe, and it was discovered with operando X-ray diffraction that metallic Fe, present after pre-reduction in H2 , transformed into an Fe carbide phase under reaction conditions. The increased formation of Fe carbides correlated with an increase in CO conversion and olefin selectivity. The presence of alkali elements, such as Na and K, in CSR-derived catalyst increased olefin production as well.
Keywords: CO2 hydrogenation; Fischer-Tropsch; biomass residue; iron; olefins.
© 2022 The Authors. ChemSusChem published by Wiley-VCH GmbH.
Conflict of interest statement
The authors declare no conflict of interest.
Figures
Similar articles
-
Using Biomass Gasification Mineral Residue as Catalyst to Produce Light Olefins from CO, CO2 , and H2 Mixtures.ChemSusChem. 2022 Jun 8;15(11):e202200851. doi: 10.1002/cssc.202200851. Epub 2022 May 17. ChemSusChem. 2022. PMID: 35581132
-
Role of Zr loading into In2O3 catalysts for the direct conversion of CO2/CO mixtures into light olefins.J Environ Manage. 2022 Aug 15;316:115329. doi: 10.1016/j.jenvman.2022.115329. Epub 2022 May 21. J Environ Manage. 2022. PMID: 35658264
-
Cobalt carbide nanoprisms for direct production of lower olefins from syngas.Nature. 2016 Oct 6;538(7623):84-87. doi: 10.1038/nature19786. Nature. 2016. PMID: 27708303
-
Catalysts for the Conversion of CO2 to Low Molecular Weight Olefins-A Review.Materials (Basel). 2021 Nov 17;14(22):6952. doi: 10.3390/ma14226952. Materials (Basel). 2021. PMID: 34832354 Free PMC article. Review.
-
Recent Advances Hydrogenation of Carbon Dioxide to Light Olefins over Iron-Based Catalysts via the Fischer-Tropsch Synthesis.ACS Omega. 2024 Jun 6;9(24):25610-25624. doi: 10.1021/acsomega.4c03075. eCollection 2024 Jun 18. ACS Omega. 2024. PMID: 38911759 Free PMC article. Review.
Cited by
-
Thermally stable metal-organic framework based iron 2,6-naphthalenedicarboxylic catalyst (Fe-NDC) for syngas conversion to olefin.Sci Rep. 2025 Jul 22;15(1):26526. doi: 10.1038/s41598-025-09332-0. Sci Rep. 2025. PMID: 40691208 Free PMC article.
-
Redefining the Symphony of Light Aromatic Synthesis Beyond Fossil Fuels: A Journey Navigating through a Fe-Based/HZSM-5 Tandem Route for Syngas Conversion.ACS Catal. 2024 Oct 1;14(20):15150-15196. doi: 10.1021/acscatal.4c03941. eCollection 2024 Oct 18. ACS Catal. 2024. PMID: 39444526 Free PMC article. Review.
References
-
- Puga A. V., Catal. Sci. Technol. 2018, 8, 5681–570.
-
- United Nations, Paris Agreement, 2015.
-
- Hashimoto K., Yamasaki M., Fujimura K., Matsui T., Izumiya K., Komori M., El-Moneim A. A., Akiyama E., Habazaki H., Kumagai N., Kawashima A., Asami K., Mater. Sci. Eng. A 1999, 267, 200–206.
-
- Davis S. J., Caldeira K., Matthews H. D., Science 2010, 329, 1330–1333. - PubMed
MeSH terms
Substances
Grants and funding
LinkOut - more resources
Full Text Sources
Miscellaneous
