. 2022 Mar 15;38(11):110520.
doi: 10.1016/j.celrep.2022.110520.

RORγt phosphorylation protects against T cell-mediated inflammation

Affiliations

RORγt phosphorylation protects against T cell-mediated inflammation

Shengyun Ma et al. Cell Rep. .

Abstract

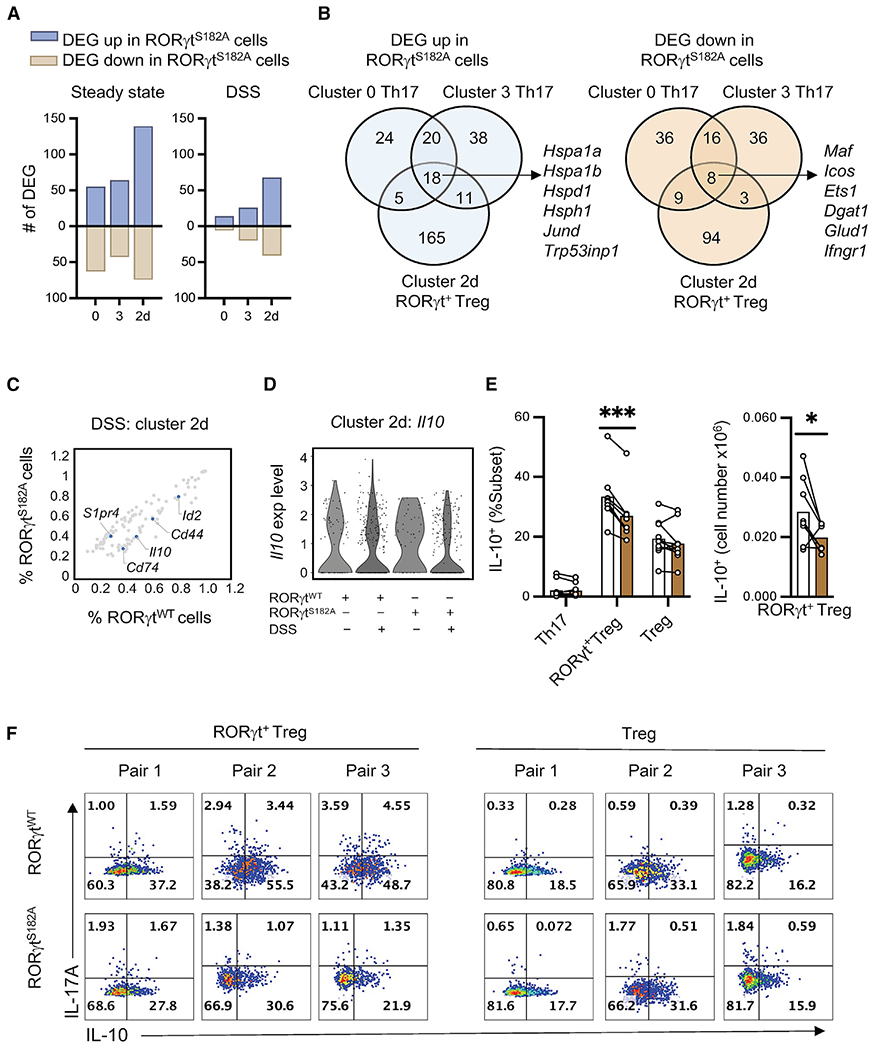
RAR-related orphan receptor-γ (RORγt) is an essential transcription factor for thymic T cell development, secondary lymphoid tissue organogenesis, and peripheral immune cell differentiation. Serine 182 phosphorylation is a major post-translational modification (PTM) on RORγt. However, the in vivo contribution of this PTM in health and disease settings is unclear. We report that this PTM is not involved in thymic T cell development and effector T cell differentiation. Instead, it is a critical regulator of inflammation downstream of IL-1β signaling and extracellular signal regulated kinases (ERKs) activation. ERKs phosphorylation of serine 182 on RORγt serves to simultaneously restrict Th17 hyperactivation and promote anti-inflammatory cytokine IL-10 production in RORγt+ Treg cells. Phospho-null RORγtS182A knockin mice experience exacerbated inflammation in models of colitis and experimental autoimmune encephalomyelitis (EAE). In summary, the IL-1β-ERK-RORγtS182 circuit protects against T cell-mediated inflammation and provides potential therapeutic targets to combat autoimmune diseases.

Keywords: EAE; ERK; IL-10; IL-17A; RORγt; RORγt(+) Tregs; Th17; colitis; inflammation; phosphorylation.


Conflict of interest statement

Declaration of interests B.S. has been a consultant to Ferring Research Institute, Gelesis, HOST Therabiomics, Intercept Pharmaceuticals, Mabwell Therapeutics, Patara Pharmaceuticals, and Takeda. The University of California, San Diego (B.S.’s institution) has received research support from Axial Biotherapeutics, BiomX, CymaBay Therapeutics, NGM Biopharmaceuticals, Prodigy Biotech, and Synlogic Operating Company. B.S. is the founder of Nterica Bio.

Figures

Figure 1.
Figure 1.. Normal T cell development and differentiation in RORγtS182A mice
(A) Proportion of modified and unmodified peptides identified by tandem mass spectrometry (MS/MS) mapping to murine RORγt from whole-cell lysates (WCL) of HEK293 cells transfected with a 2xFLAG-mRORγt expression construct for 48 h. Phosphorylation (p), methylation (m), and ubiquitination (u). (B) Model diagram of RORγt protein domains. Black vertical line indicates the position of the evolutionarily conserved serine 182. AF-1, activation function domain 1; DBD, DNA-binding domain; LBD, ligand-binding domain. (C) Weights of 2- to 4-month-old wild-type (RORγtWT, n = 49) and RORγtS182A (n = 57) adult mice obtained from heterozygous crosses. Each dot represents the result from 1 mouse. (D) Representative flow cytometry analysis of cell surface CD4 and CD8α on splenocytes from RORγtWT and RORγtS182A cohoused littermates. This experiment was repeated 3 times on independent biological samples with similar results. (E) UMAP plots depicting the transcriptomes of immune cell clusters (top) and cluster 2 subsets (bottom) obtained from colonic lamina propria (cLP) CD4+ T cells (10X Genomics droplet-based 3′ scRNA-seq). (F) Violin plots of selected gene expressions in cells from the indicated clusters. (G) Proportions of colonic Cd4+Cd3e+ (left) and Cd4+Cd3e+Foxp3+ (right, cluster 2) T cells in each cluster from 2 pairs of RORγtWT and RORγtS182A littermates. Each bar represents the sample mean. * p < 0.05 (ratio paired t test). (H) Heatmap of mean scaled average expression of selected genes from the indicated clusters. (I) Violin plots (left) and UMAP (right) showing expression of Il17a and Il1r1 in colonic Th17 cell subsets (clusters 0 and 3) in steady-state RORγtWT and RORγtS182A mice.
Figure 2.
Figure 2.. RORγtS182A mice have exacerbated diseases in DSS-induced colitis
(A) Weight changes of RORγtWT and RORγtS182A cohoused littermates challenged with 2% DSS in drinking water for 7 days and monitored for another 3 days. Each bar represents the sample mean. Each dot represents the result from 1 mouse. * p < 0.05 (multiple t test). (B) Left: Representative bright-field images of colons from (A). Right: Summarized colonic lengths of DSS-treated RORγtWT (n = 5) and RORγtS182A (n = 6) mice harvested on day 10. * p < 0.05 (t test). (C) Left: Representative colonic sections from (B). Right: Summarized score of colonic inflammatory infiltrates in DSS-treated RORγtWT (n = 4) and RORγtS182A (n = 5) mice. Each bar represents the sample mean. * p < 0.05 (t test). (D) Proportion and absolute number of IL-17A+ producing Th17 (T cell receptor [TCR]β+RORγt+Foxp3), RORγt+ Treg (TCRβ+RORγt+Foxp3+), and conventional Tregs (TCRβ+RORγtFoxp3+) in colons from DSS-challenged RORγtWT and RORγtS182A mice. Each dot represents the result from 1 mouse. Each bar represents the sample mean. *p < 0.05; n.s., not significant (paired t test). (E) Representative flow cytometry analysis of colonic CD4+ T subsets and IL-17A and IL-10 production capacities in Th17 cells from DSS-treated mice. (F) Linear regression analysis of Il17a and Il1r1 average expressions in colonic Th17 subsets from the indicated conditions as determined by scRNA-seq. (G) IL-1Rhigh proportion and IL-1R geometric mean fluorescence (gMFI) in colonic RORγtWT and RORγtS182A Th17 cells from DSS-challenged mice. Each dot represents the result from 1 mouse. Each bar represents the sample mean. * p < 0.05 (paired t test). (H) Representative flow cytometry analysis of IL-1R in colonic Th17 cells from DSS-challenged mice harvested on day 10. Forward scatter (FSC).
Figure 3.
Figure 3.. Common and distinct RORγtS182-dependent gene programs in colonic Th17 and RORγt+ Treg cells
(A) Number of RORγtS182-dependent genes (DEG, p < 0.05) in colonic Th17 (cluster 0 and 3) and RORγt+ Treg cells (cluster 2d) from steady-state or DSS-challenged mice. (B) Venn diagram showing overlap and subset-specific RORγtS182-regulated genes in Th17 and RORγt+ Treg cells from (A). (C) Percentage of cells expressing RORγtS182-dependent genes (gray dots, p < 0.05) in colonic RORγt+ Treg cells (subset 2d) from DSS-challenged RORγtWT and RORγtS182A mice. Select genes were labeled and highlighted in blue. (D) Violin plot of Il10 expression in RORγt+ Treg cells (subset 2d) from control or DSS-challenged RORγtWT and RORγtS182A mice. (E) Proportion and cell number of IL-10-producing colonic Th17, RORγt+ Treg, and conventional Treg cells from DSS-challenged RORγtWT and RORγtS182A mice. Each dot represents the result from 1 mouse. Each bar represents the sample mean. *p < 0.05; ***p < 0.001; n.s., not significant (paired multiple t test). (F) Representative flow cytometry analysis of IL-17A and IL-10 in colonic RORγt+ Treg and conventional Treg cells from DSS-challenged mice harvested on day 10.
Figure 4.
Figure 4.. Transfer of RORγtS182A CD4+ T cells promote exacerbated wasting in Rag1−/− mice
(A) Weight changes of Rag1−/− mice receiving RORγtWT (n = 6) or RORγtS182A (n = 6) naive CD4+ T cells. Each dot represents the result from 1 mouse. Each bar represents the sample mean. **p < 0.01 and ***p < 0.001 (multiple t test). (B) RNA expression level of Il17a and Il10 in total cLP cell lysate from Rag1−/− mice in (A). Each dot represents the result from 1 mouse. Each bar represents the sample mean. *p < 0.05; n.s., not significant (t test). (C) Right: Activated RORγtWT (transduced with GFP expressing pMIG construct) or RORγtS182A (transduced with Thy1.1 expressing MSCV construct) CD4+ T cells were mixed in a 1:1 ratio and injected into Rag1−/− mice. Left: Summarized proportion of IL-17A+ and IL-10+ colonic Th17 and RORγt+ Treg cells from Rag−/− recipients 33 days post-transfer (n = 5). Each line represents results from same Rag1−/− recipient. Each bar represents the mean from 5 Rag1−/− recipients. *p < 0.05; n.s., not significant (multiple t test). (D) Representative flow cytometry analysis of IL-17A and IL-10 in colonic Th17 and RORγt+ Treg cells from (C).
Figure 5.
Figure 5.. RORγtS182A mice challenged in the EAE model experienced more severe disease
(A) Weight change of MOG-immunized RORγtWT (n = 14) and RORγtS182A (n = 23) mice. Each dot represents the result from 1 mouse. Each bar represents the sample mean. * p < 0.05; n.s., not significant (multiple t test). (B) Disease score of mice from (A). Each dot represents the result from 1 mouse. Each bar represents the sample mean. *p < 0.05; n.s., not significant (multiple t test). (C) Proportion of Th17, RORγt+ Treg, and conventional Treg cells in healthy spleens as well as spleens and spinal cords from MOG-immunized RORγtWT and RORγtS182A mice. Each dot represents the result from 1 mouse. Each bar represents the sample mean. (D) Cell numbers of CD4+ and IL-17A+ Th17 cells, and gMFI of RORγt in the spleens of MOG-immunized mice from (A) harvested at the peak of disease (day 19). Each dot represents the result from 1 mouse. Each bar represents the sample mean. *p < 0.05; n.s., not significant (t test). (E) Cell numbers of CD4+ and IL-17A+Th17 cells and gMFI of RORγt in the spinal cord MOG-immunized mice from (A) harvested at the peak of disease (day 19). Each dot represents the result from 1 mouse. Each bar represents the sample mean. *p < 0.05; n.s., not significant (t test). (F) Cell numbers of macrophages (MØ, CD11b+F4/80+) and dendritic cells (DC, CD3εCD11c+) in the spinal cord of MOG-immunized mice harvested at the peak of disease (day 19). Each dot represents the result from 1 mouse. Each bar represents the sample mean. *p < 0.05; n.s., not significant (t test). (G) Normalized mRNA expression of select genes in the immune infiltrates of the spinal cords at the peak of EAE disease from MOG-immunized RORγtWT and RORγtS182A mice as detected by qRT-PCR. Each dot represents the result from 1 mouse. Each bar represents the sample mean. *p < 0.05, **p < 0.01 (paired multiple t test).
Figure 6.
Figure 6.. Cultured RORγtS182A Th17 cells harbor augmented cytokine production potential in response to IL-1β signaling
(A) Left: Workflow of the co-culture experiment using the indicated transduced vectors and marked RORγtWT and RORγtS182A CD4+ T cells polarized in the presence of IL-6 (20 ng/mL), IL-1β (20 ng/mL), IL-23 (25 ng/mL), and TGF-β (0.3 ng/mL). Right: Summarized proportion of IL-17A+ in cultured cells 3 days postpolarization. Each line represents results from 1 experimental well. ****p < 0.0001 (paired t test). (B) Summarized proportion of IL-17A+ in Th17 cells cultured in the indicated conditions. Each dot represents the result from 1 mouse. Each bar represents the sample mean. *p < 0.05, **p < 0.01; n.s., not significant (paired multiple t test). (C) Representative flow cytometry analysis of IL-17A and IL-17F expression in cultured Th17 cells from (B). (D) RORγt gMFI in cultured Th17 cells from (B). Each dot represents the result from an independent experiment. Each bar represents the sample mean. n.s., not significant. (E) Immunoblot (IB) analysis of total RORγt or RORγt phosphorylated at S182 (pS182) in cultured Th17 WCL from 2 pairs of RORγtWT and RORγtS182A littermates. (F) Proportion of IL-17A+ among cultured RORγtS182A Th17 cells transduced with retroviruses carrying RORγtWT (circle) (Huh et al., 2011), RORγtS182A (triangle), or RORγtS182D (square) expression constructs. Each dot represents the result from an independent experiment. Each bar represents the sample mean. *p < 0.05 (t test). (G) HEK293 cells transfected with empty or 2xFLAG-RORγt expression constructs for 16 h were stimulated with the indicated cytokines. RORγt was captured by anti-FLAG beads and pS182 status was detected by immunoblot.
Figure 7.
Figure 7.. ERK2 phosphorylation of RORγt protects against exacerbated DSS-induced colitis
(A) HEK293 cells transfected with empty or 2xFLAG-RORγt expression constructs for 16 h were treated with dimethylsulfoxide (DMSO, Veh) or ERK inhibitor (PD0325901, 5μM) and stimulated with the indicated cytokines. RORγt was captured by anti-FLAG beads and pS182 status was detected by immunoblot. (B) HEK293 cells transfected with empty or 2xFLAG-RORγt expression constructs for 16 h. RORγt was captured by anti-FLAG beads and incubated with recombinant ERK2 in vitro. Phospho-S182 status was detected by immunoblot. This experiment was repeated twice with similar results. (C) Representative images from proximity ligation assay (PLA) indicating interactions between RORγt and ERK1/2 in wild-type cultured Th17 cells. (D) Representative flow cytometry analysis of IL-17A expression in wild-type Th17 cells polarized under IL-6 (20 ng/mL), IL-1β (20 ng/mL), and IL-23 (25 ng/mL) in the presence or absence of ERK inhibitor (PD0325901, 5μM) at 48 h. Cells were harvested and analyzed at 72 h. (E) Representative flow cytometry analysis of IL-10 expression in wild-type RORγt+ Treg cells polarized under IL-6 (20 ng/mL), IL-1β (20 ng/mL), and TGF-β (5 ng/mL) in the presence or absence of ERK inhibitor (PD0325901, 5μM) at 48 h. Cells were harvested and analyzed at 72 h. (F) Weight changes in RORγtWT (left) and RORγtS182A (right) cohoused littermates challenged with 2% DSS in drinking water for 7 days, followed by regular water for 3 days. DMSO (Veh) or PD0325901 containing saline was administered intraperitoneally (i.p.) at 0.5 mg/kg on days 4 and 6. The results displayed were the average and standard deviation of 3 independent experiments combined with a total of 5 mice in each condition. *p < 0.05 (paired multiple t test).

Similar articles

Cited by

References

    1. Abbasi N, Long T, Li Y, Yee BA, Cho BS, Hernandez JE, Ma E, Patel PR, Sahoo D, Sayed IM, et al. (2020). DDX5 promotes oncogene C3 and FABP1 expressions and drives intestinal inflammation and tumorigenesis. Life Sci. Alliance 3, e202000772. 10.26508/lsa.202000772. - DOI - PMC - PubMed
    1. Abe Y, Fujiwara Y, Takahashi H, Matsumura Y, Sawada T, Jiang S, Nakaki R, Uchida A, Nagao N, Naito M, et al. (2018). Histone demethylase JMJD1A coordinates acute and chronic adaptation to cold stress via thermogenic phospho-switch. Nat. Commun 9, 1566. 10.1038/s41467-018-03868-8. - DOI - PMC - PubMed
    1. Agrawal A, Dillon S, Denning TL, and Pulendran B (2006). ERK1−/− mice exhibit Th1 cell polarization and increased susceptibility to experimental autoimmune encephalomyelitis. J. Immunol 176, 5788–5796. 10.4049/jimmunol.176.10.5788. - DOI - PubMed
    1. Bittner S, Afzali AM, Wiendl H, and Meuth SG (2014). Myelin oligodendrocyte glycoprotein (MOG35-55) induced experimental autoimmune encephalomyelitis (EAE) in C57BL/6 mice. J. Vis. Exp, 51275. 10.3791/51275. - DOI - PMC - PubMed
    1. Blom N, Sicheritz-Ponten T, Gupta R, Gammeltoft S, and Brunak S (2004). Prediction of post-translational glycosylation and phosphorylation of proteins from the amino acid sequence. Proteomics 4, 1633–1649. 10.1002/pmic.200300771. - DOI - PubMed

Substances