. 2022 May 18;110(10):1641-1655.e6.
doi: 10.1016/j.neuron.2022.02.017. Epub 2022 Mar 15.

Pericyte-to-endothelial cell signaling via vitronectin-integrin regulates blood-CNS barrier

Affiliations

Pericyte-to-endothelial cell signaling via vitronectin-integrin regulates blood-CNS barrier

Swathi Ayloo et al. Neuron. .

Abstract

Endothelial cells of blood vessels of the central nervous system (CNS) constitute blood-CNS barriers. Barrier properties are not intrinsic to these cells; rather they are induced and maintained by CNS microenvironment. Notably, the abluminal surfaces of CNS capillaries are ensheathed by pericytes and astrocytes. However, extrinsic factors from these perivascular cells that regulate barrier integrity are largely unknown. Here, we establish vitronectin, an extracellular matrix protein secreted by CNS pericytes, as a regulator of blood-CNS barrier function via interactions with its integrin receptor, α5, in endothelial cells. Genetic ablation of vitronectin or mutating vitronectin to prevent integrin binding, as well as endothelial-specific deletion of integrin α5, causes barrier leakage in mice. Furthermore, vitronectin-integrin α5 signaling maintains barrier integrity by actively inhibiting transcytosis in endothelial cells. These results demonstrate that signaling from perivascular cells to endothelial cells via ligand-receptor interactions is a key mechanism to regulate barrier permeability.

Keywords: barrier; central nervous system; endothelial cells; integrin; pericytes; transcytosis; vitronectin.


Conflict of interest statement

Declaration of interests The authors declare no competing interests.

Figures
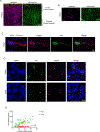
Figure 1.
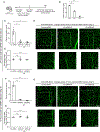
Figure 1.. Vitronectin expression coincides with functional barrier formation and is enriched in CNS pericytes compared to peripheral tissue pericytes
(A, B) Immunostaining of vitronectin (green) and blood vessels (isolectin, magenta) in retina (A) and (B) brain of P7 mouse. (C) In situ hybridization for Vtn (green), Pdgfrb (pericyte gene, magenta) and immunostaining for PECAM1 (vessel marker, red) with DAPI (nuclei, blue) in P7 brain. Dashed lines indicate pericyte nucleus and vessel outline. (D) In situ hybridization for Vtn and Pdgfrb in brain and lung of P7 mouse. (E) Scatter plot between Pdgfrb and Vtn in brain (green) and lung (red). Each dot represents an individual cell, n=60 and 62 cells respectively from N=3 animals. Pearson correlation coefficient r = 0.82 for brain and r = 0.36 for lung.
Figure 2.
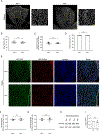
Figure 2.. Vitronectin is essential for blood-CNS barrier integrity
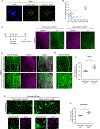
(A) Sulfo-NHS-Biotin (tracer, green) leaks out of blood vessels (isolectin, magenta) in retinas of P10 Vtn−/− mice. Arrowheads show tracer hotspots in Vtn−/− mice, white boxes correspond to higher magnification images in (B). (B) Sulfo-NHS-Biotin leaked out in Vtn−/− mice taken up by neuronal cell bodies (arrowheads). (C) Quantification of vessel permeability in retinas of wildtype and Vtn−/− mice. n = 5 animals per genotype. Mean ± S.D.; ***p < 0.001; Student’s t-test. (D) Leakage of Sulfo-NHS-Biotin (green) from blood vessels (Icam2, magenta) in the cerebellum of P10 Vtn−/− mice. White boxes correspond to higher magnification panels shown. (E) Quantification of vessel permeability in retinas of wildtype and Vtn−/− mice. n = 4 animals per genotype. Mean ± S.D.; ***p < 0.001; Student’s t-test.
Figure 3.
Figure 3.. Vitronectin in plasma is not required for blood-CNS barrier function
(A) Illustration of experimental paradigm to knock-down plasma vitronectin specifically with intravenous injections of siRNAs followed by vitronectin protein level measurement in plasma and evaluation of barrier integrity by leakage assays. (B) Validation of ELISA kit to measure vitronectin protein levels in plasma of wildtype, heterozygotes and vitronectin null mice. n = 2 animals per genotype. Mean ± S.D.; **p < 0.01, ***p < 0.001; one-way ANOVA with Tukey’s post hoc test. (C, F) Vitronectin levels measured by ELISA in plasma of mice injected with control (Ctrl) siRNA or two independent siRNAs targeting vitronectin. 24 hours post last siRNA injection (C) and 72 hours post last siRNA injection (F). n = 3 mice per siRNA in each case. Mean ± S.D.; **p < 0.01, ***p < 0.001; one-way ANOVA with Tukey’s post hoc test. At 24 hour time point, siRNA #1 yields 87.58 ± 1.71% and siRNA #2 yields 94.06 ± 0.83% knockdown of plasma vitronectin. At 72 hour timepoint, siRNA #1 yields 92.73 ± 0.25% and siRNA #2 yields 98.56 ± 0.06% knockdown of plasma vitronectin. (D, E) Sulfo-NHS-Biotin confined to vessels (D) in retinas of mice injected with siRNA targeting vitronectin, 24 hours post last siRNA injection. Corresponding quantification of vessel permeability (E). White boxes correspond to panel of higher magnification images. n = 3 mice per siRNA. Mean ± S.D.; n.s. not significant, p > 0.05; one-way ANOVA with Tukey’s post hoc test. (G, H) Sulfo-NHS-Biotin confined to vessels (G) in retinas of mice injected with siRNA targeting vitronectin, 72 hours post last siRNA injection. Corresponding quantification of vessel permeability (H). White boxes correspond to panel of higher magnification images. n = 3 mice per siRNA. Mean ± S.D.; n.s. not significant, p > 0.05; one-way ANOVA with Tukey’s post hoc test.
Figure 4.
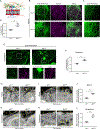
Figure 4.. Vitronectin regulates blood-CNS barrier function by suppressing transcytosis in CNS endothelial cells
(A, B) EM images of HRP halting at tight junctions (arrows) in both retinas (A) and cerebellum (B) of wildtype and Vtn−/− mice. Luminal (L) and abluminal sides indicated by dashed yellow lines. (C) Claudin-5 immunostaining in P10 retinas of wildtype and Vtn−/− mice. (D) Higher magnification images of Claudin-5 (green) and ZO-1 (magenta) in P10 retinas to show expression and localization of tight junction proteins at cell-cell junctions. (E, G) EM images showing HRP-filled vesicles (arrowheads) in endothelial cells of retinas (E) and cerebellum (G) of wildtype and Vtn−/− mice. (F, H) Quantification of tracer-filled vesicles in endothelial cells of retinas (F) and cerebellum (H). n = 4 animals per genotype, 15–20 vessels per animal. Mean ± S.D.; ***p < 0.001, **p < 0.01; Student’s t-test.
Figure 5.
Figure 5.. Vitronectin is not required for normal vessel patterning or pericyte coverage
(A) Tilescan images showing retinal vasculature of P10 retinas in wildtype and Vtn−/− mice. (B-D) Quantification of vessel density (B), capillary branching (C) and radial outgrowth (D) in P10 retinas. n = 6 animals per genotype. Mean ± S.D.; n.s. not significant, p > 0.05; Student’s t-test. (E) P10 retinas of NG2:DsRed+ wildtype and Vtn−/− mice immunostained for ERG1/2/3 (endothelial nuclei, green) and vessels (isolectin, blue). (F, G) Quantification of pericyte coverage (F) and pericyte density (G) in retinas of wildtype and Vtn−/− mice. n = 5 animals per genotype. Mean ± S.D.; n.s. not significant, p > 0.05; Student’s t-test. (H, I) Representative western blots (H) and quantification (I) of PDGFRβ protein levels normalized to Gapdh in whole retinal lysates of P10 wildtype and Vtn−/− mice. n = 3 animals per genotype. Mean ± S.D.; n.s. not significant, p > 0.05; Student’s t-test.
Figure 6.
Figure 6.. Vitronectin binding to integrin receptors is essential for barrier function
(A) Schematic illustrating binding of ligands containing RGD-motif with integrin receptors (B) Leakage of Sulfo-NHS-Biotin (tracer, green) from vessels (isolectin, magenta) in P10 VtnRGE mice. White boxes correspond to higher magnification images shown in (C). (C) Tracer hotspots (arrowheads) in retinas of VtnRGE mice. (D) Quantification of vessel permeability in wildtype and VtnRGE mice. n = 5 animals per genotype. Mean ± S.D.; ***p < 0.001; Student’s t-test. (E) Leakage of Sulfo-NHS-Biotin (green) in the cerebellum of P10 VtnRGE mice. White boxes correspond to higher magnification panels showing tracer confinement to vessels (ICAM2, magenta) in wildtype mice and tracer leakage in VtnRGE mice. (F) Quantification of vessel permeability in wildtype and VtnRGE mice. n = 4 animals per genotype. Mean ± S.D.; ***p < 0.001; Student’s t-test. (G, H) EM images of HRP halting at tight junctions (arrows) in both retinas (G) and cerebellum (H) of wildtype and VtnRGE mice. Luminal (L) and abluminal sides indicated by dashed yellow lines. (I, K) EM images of HRP-filled vesicles (arrowheads) in endothelial cells of retinas (I) and cerebellum (K) of wildtype and VtnRGE mice. (J, L) Quantification of tracer-filled vesicles in endothelial cells of retinas (J) and cerebellum (L). n = 4 animals per genotype, 15–20 vessels per animal. Mean ± S.D.; ***p < 0.001, **p < 0.01; Student’s t-test.
Figure 7.
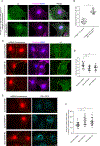
Figure 7.. Engagement of integrin α5 with vitronectin forms adhesion structures and actively inhibits endocytosis in primary brain endothelial cells.
(A, B) Representative images (A) and quantification (B) of α5 (green) containing adhesion structures in primary brain endothelial cells (phalloidin in magenta) grown on collagen IV, laminin and vitronectin-coated dishes. n = 25 cells per condition from 3 independent experiments. Mean ± S.D.; ***p < 0.001; Student’s t-test (C, D) Validation of two independent shRNAs (red) targeting endogenous α5 (green) in primary brain endothelial cells (phallodin in magenta) and quantification of adhesion structures (D) in scramble vs Itga5 shRNAs. n = 25 cells per condition from 3 independent experiments. Mean ± S.D.; ***p < 0.001, **p < 0.01; one-way ANOVA with Tukey’s post hoc test. (E) Endocytosis assay with membrane impermeable FM1-43FX (cyan) in primary brain endothelial cells transfected with shRNAs (red) targeting endogenous α5. (F) Quantitation of endocytic uptake of FM1-43FX. n = 25 cells per condition from 3 independent experiments. Mean ± S.D.; ***p < 0.001, **p < 0.01; one-way ANOVA with Tukey’s post hoc test.
Figure 8.
Figure 8.. Integrin α5 in endothelial cells is specifically required for blood-CNS barrier function
(A) In situ hybridization for Itga5 (green), Pecam1 (endothelial gene, red) and Pdgfrb (pericyte gene, magenta) in P7 brain tissue. (B) Scatter plot of Itga5 (blue) and Itgav (purple) transcript numbers in pericytes versus endothelial cells from RNAscope in situ hybridization as shown in (A). Each dot represents an individual pericyte-endothelial cell pair, n = 49 and 47 cell pairs respectively from 3 animals. (C) Depiction of tamoxifen injections in postnatal pups from P3-P5 and validation of tamoxifen-induced deletion of α5 (green) from vessels (isolectin, magenta) in P10 mice. (D) Sulfo-NHS-Biotin (tracer, green) leaks out of vessels (isolectin, magenta) in P10 Cdh5:CreER+; Itga5fl/fl mice. Tamoxifen administered P3-P5, see Figure S6. White boxes correspond to higher magnification images in (E). (E) Tracer hotspots (arrowheads) in mice lacking endothelial Itga5. (F) Quantification of vessel permeability in wildtype and Cdh5:CreER+; Itga5fl/fl mice. n = 5 animals per genotype. Mean ± S.D.; **p < 0.01; Student’s t-test. (G) Sulfo-NHS-Biotin (green) leakage in cerebellum of P10 Cdh5:CreER+; Itga5fl/fl mice. White boxes correspond to higher magnification images with tracer and vessels (ICAM2, magenta). (H) Quantification of vessel permeability in wildtype and Cdh5:CreER+; Itga5fl/fl mice. n = 5 animals per genotype. Mean ± S.D.; ***p < 0.001; Student’s t-test.

Comment in

References

    1. Andreone BJ, Chow BW, Tata A, Lacoste B, Ben-Zvi A, Bullock K, Deik AA, Ginty DD, Clish CB, and Gu C (2017). Blood-Brain Barrier Permeability Is Regulated by Lipid Transport-Dependent Suppression of Caveolae-Mediated Transcytosis. Neuron 94, 581–594.e5. - PMC - PubMed
    1. Armulik A, Genové G, Mäe M, Nisancioglu MH, Wallgard E, Niaudet C, He L, Norlin J, Lindblom P, Strittmatter K, et al. (2010). Pericytes regulate the blood-brain barrier. Nature 468, 557–561. - PubMed
    1. Bauer JS, Schreiner CL, Giancotti FG, Ruoslahti E, and Juliano RL (1992). Motility of fibronectin receptor-deficient cells on fibronectin and vitronectin: Collaborative interactions among integrins. J. Cell Biol. 116, 477–487. - PMC - PubMed
    1. Bell RD, Winkler EA, Sagare AP, Singh I, LaRue B, Deane R, and Zlokovic BV (2010). Pericytes Control Key Neurovascular Functions and Neuronal Phenotype in the Adult Brain and during Brain Aging. Neuron 68, 409–427. - PMC - PubMed
    1. Ben-Zvi A, Lacoste B, Kur E, Andreone BJ, Mayshar Y, Yan H, and Gu C (2014). Mfsd2a is critical for the formation and function of the blood-brain barrier. Nature 509, 507–511. - PMC - PubMed

Publication types

LinkOut - more resources