. 2022 Jun 16;29(6):1037-1045.e4.
doi: 10.1016/j.chembiol.2022.02.006. Epub 2022 Mar 15.

Rheb regulates nuclear mTORC1 activity independent of farnesylation

Affiliations

Rheb regulates nuclear mTORC1 activity independent of farnesylation

Yanghao Zhong et al. Cell Chem Biol. .

Abstract

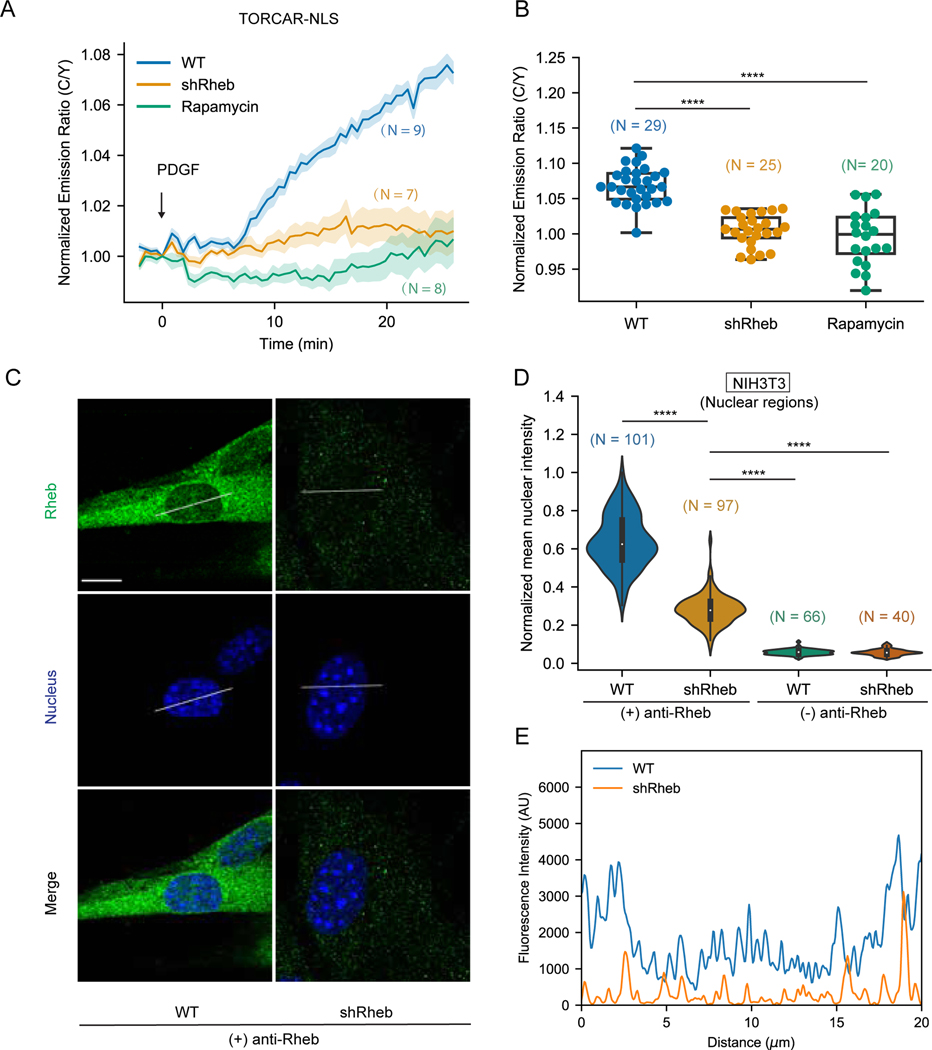
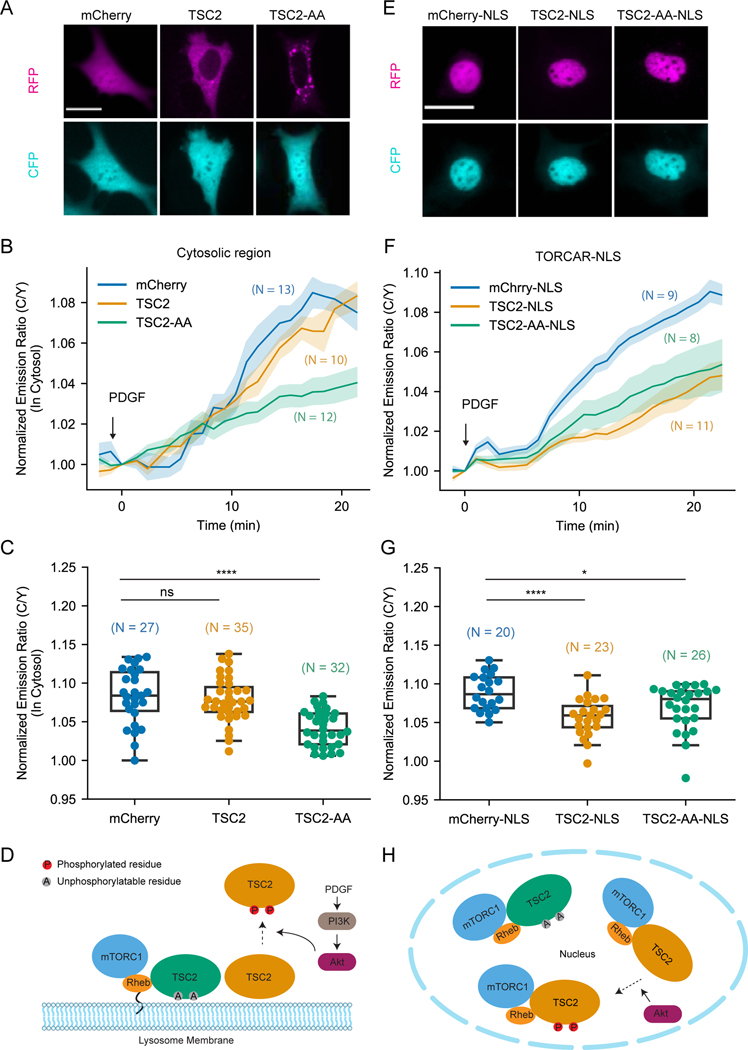
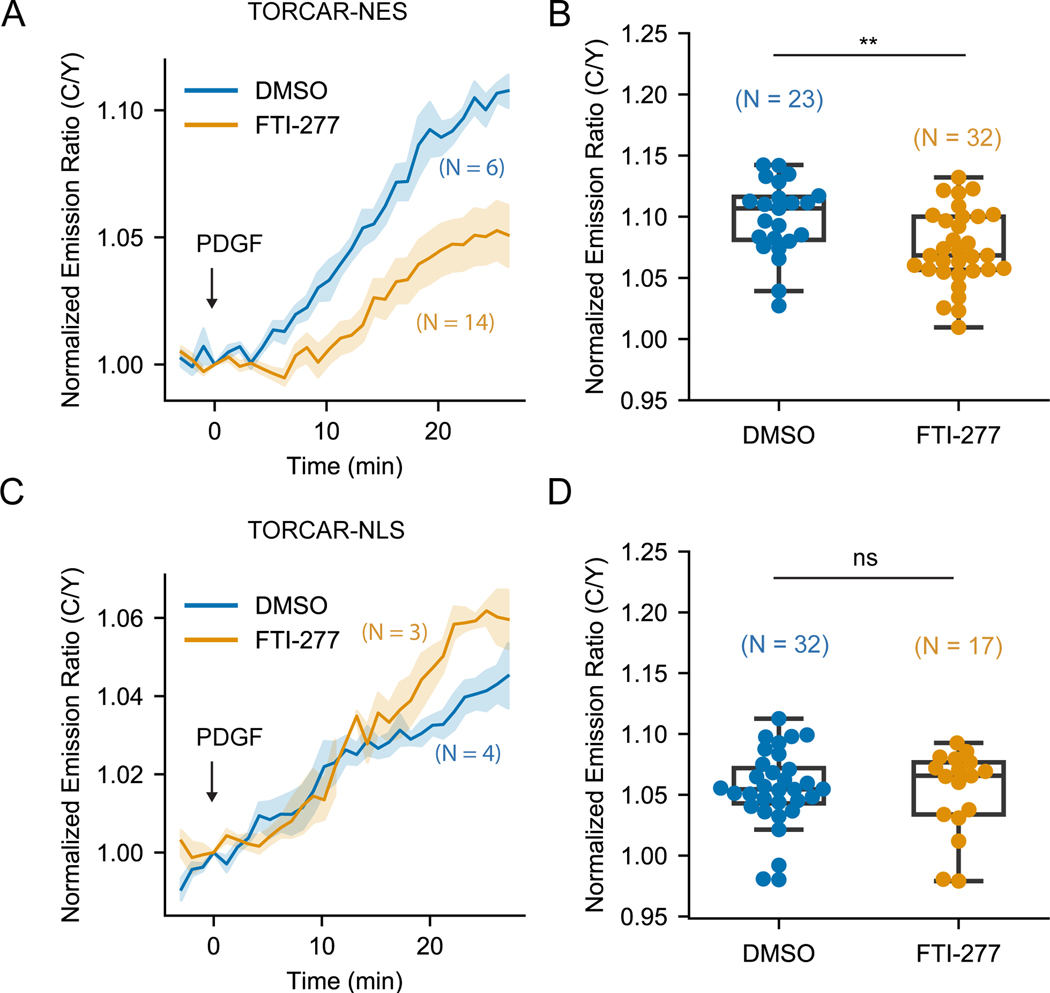
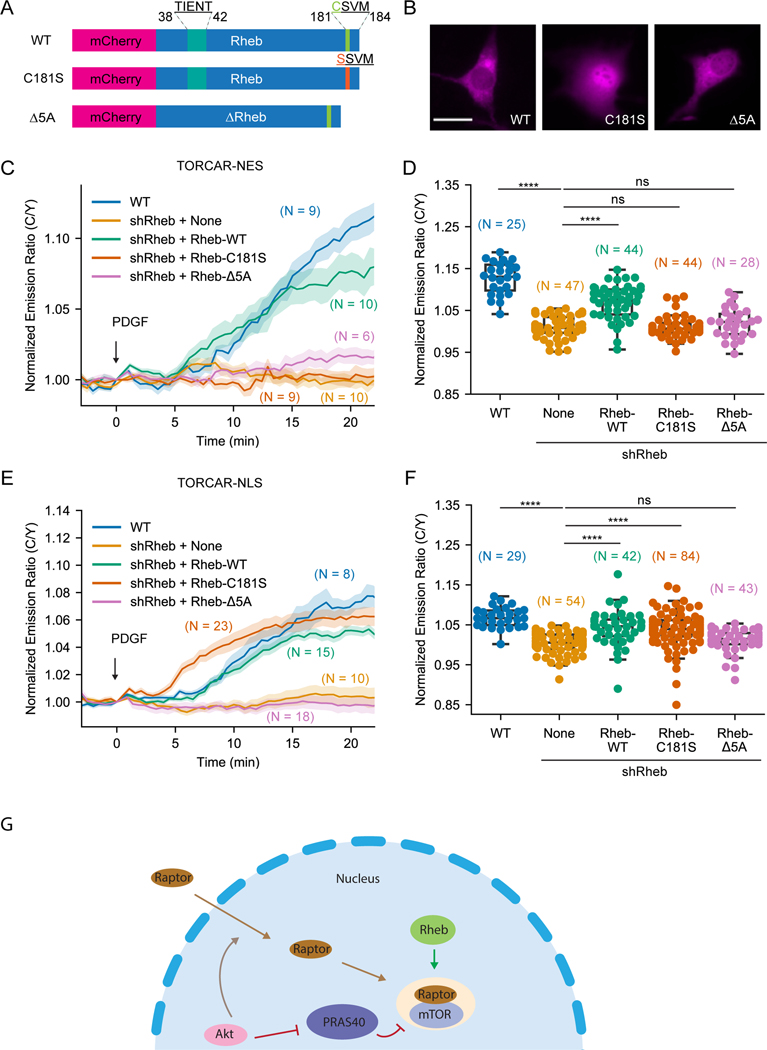
The small GTPase Ras homolog enriched in brain (Rheb) plays a critical role in activating the mechanistic target of rapamycin complex 1 (mTORC1), a signaling hub that regulates various cellular functions. We recently observed nuclear mTORC1 activity, raising an intriguing question as to how Rheb, which is known to be farnesylated and localized to intracellular membranes, regulates nuclear mTORC1. In this study, we found that active Rheb is present in the nucleus and required for nuclear mTORC1 activity. We showed that inhibition of farnesyltransferase reduced cytosolic, but not nuclear, mTORC1 activity. Furthermore, a farnesylation-deficient Rheb mutant, with preferential nuclear localization and specific lysosome tethering, enables nuclear and cytosolic mTORC1 activities, respectively. These data suggest that non-farnesylated Rheb is capable of interacting with and activating mTORC1, providing mechanistic insights into the molecular functioning of Rheb as well as regulation of the recently observed, active pool of nuclear mTORC1.

Keywords: Compartmentation; PTM; TSC; biosensor; lipid modification; mTOR; small GTPase.


Conflict of interest statement

Declaration of interests The authors declare no competing interests.

Figures

Figure 1.
Figure 1.. Rheb is present in the nucleus and required for nuclear mTORC1 activation.
(A-B) Representative averaged time course traces (A) and summary (B) of PDGF-induced maximum responses of TORCAR-NLS in double starved NIH3T3 cells. Blue, wild type cells (WT, N = 29); yellow, Rheb knockdown cells (shRheb, N = 25); green, wild type cells with rapamycin pretreatment (100 nM for 30 min) (Rapamycin, N = 20). N indicates the cell number quantified from 3 independent experiments. (C) Representative confocal immunofluorescence images of wild type (WT) NIH3T3 cells and Rheb knockdown (shRheb) cells from two independent experiments. Staining for Rheb is shown in green and nucleus is shown in blue. (D) Quantification of the nuclear signals in (C). Intensities were normalized to the maximum intensity. Control experiments were done by leaving out the primary antibody ((−) anti-Rheb). N indicates the number of cells quantified. Data are representative from 2 independent experiments. (E) Line scan shown in (C). A line was drawn across the nuclear region of the cell. Intensities along the line in the green channel were measured and shown as relative arbitrary units (AU). Shaded areas indicate standard error of the mean (SEM). Box plots show the upper and lower adjacent values, interquartile range and the median. Scale bar = 10 µm. See also Figure S1.
Figure 2.
Figure 2.. Growth factor induced nuclear mTORC1 activity is suppressed by overexpressing TSC2 in the nucleus.
(A) Representative fluorescence images from three independent experiments showing the localization of overexpressed constructs in NIH3T3 cells. Fluorescence of mCherry, mCherry-TSC2 and mCherry-TSC2-AA mutant are shown as “RFP”. “CFP” shows fluorescence of TORCAR. (B-C) Representative averaged time course traces (B) and summary (C) of PDGF-induced maximum responses of TORCAR in the cytosolic regions of double starved NIH3T3 cells. mCherry (blue, N = 27); mCherry-TSC2 (yellow, N = 35); mCherry-TSC2-AA (green, N = 32). (D) Model depicting lysosomal TSC2-dependent spatial regulation of mTORC1 activation. (E) Representative fluorescence images from three independent experiments showing the localization of overexpressed nuclearly targeted constructs in NIH3T3 cells. Fluorescence of mCherry-NLS, mCherry-TSC2-NLS and mCherry-TSC2-AA-NLS mutant are shown as “RFP”. “CFP” shows the fluorescence of TORCAR-NLS. (F-G) Representative averaged time course traces (F) and summary (G) of PDGF-induced maximum responses of TORCAR-NLS in double starved NIH3T3 cells. Co-expressed constructs: mCherry-NLS (blue, N = 20); mCherry-TSC2-NLS (yellow, N = 23); mCherry-TSC2-AA-NLS (green, N = 26). (H) Model depicting the inhibition of nuclear mTORC1 activity by overexpressed nuclear TSC2. N indicates the cell number quantified from at least 3 independent experiments. Shaded areas indicate standard error of the mean (SEM). Box plots show the upper and lower adjacent values, interquartile range and the median. Scale bar = 10 µm. See also Figure S2.
Figure 3.
Figure 3.. Farnesyltransferase inhibitor FTI-277 did not affect nuclear mTOR1 activity.
(A-B) Representative averaged time course traces (A) and summary (B) of PDGF-induced maximum responses of TORCAR-NES in double starved NIH3T3 cells treated with DMSO (blue, N = 23) or farnesyltransferase inhibitor FTI-277 at 5 µM overnight (yellow, N = 32). (C-D) Representative averaged time course traces (C) and summary (D) of PDGF-induced maximum responses of TORCAR-NLS in double starved NIH3T3 cells treated with DMSO (blue, N = 32) or farnesyltransferase inhibitor FTI-277 at 5 µM overnight (yellow, N = 17). N indicates the cell number quantified from at least 3 independent experiments. Shaded areas indicate standard error of the mean (SEM). Box plots show the upper and lower adjacent values, interquartile range and the median. See also Figure S3.
Figure 4.
Figure 4.. Farnesylation-deficient Rheb had different effects on rescuing subcellular mTORC1 activity.
(A) Schematics of different Rheb constructs tagged with mCherry. (B) Representative images of overexpressed mCherry-Rheb constructs in NIH3T3 cells from 3 independent experiments. (C-D) Representative averaged time course traces (C) and summary (D) of PDGF-induced maximum responses of TORCAR-NES in double starved NIH3T3 cells. Blue, wild type cells (WT, N = 25); yellow, Rheb knockdown cells (shRheb + None, N = 47 cells); green, Rheb knockdown cells transfected with wild type mCherry-Rheb-WT (shRheb + Rheb-WT, N = 44); orange, Rheb knockdown cells transfected with mCherry-Rheb-C181S (shRheb + Rheb-C181S, N = 44); pink, Rheb knockdown cells transfected with mCherry-Rheb-Δ5A (shRheb + Rheb-Δ5A, N = 28 cells). (E-F) Representative averaged time course traces (E) and summary (F) of PDGF-induced maximum responses of TORCAR-NLS in double starved NIH3T3 cells. Blue, wild type cells (WT, N = 29); yellow, Rheb knockdown cells (shRheb + None, N = 54); green, Rheb knockdown cells transfected with wild type mCherry-Rheb-WT (shRheb + Rheb-WT, N = 42); orange, Rheb knockdown cells transfected with mCherry-Rheb-C181S (shRheb + Rheb-C181S, N = 84); pink, Rheb knockdown cells transfected with mCherry-Rheb-Δ5A (shRheb + Rheb-Δ5A, N = 43). (G) Model showing that active Rheb in the nucleus is critical for activating nuclear mTORC1, in addition to the previously reported Akt-mediated nuclear translocation of Raptor and phosphorylation of PRAS40. N indicates the cell number quantified from at least 3 independent experiments. Shaded areas indicate standard error of the mean (SEM). Box plots show the upper and lower adjacent values, interquartile range and the median. Scale bar = 10 µm. See also Figure S3.

Similar articles

Cited by

References

    1. Angarola B, Ferguson SM, 2019. Weak membrane interactions allow Rheb to activate mTORC1 signaling without major lysosome enrichment. Mol. Biol. Cell 30, 2750–2760. doi:10.1091/mbc.E19-03-0146 - DOI - PMC - PubMed
    1. Angarola B, Ferguson SM, 2020. Coordination of Rheb lysosomal membrane interactions with mTORC1 activation. F1000Res. 9. doi:10.12688/f1000research.22367.1 - DOI - PMC - PubMed
    1. Basso AD, Mirza A, Liu G, Long BJ, Bishop WR, Kirschmeier P, 2005. The farnesyl transferase inhibitor (FTI) SCH66336 (lonafarnib) inhibits Rheb farnesylation and mTOR signaling. Role in FTI enhancement of taxane and tamoxifen anti-tumor activity. J. Biol. Chem. 280, 31101–31108. doi:10.1074/jbc.M503763200 - DOI - PubMed
    1. Bernardi R, Guernah I, Jin D, Grisendi S, Alimonti A, Teruya-Feldstein J, Cordon-Cardo C, Simon MC, Rafii S, Pandolfi PP, 2006. PML inhibits HIF-1alpha translation and neoangiogenesis through repression of mTOR. Nature 442, 779–785. doi:10.1038/nature05029 - DOI - PubMed
    1. Cai S-L, Tee AR, Short JD, Bergeron JM, Kim J, Shen J, Guo R, Johnson CL, Kiguchi K, Walker CL, 2006. Activity of TSC2 is inhibited by AKT-mediated phosphorylation and membrane partitioning. J. Cell Biol. 173, 279–289. doi:10.1083/jcb.200507119 - DOI - PMC - PubMed

Publication types

MeSH terms

Substances