. 2022 Sep 19;130(3):393-408.
doi: 10.1093/aob/mcac035.

Non-rolling flag leaves use an effective mechanism to reduce water loss and light-induced damage under drought stress

Affiliations

Non-rolling flag leaves use an effective mechanism to reduce water loss and light-induced damage under drought stress

Tomasz Hura et al. Ann Bot. .

Abstract

Background and aims: The study reports on four different types of flag leaf rolling under soil drought in relation to the level of cell wall-bound phenolics. The flag leaf colonization by aphids, as a possible bioindicator of the accumulation of cell wall-bound phenolics, was also estimated.

Methods: The proteins of the photosynthetic apparatus that form its core and are crucial for maintaining its stability (D1/PsbA protein), limit destructive effects of light (PsbS, a protein binding carotenoids in the antennas) and participate in efficient electron transport between photosystems II (PSII) and PSI (Rieske iron-sulfur protein of the cytochrome b6f complex) were evaluated in two types of flag leaf rolling. Additionally, biochemical and physiological reactions to drought stress in rolling and non-rolling flag leaves were compared.

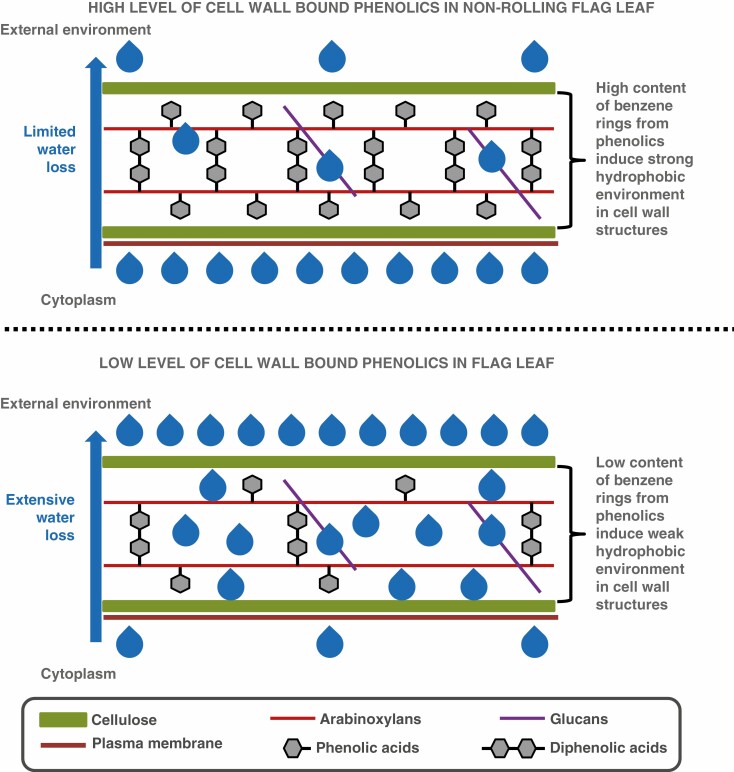
Key results: The study identified four types of genome-related types of flag leaf rolling. The biochemical basis for these differences was a different number of phenolic molecules incorporated into polycarbohydrate structures of the cell wall. In an extreme case of non-rolling dehydrated flag leaves, they were found to accumulate high amounts of cell wall-bound phenolics that limited cell water loss and protected the photosynthetic apparatus against excessive light. PSII was also additionally protected against excess light by the accumulation of photosynthetic apparatus proteins that ensured stable and efficient transport of excitation energy beyond PSII and its dissipation as far-red fluorescence and heat. Our analysis revealed a new type of flag leaf rolling brought about by an interaction between wheat and rye genomes, and resulting in biochemical specialization of flexible, rolling and rigid, non-rolling parts of the flag leaf. The study confirmed limited aphid colonization of the flag leaves with enhanced content of cell wall-bound phenolics.

Conclusions: Non-rolling leaves developed effective adaptation mechanisms to reduce both water loss and photoinhibitory damage to the photosynthetic apparatus under drought stress.

Keywords: Blue and red fluorescence; cell wall phenolics; chlorophyll fluorescence; flag leaf rolling; hydrogen peroxide; photosynthetic apparatus proteins; triticale.


Figures

Fig. 1.
Fig. 1.
Types of flag leaf rolling identified in DH triticale lines on the 21st day of water stress.
Fig. 2.
Fig. 2.
Water potential (Ψ W), hydrogen peroxide level (H2O2) and intensity of red (FI690) and far-red (FI740) fluorescence emission on the 21st day of water stress in the flag leaves of the parental DH lines ‘Magnat’ and ‘Hewo’. Treatments: C, control; WS, water stress. Types of flag leaf rolling: NRL, non-rolling leaves; T3LR, type 3 of leaf rolling. Means ± s.e. (n = 7 for Ψ W, n = 10 for H2O2, FI690 and FI740). Means indicated with the same letters are not significantly different within measured parameters (Duncan’s multiple range test at P = 0.05).
Fig. 3.
Fig. 3.
(A) The number of phenolic compounds incorporated into the cell wall structures on the 21st day of water stress for the flag leaves of parental DH lines ‘Magnat’ and ‘Hewo’. Types of flag leaf rolling: NRL, non-rolling leaves; T3LR, type 3 of leaf rolling. Means ± s.e. (n = 9). Means indicated with the same letters are not significantly different (Duncan’s multiple range test at P = 0.05). (B) Calculations of differences in the amount of incorporated phenolic molecules for control and stress treatments and for ‘Magnat’ and ‘Hewo’ DH lines subjected to water stress.
Fig. 4.
Fig. 4.
(A) Water loss (%) in the flag leaves of the ‘Magnat’ DH line 24 h after rehydration following 7, 14 and 21 d of water stress. The water loss rate for the ‘Hewo’ DH line showing a low content of cell wall-bound phenolics was analysed only for the variant representing leaves 24 h after rehydration following 21 d of water stress. Treatments: C, control; WS, water stress. Mean values ± s.e. (n = 10). (B) Correlation between leaf water loss rate (% h–1) and the number of phenolic molecules incorporated into the cell wall structures of flag leaves of the ‘Magnat’ DH line 24 h after rehydration following 7, 14 and 21 d of water stress. The line denotes linear adjustment at a probability level of P = 0.05.
Fig. 5.
Fig. 5.
(A) Graphical representation of disadvantages of non-rolling leaves. Western blot analysis showing accumulation of Rieske iron–sulfur protein (PetC) of the cyt b6f complex (B), the carotenoid-binding protein in PSII (PsbS) (C) and D1 protein (PsbA) forming the core of PSII (D) on the 21st day of water stress in the flag leaves of the ‘Magnat’ parental line. The analysis was repeated three times (1–3). CBB, the share of equal amounts of total protein stained with Coomassie Brilliant Blue as a loading control in an SDS–PAGE stacking gel. The band density within each protein was normalized to the densest band that was assumed as 100 %. Asterisks represent differences significant at P = 0.05, Student’s t-test. Changes in the accumulation of individual proteins are presented together with changes in respective values of chlorophyll fluorescence parameters: ETR, electron transport rate; Ф PSII, PSII quantum efficiency; and qNP, non-photochemical quenching coefficient. Mean values ± s.e. (n = 10). Asterisks represent differences significant at P = 0.05, Student’s t-test.
Fig. 6.
Fig. 6.
(A) Graphical representation of benefits of leaf rolling. Western blot analysis showing accumulation of Rieske iron–sulfur protein (PetC) of the cyt b6f complex (B), the carotenoid-binding protein in PSII (PsbS) (C) and D1 protein (PsbA) forming the core of PSII (D) on the 21st day of water stress in the flag leaves of the ‘Hewo’ parental line. The analysis was repeated three times (1–3). CBB, the share of equal amounts of total protein stained with Coomassie Brilliant Blue as a loading control in an SDS–PAGE stacking gel. The band density within each protein was normalized to the densest band that was assumed as 100 %. Asterisks represent differences significant at P = 0.05, Student’s t-test. Changes in the accumulation of individual proteins are presented together with changes in respective values of chlorophyll fluorescence parameters: ETR, electron transport rate; Ф PSII, PSII quantum efficiency; and qNP, non-photochemical quenching coefficient. Mean values ± s.e. (n = 10). Asterisks represent differences significant at P = 0.05, Student’s t-test.
Fig. 7.
Fig. 7.
Correlation between water potential (Ψ W), osmotic potential (Ψ O), stomatal conductance (gs), leaf water loss, soluble phenolic (SPh) content, soluble carbohydrate (SC) content, H2O2 content, emission intensity of blue (FI440–450)/red (FI690)/far-red (FI740) fluorescence, flag leaf dry weight, non-photochemical quenching coefficient (qNP), quantum yield of electron transport from QA to the PSI end electron acceptors (φRo), chlorophyll (Chl a + b) content, carotenoid (Crt) content and the number of phenolic molecules incorporated in the cell wall structures of the flag leaves representing four different types of rolling (NRL, T1LR, T2LR and T3LR) on the 21st day of water stress in 92 DH lines of triticale. For all 92 DH lines, measurements for each parameter were performed in triplicate (92 × 3 = 276 measurement points). The lines denote linear adjustment at a probability level P = 0.05.
Fig. 8.
Fig. 8.
Content of soluble carbohydrates (SC), soluble phenolics (SPh), number of phenolic compounds incorporated into the cell wall structures, content of RbcL (Rubisco large subunit) and SPS (sucrose phosphate synthase), and activity of PAL and TAL on the 21st day of water stress in the samples collected from non-rolling (1) and rolling (2) parts of flag leaves (the rolled parts were separated from the unrolled parts within a single leaf with a scalpel). CBB, the share of equal amounts of total protein stained with Coomassie Brilliant Blue as a loading control in an SDS–PAGE stacking gel. The band density within each protein was normalized to the densest band that was assumed as 100 %. Mean values ± s.e (n = 15 for SCs, SPhs, number of phenolic molecules in the cell wall; n = 3 for RbcL and SPS, n = 6 for PAL and TAL). Asterisks represent differences significant at P = 0.05, Student’s t-test.
Fig. 9.
Fig. 9.
Colonization of the flag leaves by aphids on the fifth day of rehydration after soil drought that was also the fourth day of contact between the donor plants (DP) and DH lines that experienced drought and exhibited four types of flag leaf rolling: NRL, T1LR, T2LR and T3LR. Means ± s.e. (n = 24). Means indicated with the same letters show no significant differences within measured parameters (Duncan’s multiple range test at P = 0.05).
Fig. 10.
Fig. 10.
Graphical representation of the function of phenolic compounds built into the cell wall structures in limiting water loss during soil drought.
Fig. 11.
Fig. 11.
Graphical representation of the role of the wheat (AABB) and/or triticale (RR) genome in controlling the rolling of dehydrated flag leaves in triticale.

References

    1. Agati G, Cerovic ZG, Moya I. 2000. The effect of decreasing temperature up to chilling values on the in vivo F685/F735 chlorophyll fluorescence ratio in Phaseolus vulgaris an Pisum sativum: the role of the photosystem I contribution to the 735 nm fluorescence band. Photochemistry and Photobiology 72: 75–84. - PubMed
    1. Arnold T, Appel H, Patel V, Stocum E, Kavalier A, Schultz J. 2004. Carbohydrate translocation determines the phenolic content of Populus foliage: a test of the sink–source model of plant defense. New Phytologist 164: 157–164. - PubMed
    1. Ashwell G. 1957. Colorimetric analysis of sugars. Methods in Enzymology 3: 73–105.
    1. Baker NR. 1991. A possible role for photosystem II in environmental perturbations of photosynthesis. Physiologia Plantarum 81: 563–570.
    1. Baret F, Madec S, Irfan K, et al. . 2018. Leaf-rolling in maize crops: from leaf scoring to canopy-level measurements for phenotyping. Journal of Experimental Botany 69: 2705–2716. - PMC - PubMed

Publication types