. 2022 Feb 28:16:846584.
doi: 10.3389/fnins.2022.846584. eCollection 2022.

Rapamycin Improved Retinal Function and Morphology in a Mouse Model of Retinal Degeneration

Affiliations

Rapamycin Improved Retinal Function and Morphology in a Mouse Model of Retinal Degeneration

Meng Zhao et al. Front Neurosci. .

Abstract

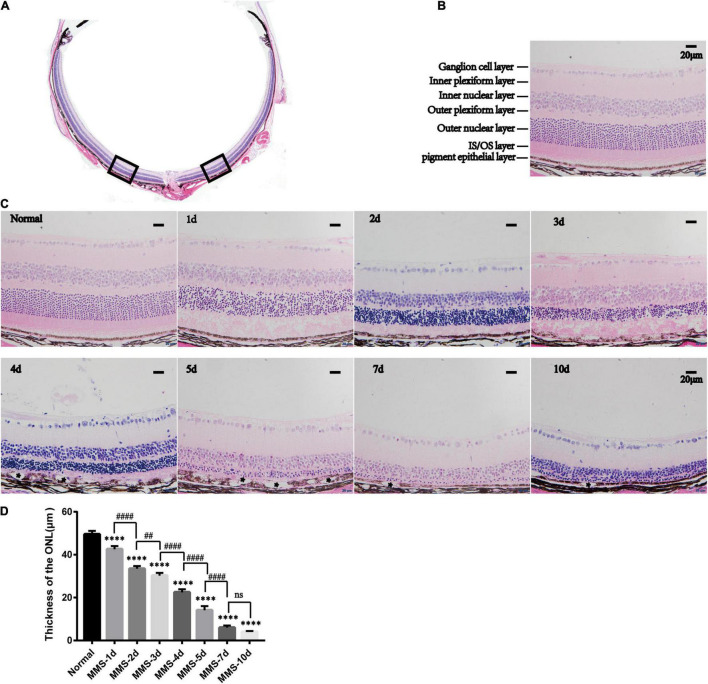
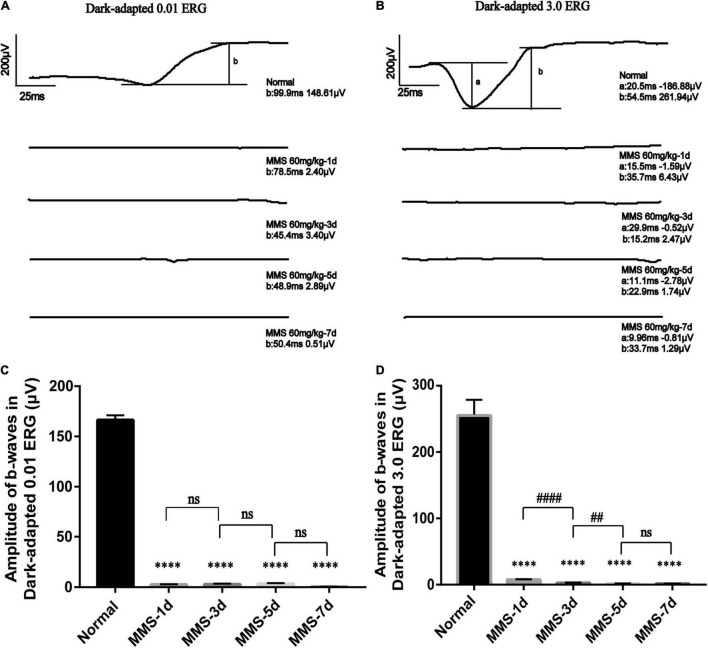
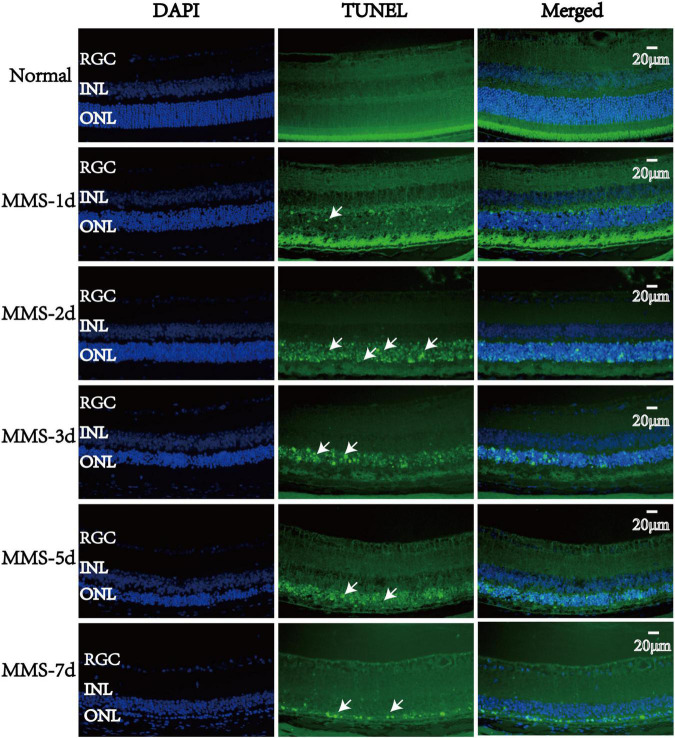
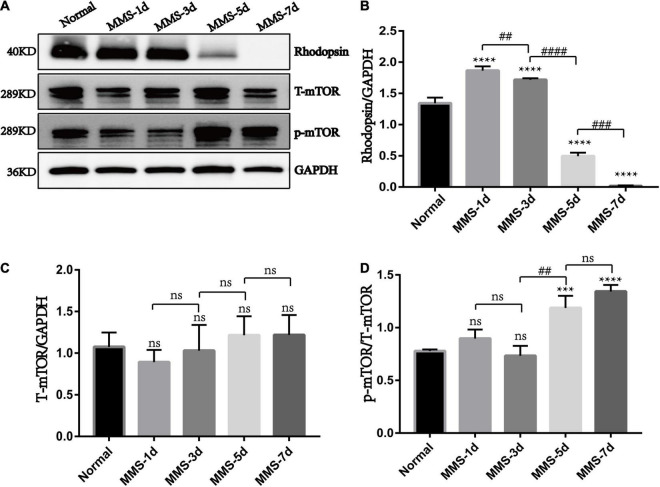
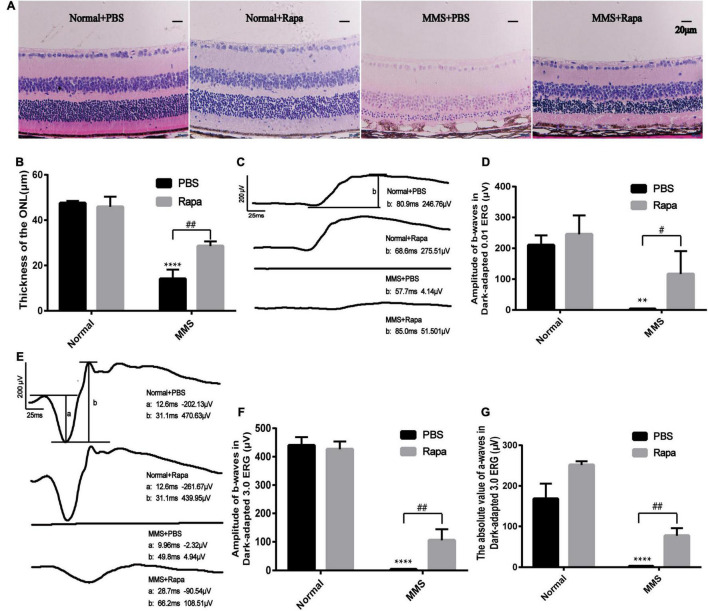
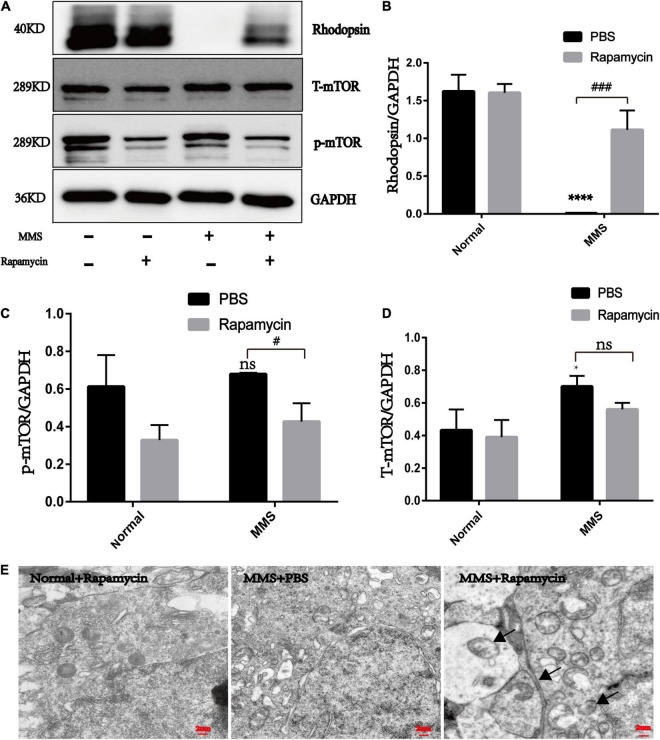
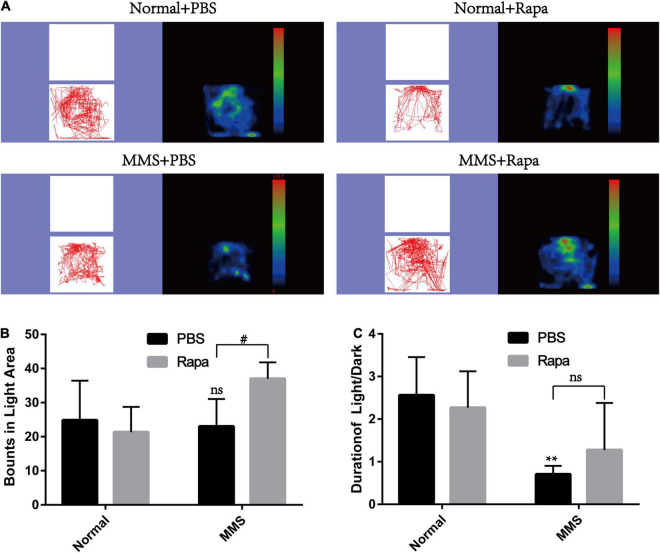
The retina is an important visual organ, which is responsible for receiving light signals and transmitting them to the optic nerve center step by step. The retina contains a variety of cells, among which photoreceptor cells receive light signals and convert them into nerve signals, and are mainly responsible for light and dark vision. Retinal degeneration is mainly the degeneration of photoreceptor cells, and retinitis pigmentosa (RP) is characterized by rod degeneration followed by cone degeneration. So far, there is still a lack of effective drugs to treat RP. Here, we established a stable RP model by tail vein injection of methyl methanesulfonate to study the mechanism of retinal photoreceptor degeneration. Mechanistic target of rapamycin (mTOR) is located in the central pathway of growth and energy metabolism and changes in a variety of diseases in response to pathological changes. We found that the mTOR was activated in this model. Therefore, the inhibitor of mTOR, rapamycin was used to suppress the expression of mTOR and interfere with photoreceptor degeneration. Electroretinogram assay showed that the function of mice retina was improved. Hematoxylin and eosin staining results displayed that retinal photoreceptor thickness and morphology were improved. Also, the autophagy in rapamycin group was activated, which revealed that rapamycin may protect the retinal photoreceptor by inhibiting mTOR and then activating autophagy.

Keywords: MTOR; autophagy; photoreceptor; rapamycin; retinal degeneration.


Conflict of interest statement

The authors declare that the research was conducted in the absence of any commercial or financial relationships that could be construed as a potential conflict of interest.

Figures

FIGURE 1
FIGURE 1
The retinal morphology changes with time after tail vein injection of methyl methanesulfonate (MMS). (A) The Panorama of retina. (B) The main layers of retina. (C) The normal retina without MMS administration and the retina 1, 2, 3, 4, 5, and 7 days after MMS administration. The asterisk represents the posterior vacuole structure in RPE cells. (D) The histogram of the thickness of outer nucleus layer (ONL). One way ANOVA multiple comparisons was analyzed, ∗∗∗∗P < 0.0001 for differences compared with controls; ##P < 0.01, ####P < 0.0001 for differences compared with previous time point group, n = 3.
FIGURE 2
FIGURE 2
The retinal function deteriorates with time after tail vein injection of MMS. (A) The b-wave of Dark-adapted 0.01 electroretinogram (ERG) of normal retina without MMS treatment and retina after MMS administration (1, 3, 5, and 7 days). (B) The b-wave of Dark-adapted 3.0 ERG of normal retina without MMS treatment and retina after MMS administration (1, 3, 5, and 7 days). (C) The histogram of the amplitude of b-wave of Dark-adapted 0.01 ERG. One way ANOVA multiple comparisons was analyzed, ∗∗∗∗P < 0.0001 for differences compared with controls, n = 3. (D) The histogram of the amplitude of b-wave of Dark-adapted 3.0 ERG. One way ANOVA multiple comparisons was analyzed, ∗∗∗∗P < 0.0001 for differences compared with controls; ####P < 0.0001, ##P < 0.01 for differences compared with previous time point group, n = 3.
FIGURE 3
FIGURE 3
Behavioral changes of mice in open field with time after tail vein injection of MMS. (A) Trajectories and density maps of mice without MMS treatment and 1, 2, 3, 5, and 7 days after MMS administration in open field. (B) The histogram of the percentage duration of mice in the central area of the open field. One way ANOVA multiple comparisons was analyzed, ****P < 0.0001 for differences compared with controls; ###P < 0.001 for differences compared with previous time point group. (C) The histogram of the duration of mice in the central area of the open field. One way ANOVA multiple comparisons was analyzed, ****P < 0.0001 for differences compared with controls; ###P < 0.001 for differences compared with previous time point group. (D) The histogram of the bounts of mice in the central area of the open field. One way ANOVA multiple comparisons was analyzed, ****P < 0.0001 for differences compared with control, ***P < 0.001 for differences compared with controls. (E) The histogram of the total distance of mice in the open field. One way ANOVA multiple comparisons was analyzed, *P < 0.05 for differences compared with controls, n = 6.
FIGURE 4
FIGURE 4
The apoptosis changes of retinal photoreceptors with time after tail vein injection of MMS. The nucleus was labeled with blue fluorescence (DAPI), and the reactive apoptotic cells were labeled with green fluorescence (TUNEL). White arrows indicated apoptotic cells.
FIGURE 5
FIGURE 5
The expression of rhodopsin, mTOR and p-mTOR after tail vein injection of MMS. (A) Representative WB images of rhodopsin, Total mTOR (T-mTOR) and p-mTOR. (B) The histogram of the immune blotting gray value of rhodopsin/GAPDH. One way ANOVA was analyzed, ****P < 0.0001 for difference between Normal group and MMS injection group, ##P < 0.01 for difference between MMS-1d and MMS-3d, ####P < 0.0001 for difference between MMS-3d and MMS-5d, ###P < 0.001 for difference between MMS-5d and MMS-7d, n = 3. (C) The histogram of the immune blotting gray value of T-mTOR/GAPDH. One way ANOVA was analyzed, n = 3. (D) The histogram of the immune blotting gray value of p-mTOR/T-mTOR. One way ANOVA was analyzed, ***P < 0.001 for difference between Normal and MMS-5d, ****P < 0.0001 for difference between Normal and MMS-7d, ##P < 0.01 for difference between MMS-3d and MMS-5d, n = 3.
FIGURE 6
FIGURE 6
Protective effects of rapamycin on retina at 5 days after tail vein injection of MMS. (A) HE staining of the retina in four groups: Normal + PBS, Normal + Rapa, MMS + PBS, MMS + Rapa. (B) The histogram of the thickness of the ONL. Two way ANOVA was analyzed, **P < 0.01 for difference between the MMS + PBS and the Normal + PBS, #P < 0.05 for difference between the MMS + Rapa and the MMS + PBS, n = 3/group. (C) The representative b-wave of dark-adapted 0.01 ERG of the mice in four groups: Normal + PBS, Normal + Rapa, MMS + PBS, and MMS + Rapa. (D) The histogram of the b-wave of dark-adapted 0.01 ERG. Two way ANOVA was analyzed, ****P < 0.0001 for difference between the MMS + PBS and the Normal + PBS, ##P < 0.01 for difference between the MMS + Rapa and the MMS + PBS, n = 3/group. (E) The representative b-wave of dark-adapted 3.0 ERG of the mice in four groups: Normal + PBS, Normal + Rapa, MMS + PBS, and MMS + Rapa. (F) The histogram of the b-wave of dark-adapted 3.0 ERG. Two way ANOVA was analyzed, ****P < 0.0001 for difference between the MMS + PBS and the Normal + PBS, ##P < 0.01 for difference between the MMS + Rapa and the MMS + PBS, n = 3/group. (G) The histogram of the absolute value of a-wave of dark-adapted 3.0 ERG. Two way ANOVA was analyzed, ****P < 0.0001 for difference between the MMS + PBS and the Normal + PBS, ##P < 0.01 for difference between the MMS + Rapa and the MMS + PBS, n = 3/group.
FIGURE 7
FIGURE 7
The effect of rapamycin on the expression of rhodopsin, mTOR and p-mTOR. (A) Representative WB images of rhodopsin, mTOR and p-mTOR. (B) The histogram of the immune blotting gray value of rhodopsin/GAPDH. One way ANOVA was analyzed, ****P < 0.0001 for the difference between the MMS + PBS and the Normal + PBS, ###P < 0.001 for the difference between the MMS + PBS and the MMS + Rapa, n = 3. (C) The histogram of the immune blotting gray value of p-mTOR/GAPDH. One way ANOVA was analyzed, #P < 0.05 for the difference between the MMS + PBS and the MMS + Rapa, n = 3. (D) The histogram of the immune blotting gray value of T-mTOR/GAPDH. One way ANOVA was analyzed, *P < 0.05 for the difference between the MMS + PBS and the Normal + PBS, n = 3. (E) Representative TEM images of retinal photoreceptor in the Normal + Rapa, the MMS + PBS and the MMS + Rapa. Black arrows represent autophagosome.
FIGURE 8
FIGURE 8
Effect of rapamycin on the behavioral changes of mice in open field at 5 days after tail vein injection of MMS. (A) Trajectories and density maps of mice in four groups: Normal + PBS, Normal + Rapa, MMS + PBS, MMS + Rapa. (B) The histogram of the total distance of the mice. Two way ANOVA was analyzed, ****P < 0.0001 for difference between MMS + PBS and Normal + PBS, ####P < 0.0001 for difference between MMS + Rapa and MMS + PBS, n = 6. (C) The histogram of the percentage of center duration of mice. Two way ANOVA was analyzed, ****P < 0.0001 for difference between MMS + PBS and Normal + PBS, ##P < 0.01 for difference between MMS + Rapa and MMS + PBS, n = 6/group.
FIGURE 9
FIGURE 9
Effect of rapamycin on the behavioral changes of mice in Light/Dark transition at 5 days after tail vein injection of MMS. (A) Trajectories and density maps of mice in four groups: Normal + PBS, Normal + Rapa, MMS + PBS, MMS + Rapa. (B) The histogram of the number of times to light area of the mice. Two way ANOVA was analyzed, #P < 0.05 for difference between MMS + Rapa and MMS + PBS, n = 6. (C) The histogram of the percentage of center duration of mice. Two way ANOVA was analyzed, **P < 0.01 for difference between MMS + Rapa and MMS + PBS, n = 6.

Similar articles

Cited by

References

    1. Alers S., Loffler A. S., Wesselborg S., Stork B. (2012). Role of AMPK-mTOR-Ulk1/2 in the regulation of autophagy: cross talk, shortcuts, and feedbacks. Mol. Cell Biol. 32 2–11. - PMC - PubMed
    1. Allocca M., Corrigan J. J., Mazumder A., Fake K. R., Samson L. D. (2019). Inflammation, necrosis, and the kinase RIP3 are key mediators of AAG-dependent alkylation-induced retinal degeneration. Sci. Signal. 12:eaau9216. - PMC - PubMed
    1. Brown E. J., Beal P. A., Keith C. T., Chen J., Shin T. B., Schreiber S. L. (1995). Control of p70 s6 kinase by kinase activity of FRAP in vivo. Nature 377 441–446. - PubMed
    1. Chang B., Hawes N. L., Hurd R. E., Davisson M. T., Nusinowitz S., Heckenlively J. R. (2002). Retinal degeneration mutants in the mouse. Vis. Res. 42 517–525. - PubMed
    1. Chen Y. Y., Liu S. L., Hu D. P., Xing Y. Q., Shen Y. (2014). N -methyl- N -nitrosourea-induced retinal degeneration in mice. Exp. Eye Res. 121 102–113. 10.1016/j.exer.2013.12.019 - DOI - PubMed