Review
. 2022 Feb 25:4:812863.
doi: 10.3389/ftox.2022.812863. eCollection 2022.

Roadbumps at the Crossroads of Integrating Behavioral and In Vitro Approaches for Neurotoxicity Assessment

Affiliations
Review

Roadbumps at the Crossroads of Integrating Behavioral and In Vitro Approaches for Neurotoxicity Assessment

G Jean Harry et al. Front Toxicol. .

Abstract

With the appreciation that behavior represents the integration and complexity of the nervous system, neurobehavioral phenotyping and assessment has seen a renaissance over the last couple of decades, resulting in a robust database on rodent performance within various testing paradigms, possible associations with human disorders, and therapeutic interventions. The interchange of data across behavior and other test modalities and multiple model systems has advanced our understanding of fundamental biology and mechanisms associated with normal functions and alterations in the nervous system. While there is a demonstrated value and power of neurobehavioral assessments for examining alterations due to genetic manipulations, maternal factors, early development environment, the applied use of behavior to assess environmental neurotoxicity continues to come under question as to whether behavior represents a sensitive endpoint for assessment. Why is rodent behavior a sensitive tool to the neuroscientist and yet, not when used in pre-clinical or chemical neurotoxicity studies? Applying new paradigms and evidence on the biological basis of behavior to neurobehavioral testing requires expertise and refinement of how such experiments are conducted to minimize variability and maximize information. This review presents relevant issues of methods used to conduct such test, sources of variability, experimental design, data analysis, interpretation, and reporting. It presents beneficial and critical limitations as they translate to the in vivo environment and considers the need to integrate across disciplines for the best value. It proposes that a refinement of behavioral assessments and understanding of subtle pronounced differences will facilitate the integration of data obtained across multiple approaches and to address issues of translation.

Keywords: behavioral phenotype; behavioral toxicity; developmental neurotoxicity; in vitro model neurotoxicity; mechanistic neurotoxicity; neurobehavioral screening; neurotoxicity screening; new approach methodologies.


Conflict of interest statement

Authors SM and MB were employed by company Social & Scientific Systems, Inc. The remaining authors declare that the research was conducted in the absence of any commercial or financial relationships that could be construed as a potential conflict of interest.

Figures

FIGURE 1
FIGURE 1
Schematic representation of possible cascade of neurotoxic effects. The schematic represents a cascade of neurotoxic events that can occur following exposure to a chemical or physical agent. These events form the foundation of the definition of in vivo neurotoxicity “an adverse change in the structure or function of the central nervous system and/or peripheral nervous system”. They address many of the points surrounding the concept and definition of “adverse” in that they reflect the multitude of cellular and molecular changes that can occur to alter the function and susceptibility of the nervous system. Effects can occur by direct chemical exposure and more indirectly by alterations in the peripheral and autonomic nervous systems, in the periphery (i.e., hormonal, vascular, microbiome, etc.), in the specialized protective (e.g., blood-brain-barrier) and drainage (cerebral spinal fluid, neurolyphatic) systems. Additionally, the read-out of these effects can manifest differently. Three scenarios are proposed. 1) the insult is relatively short-term and there is recovery from a transient perturbation with no long-term effects. 2) the insult is recoverable but there are latent effects that manifest later in life. The transient nature can be due to an active process to return the system to homeostasis through adaptation mechanisms. While there are no apparent long-term effects, the “adapted” system may not necessarily reflect a return to normal. This is reflected in the second outcome the exposure-related effects may manifest later in life. 3) There is non-recoverable damage that can range in severity from an alteration in the neural circuitry and signaling capability to cell death. While evidence of neuropathology is clearly indicative of a neurotoxic outcome, the absence of neuropathology does not indicate an absence of neurotoxicity.
FIGURE 2
FIGURE 2
Open field motor activity. Representative data set of activity across an entire session (45 min) and the distribution pattern over 5 min epochs for ambulatory activity and rearing in 75 days old male (n = 20). Data was collected using a commercial device (42 × 42 cm) with photocell detectors (0.32 cm diameter) spaced 5 cm from floor and 1.27 cm linearly apart around the chamber. Horizontal activity photocells were set at 1 inch from arena floor and rearing photocells empirically determined and set at 4 inches. Individual animal time series were examined for extremely high or low performing animals. To meet the normality and homogeneity of variance assumptions of parametric tests. Activity measures over epochs were analyzed using a repeated measured analysis of variance (RM ANOVA) main effects of time (epochs), group, and the interaction between factors with an autocorrelated [AR(1)] error structure reflecting correlation between consecutive epochs. The Total Session Activity data suggests that Groups B and C were less active than Group A. Examination of the components driving Total Activity (Ambulation and Rearing) one gains a better view of what is driving the total session activity differences. In both Group A and B, while Group B is lower the overall pattern is similar and show acclimation. In Group C however, there is a suggestion that the animal initially respond differently to the novel environment and that exploratory activity may be delayed and within the time frame acclimation was not evident but suggested.
FIGURE 3
FIGURE 3
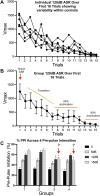
Auditory startle response and prepulse startle inhibition. Representative data for (A,B) auditory startle response (ASR) and (C) prepulse startle inhibition (PPI) of 90-days old male rats. The ASR is used to assess the integrity of a sensory-evoked motor reflex response and the habituation of response to the startle stimulus. (A) represent individual rat ASR (Vmax) to 120 dB across the first 16 trials showing data for individual responses and (B) represents this data as a group response. Note that the first ASR trial resents the naive response and often considered the accurate measure of a startle response. The first 10 trials represent a transition of the response, followed by a lower response level plateau and a subsequent full acclimation to the stimuli. The measured startle response is typically log-normally distributed across pulse types (Csomor et al., 2008) and often the median response over a block is more robust measure than the mean. Habituation as demonstrated in (B) was evaluated by fitting a RM ANOVA model to the median 120 dB responses across the session with trial (or trial block), treatment, and trial (block) by treatment interaction as factors and accounting for temporal correlation using an autocorrelated [AR(1)] error structure. Alternatively, habituation can be calculated as a ratio of the median of the last block of 120 dB trials to the 1st initial ASR trial or average of first 3 trials. (C) Representative patterns of PPI. Reflex modification of the ASR is examined by the delivery of a subthreshold (not producing an ASR) stimulus at a defined auditory level above background (65 dB) prior to delivery of the supra-threshold startle stimulus. The session included one initial 120 dB trial followed by a series of blocks of trial types. Block 1 was comprised of 5,120 dB trials; Blocks 2 and 3 were comprised of 31 trials [2 no-stimulus trials, 6 acoustic startle stimuli (40-msec null period followed by 40-msec 120 dB pulse) trials alone, 18 prepulse stimulus trials (40-msec null period followed by 20-msec prepulse of 3, 6, 12, and 15 dB above a 65 dB background), followed by a 100-msec null period and a 40-msec 120 dB pulse; for an entire recording period of 200 msec] presented in a random order, followed by two additional blocks of 5,120 dB trials. Individual differences require that PPI be calculated relative to the individual 120 dB response prior to averaging across groups. It can be calculated for each pre-pulse intensity as the percentage of the median 120 dB response obtained across Blocks 2 and 3. Negative %PPI values are set to 0%. PPI was analyzed using ANOVA with dose and prepulse type as factors. Group 1 are naïve adult rats. Group 2 represents a pattern of hyper-responsiveness. Group 3 represents a pattern of diminished gating and inhibition at the highest prepulse stimuli. Group 4 represents a pattern of lower inhibition at the 12 dB level suggestive of diminished reflex. (?) indicates the question of whether this represents inhibition or that 77 dB stimuli was not a subthreshold intensity.
FIGURE 4
FIGURE 4
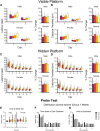
Morris Water Maze. Representative data set of MWM Visual Platform (Cued) and Hidden Platform (Spatial) performance in young adult (75 days of age) male or female Sprague Dawley using a video-imaging (Ethovision XT). A circular black plastic tank (183 × 62 cm) filled with water (25°C) to 10 cm distance from the water surface to the lip of tank. (A,B) Cued learning (Visible Platform) confirmed the ability of the animals to perform the task. Three trials, 10 min ITI, were run daily for 2 days. Altering start location. Median daily latencies and distance traveled were analyzed for dose effects using Kruskal–Wallis tests due to non-normality of measurements. The % change across the 2 days was analyzed by a Kruskal–Wallis test. (C,D) For spatial learning (Hidden Platform), three daily trials, alternating start location, were administered (10-min ITI) for 7 consecutive days reaching criteria (>85% of control animals showing a >30% decrease from initial latency). Daily median latency and distance measures were calculated due to the skewed nature of the distribution. Data medians, quartiles, and extremes of data distributions. Acquisition was determined by RM ANOVA with day and group as main effects. The % change in latency from the first to the last session was analyzed by a Kruskal–Wallis test with Dunn’s multiple comparison procedure and showed a uniform pattern of habituation across groups. (E–G) Representative data for Probe Test. (E) Violin plots of the initial latency to enter goal quadrant (GQ) showing no significant difference but an increase in variability across groups. (F,G) Representative images for Group 1 male rats of (F) time spent in each quadrant and (G) number of entries into each quadrant. The representation of intervals (1) 0–90 s, (2) 0–30 s, (3) 30–60 s (4) 60–90 s demonstrate the shifting behavior of the animal and the preference for the GQ.

References

    1. Aarts E., Verhage M., Veenvliet J. V., Dolan C. V., Van Der Sluis S. (2014). A Solution to Dependency: Using Multilevel Analysis to Accommodate Nested Data. Nat. Neurosci. 17, 491–496. 10.1038/nn.3648 - DOI - PubMed
    1. Åhlgren J., Voikar V. (2019). Housing Mice in the Individually Ventilated or Open Cages-Does it Matter for Behavioral Phenotype? Genes, Brain Behav. 18, e12564. 10.1111/gbb.12564 - DOI - PMC - PubMed
    1. Alstermark B., Pettersson L. G. (2014). Skilled Reaching and Grasping in the Rat: Lacking Effect of Corticospinal Lesion. Front. Neurol. 5, 103. 10.3389/fneur.2014.00103 - DOI - PMC - PubMed
    1. Anger W. K. (2014). Reconsideration of the WHO NCTB Strategy and Test Selection. Neurotoxicology 45, 224–231. 10.1016/j.neuro.2014.08.003 - DOI - PMC - PubMed
    1. Antunes M., Biala G. (2012). The Novel Object Recognition Memory: Neurobiology, Test Procedure, and its Modifications. Cogn. Process. 13, 93–110. 10.1007/s10339-011-0430-z - DOI - PMC - PubMed

LinkOut - more resources