. 2022 Feb 28:9:852775.
doi: 10.3389/fcvm.2022.852775. eCollection 2022.

Loss of m6A Methyltransferase METTL5 Promotes Cardiac Hypertrophy Through Epitranscriptomic Control of SUZ12 Expression

Affiliations

Loss of m6A Methyltransferase METTL5 Promotes Cardiac Hypertrophy Through Epitranscriptomic Control of SUZ12 Expression

Yanchuang Han et al. Front Cardiovasc Med. .

Abstract

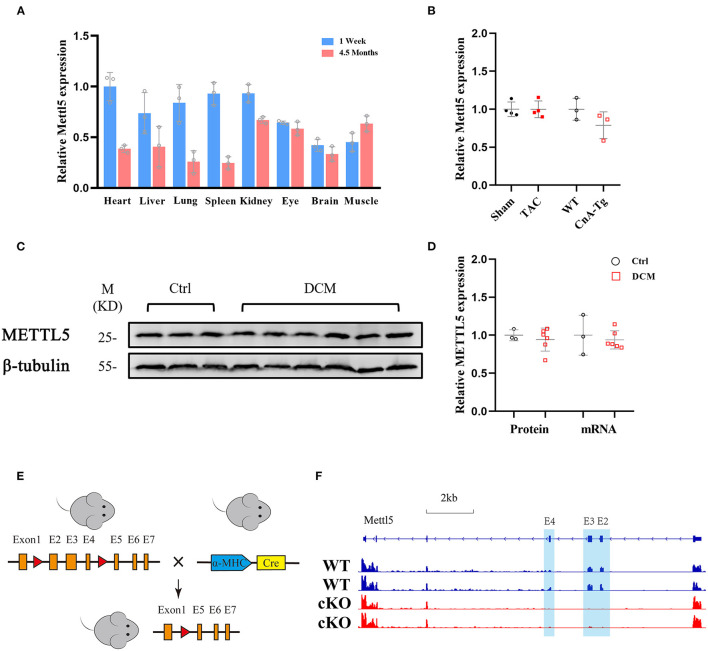
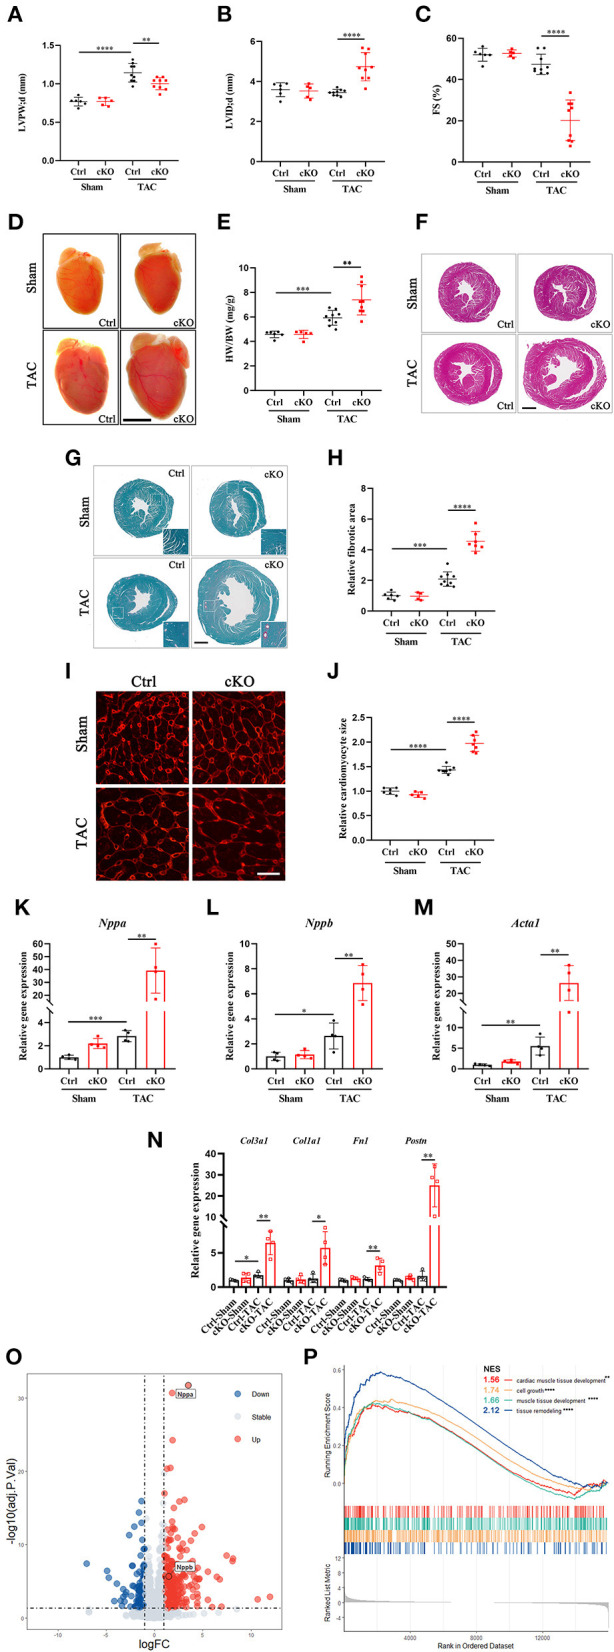
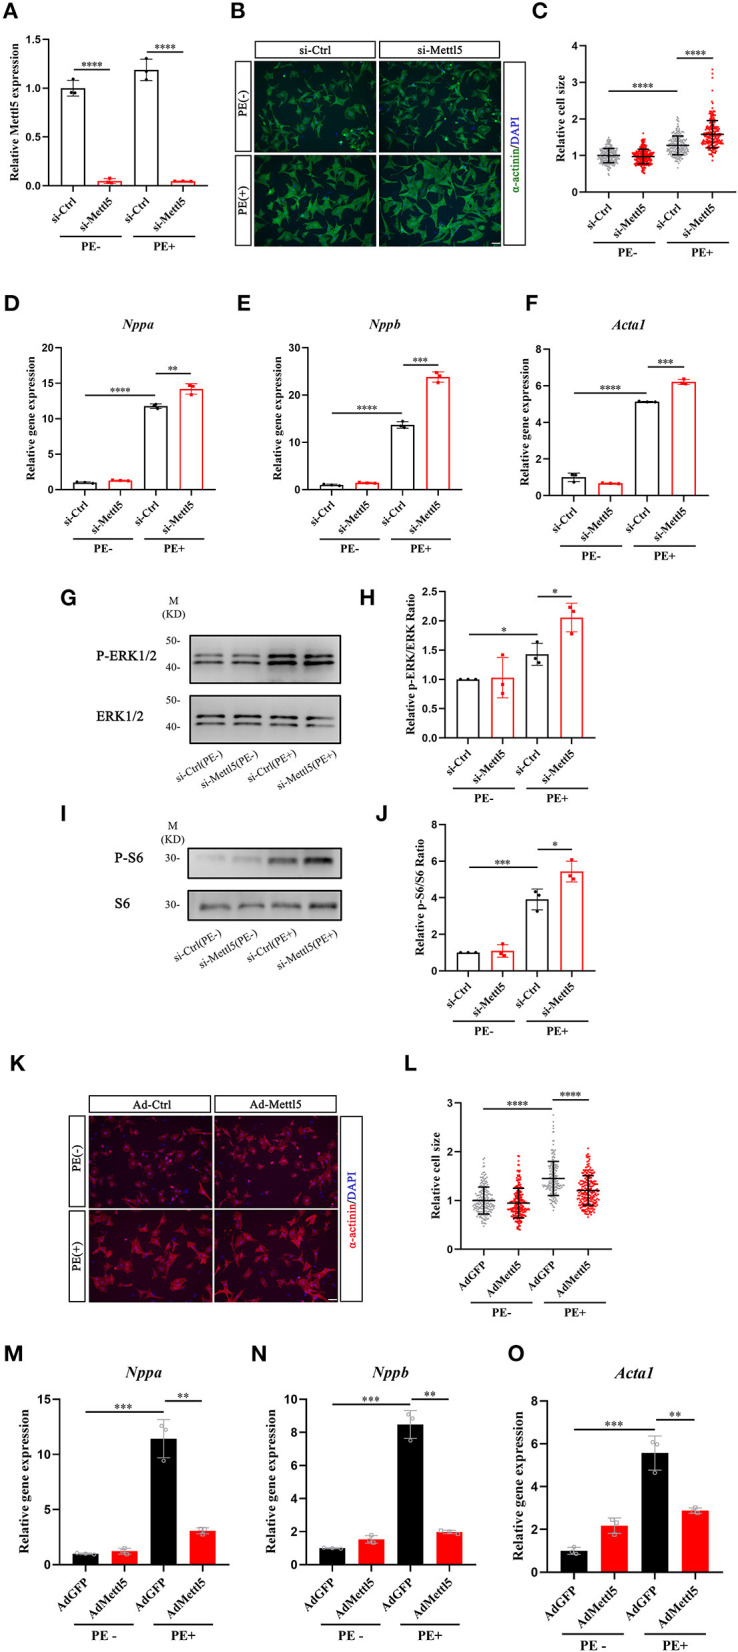
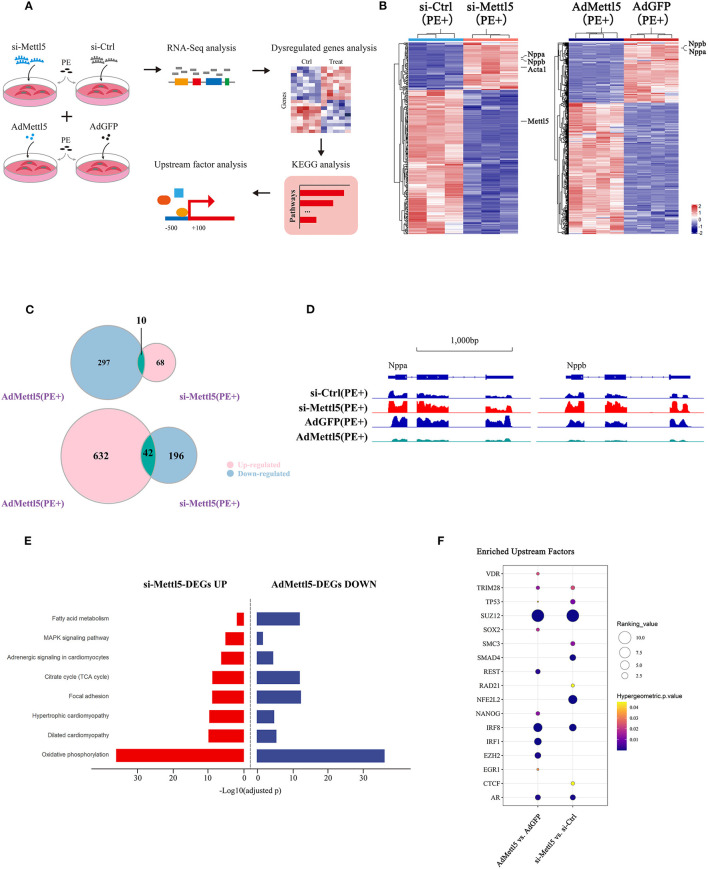
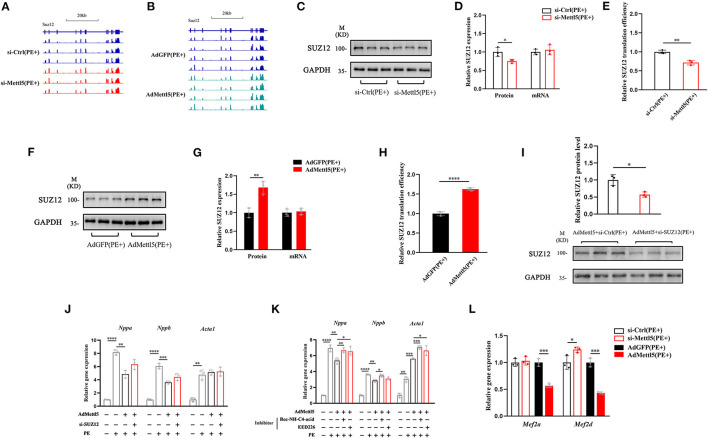
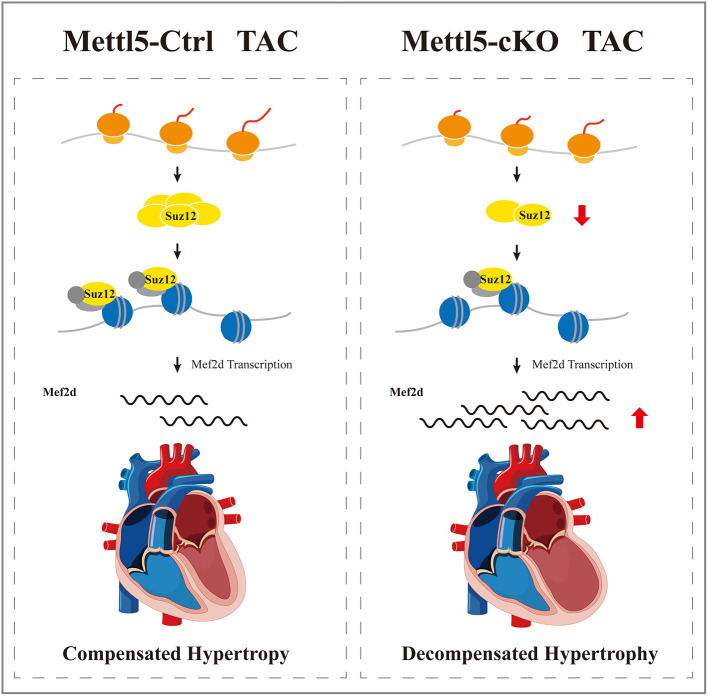
Enhancement of protein synthesis from mRNA translation is one of the key steps supporting cardiomyocyte hypertrophy during cardiac remodeling. The methyltransferase-like5 (METTL5), which catalyzes m6A modification of 18S rRNA at position A1832, has been shown to regulate the efficiency of mRNA translation during the differentiation of ES cells and the growth of cancer cells. It remains unknown whether and how METTL5 regulates cardiac hypertrophy. In this study, we have generated a mouse model, METTL5-cKO, with cardiac-specific depletion of METTL5 in vivo. Loss function of METTL5 promotes pressure overload-induced cardiomyocyte hypertrophy and adverse remodeling. The regulatory function of METTL5 in hypertrophic growth of cardiomyocytes was further confirmed with both gain- and loss-of-function approaches in primary cardiomyocytes. Mechanically, METTL5 can modulate the mRNA translation of SUZ12, a core component of PRC2 complex, and further regulate the transcriptomic shift during cardiac hypertrophy. Altogether, our study may uncover an important translational regulator of cardiac hypertrophy through m6A modification.

Keywords: METTL5; RNA modification; SUZ12; cardiac hypertrophy; translational regulation.


Conflict of interest statement

The authors declare that the research was conducted in the absence of any commercial or financial relationships that could be construed as a potential conflict of interest.

Figures

Figure 1
Figure 1
METTL5 expression profile and the generation of METTL5-cKO mouse. (A) Relative gene expression of METTL5 in different organs from 1 week and 4.5 months old mice by RT-PCR. n = 3 mice in each group. (B) Relative gene expression of METTL5 in TAC vs. Sham (n = 3 mice in each group) and CnA-Tg vs. WT (n = 4 mice in each group) mouse hearts by RT-PCR. (C) The protein level of METTL5 in control patient hearts (n = 3) and dilated cardiomyopathy (DCM) patient hearts (n = 6) by western blotting. β-tubulin srerves as a control. (D) Quantification of western blotting in panel C and the relative expression of METTL5 in control patient hearts (n = 3) and DCM patient hearts (n = 6) by RT-PCR. (E) Schematic of generation of METTL5 cardiomyocyte-specific knockout (METTL5-cKO) mouse. (F) The genomic view of reads in RNA-seq for METTL5 in the IGV browser.
Figure 2
Figure 2
Cardiac-specific knockout of METTL5 in vivo promotes TAC-induced cardiac remodeling. (A–C) Left ventricular posterior wall thickness at end-diastole (LVPW;d), Left ventricular internal dimension at end-diastole (LVID;d), and Fractional shortening (FS) of TAC or sham operated METTL5-cKO and control mice at 4 weeks after surgery. N number (n > 4) for each group is indicated by the number of dots. (D) Representative images of gross morphology of METTL5-cKO and control hearts 4 weeks after TAC or sham operation. Scale bar = 5 mm. (E). Quantification of heart weight to body weight ratio (HW/BW) of METTL5-cKO and control mice 4 weeks after TAC or sham operation. N number (n > 4) for each group is indicated by the number of dots. (F) Representative images of H&E staining of METTL5-cKO and control hearts 4 weeks after TAC or sham operation. Scale bar = 1 mm. (G) Representative images of Fast green and Sirius red staining of METTL5-cKO and control hearts 4 weeks after TAC or sham operation. Scale bar = 1 mm. (H) The fibrotic area of images from Fast green and Sirius red staining is quantified. N number (n > 3) for each group is indicated by the number of dots. (I) Heart cross sections were stained with wheat germ agglutinin (WGA). Scale bar = 25 μm. (J) Cardiomyocyte cross-sectional area was quantified. More than 500 cardiomyocytes from five hearts are quantified for each group. (K–M) Relative gene expression of hypertrophy marker genes by RT-PCR. n = 4 mice in each group. N. Relative gene expression of fibrosis related genes by RT-PCR. n = 4 mice in each group. (O) Volcano plot of differentially expressed genes in METTL5-cKO and control hearts 4 weeks after TAC operation. (P) GSEA analysis of differentially expressed genes in METTL5-cKO and control hearts 4 weeks after TAC operation. (The unpaired T-test was used for 2-group comparisons. *P < 0.05, **P < 0.01, ***P < 0.001, ****P < 0.0001).
Figure 3
Figure 3
METTL5 promotes hypertrophic growth of cardiomyocytes in vitro. (A) qRT-PCR detecting the knockdown of METTL5 in neonatal rat ventricular cardiomyocytes (NRVMs) with siRNA. n = 3 in each group. (B) Representative images of immunostaining of NRVMs transfected with si-METTL5 or control siRNA (si-Ctrl) with or without PE treatment. α-actinin labels cardiomyocytes. DAPI marks nuclei. Scale bar = 50 μm. (C) Quantification of the size of cardiomyocytes in panel B. More than 200 cells are measured in each group. (D–F) Relative gene expression of hypertrophy markers in NRVMs transfected with si-METTL5 or si-Ctrl with or without PE treatment. n = 3 in each group. (G,H) Detection of the expression of phosphorylated and total ERK in NRVMs transfected with si-METTL5 or si-Ctrl with or without PE treatment by western blotting. Protein level is quantified and the ratio of phospho-ERK to total ERK is presented. n = 3 in each group. (I,J) Detection of the expression of phosphorylated and total S6 in NRVMs transfected with si-METTL5 or si-Ctrl with or without PE treatment by western blotting. Protein level is quantified and the ratio of phospho-S6 to total S6 is presented. n = 3 in each group. (K) Representative images of immunostaining of NRVMs transduced with Ad-METTL5 or control virus (Ad-GFP) with or without PE treatment. α-actinin labels cardiomyocytes. DAPI marks nuclei. Scale bar = 50 μm. (L) Quantification of the size of cardiomyocytes in (K) More than 200 cells are measured in each group. (M–O) Relative gene expression of hypertrophy markers in NRVMs transduced with Ad-METTL5 or Ad-GFP with or without PE treatment. n = 3 in each group. The unpaired T-test was used for 2-group comparisons. *P < 0.05, **P < 0.01, ***P < 0.001, ****P < 0.0001.
Figure 4
Figure 4
Transcriptome analyses reveal SUZ12 as a key mediator of METTL5-regulated cardiac phenotype. (A) Schematic showing the experimental design and workflow of transcriptome analyses of siRNA and adenovirus-treated NRVMs under the stimulation of PE. (B) Hierarchical clustering of differentially expressed genes in groups of si-METTL5 vs. si-Ctrl and AdMETTL5 vs. AdGFP under the stimulation of PE. (|Log2FoldChange|>1, adjusted P-value < 0.05). (C) Venn diagram showing the overlap of upregulated- and downregulated-genes in groups of si-METTL5 vs. si-Ctrl and AdMETTL5 vs. AdGFP under the stimulation of PE, respectively. (|Log2FoldChange|>1, adjusted P-value < 0.05). (D) The genomic view of reads in RNA-seq for hypertrophic marker gene Nppa, Nppb in the IGV browser. (E) KEGG pathway enrichment analysis of dysregulated genes in groups of si-METTL5 vs. si-Ctrl and AdMETTL5 vs. AdGFP under the stimulation of PE (adjusted P-value < 0.05). (F) Upstream factor analysis by X2K of the top 500 dysregulated genes (|Log2FoldChange|>1, adjusted P-value < 0.05; ranking by adjusted P-value) in groups of si-METTL5 vs. si-Ctrl and AdMETTL5 vs. AdGFP under the stimulation of PE. The upstream factors were selected by Hypergeometric p-value < 0.05. The algorithm of independent hypothesis weighting (IHW) in DEseq2 was used for calculating the adjusted P-value of the RNA-seq data.
Figure 5
Figure 5
METTL5 regulates the translation efficiency of SUZ12. (A,B) The genomic view of SUZ12 mRNA reads of RNA-seq of si-METTL5 vs. si-Ctrl and AdMETTL5 vs. AdGFP under the stimulation of PE in the IGV browser. (C) Detection of the expression of SUZ12 in si-METTL5 and si-Ctrl treated NRVCs under the stimulation of PE. GAPDH serves as control. (D) Quantification of SUZ12 protein level and qRT-PCR detection of the relative gene expression of SUZ12 in si-METTL5 and si-Ctrl treated NRVCs under the stimulation of PE. (E) The translation efficiency (TE) is presented by calculating the ratio between transcript level and protein level. n = 3 for each group. (F) Detection of the expression of SUZ12 in Ad-METTL5 and Ad-Ctrl treated NRVCs under the stimulation of PE. GAPDH serves as control. (G) Quantification of SUZ12 protein level and qRT-PCR detection of the relative gene expression of SUZ12 in Ad-METTL5 and Ad-Ctrl treated NRVCs under the stimulation of PE. (H) The translation efficiency (TE) is presented by calculating the ratio between transcript level and protein level. n = 3 for each group. (I) Detection and quantification of the knockdown of SUZ12 in Ad-METTL5 treated NRVCs under the stimulation of PE. GAPDH serves as control. n = 3 for each group. (J,K) Relative gene expression of hypertrophy markers in NRVMs treated with (H) si-SUZ12 or (I) SUZ12 inhibitors under Ad-METTL5 or Ad-GFP transfection with or without PE treatment. n = 3 in each group. (L) Relative gene expression of Mef2a and Mef2d in METTL5 knockdown and overexpression NRVCs and control cells under the stimulation of PE by RT-PCR. n = 3 in each group. The unpaired T-test was used for 2-group comparisons. *P < 0.05, **P < 0.01, ***P < 0.001, ****P < 0.0001.
Figure 6
Figure 6
A proposed working model of METTL5 in cardiac remodeling.

Similar articles

Cited by

References

    1. Hill JA, Olson EN. Cardiac plasticity. N Engl J Med. (2008) 358:1370–80. 10.1056/NEJMra072139 - DOI - PubMed
    1. Heineke J, Molkentin JD. Regulation of cardiac hypertrophy by intracellular signaling pathways. Nat Rev Mol Cell Biol. (2006) 7:589–600. 10.1038/nrm1983 - DOI - PubMed
    1. Jaalouk DE, Lammerding J. Mechanotransduction gone awry. Nat Rev Mol Cell Biol. (2009) 10:63–73. 10.1038/nrm2597 - DOI - PMC - PubMed
    1. Schluter KD, Goldberg Y, Taimor G, Schafer M, Piper HM. Role of phosphatidylinositol 3-kinase activation in the hypertrophic growth of adult ventricular cardiomyocytes. Cardiovasc Res. (1998) 40:174–81. 10.1016/S0008-6363(98)00171-0 - DOI - PubMed
    1. Rolfe M, McLeod LE, Pratt PF, Proud CG. Activation of protein synthesis in cardiomyocytes by the hypertrophic agent phenylephrine requires the activation of erk and involves phosphorylation of tuberous sclerosis complex 2 (tsc2). Biochem J. (2005) 388:973–84. 10.1042/BJ20041888 - DOI - PMC - PubMed