. 2022 Feb 28:13:849080.
doi: 10.3389/fmicb.2022.849080. eCollection 2022.

Distinct Expansion of Group II Introns During Evolution of Prokaryotes and Possible Factors Involved in Its Regulation

Affiliations

Distinct Expansion of Group II Introns During Evolution of Prokaryotes and Possible Factors Involved in Its Regulation

Masahiro C Miura et al. Front Microbiol. .

Abstract

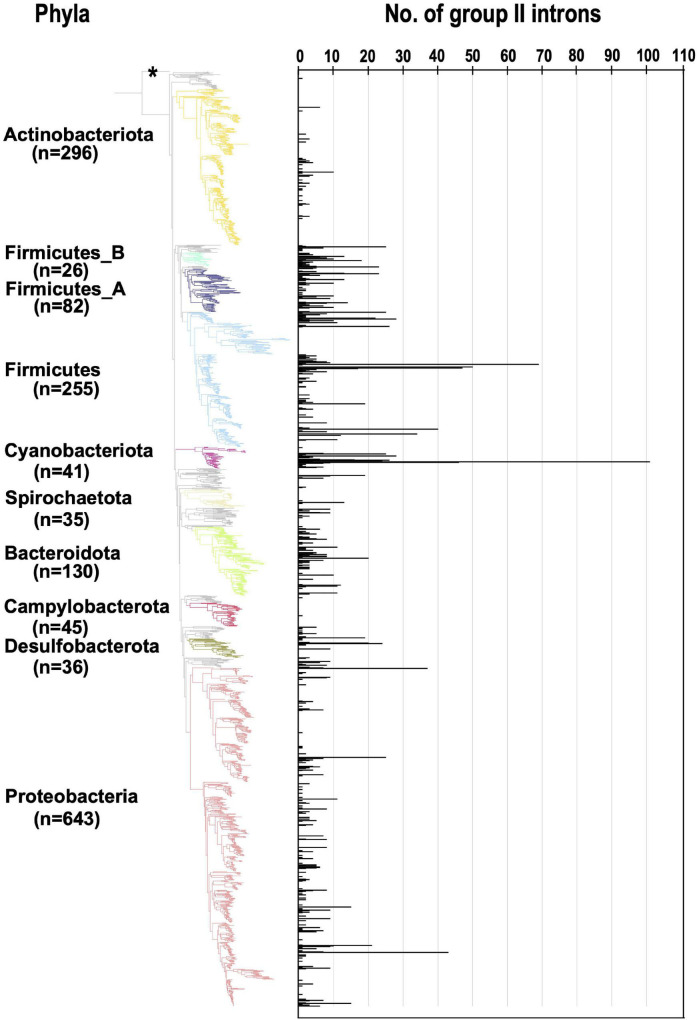
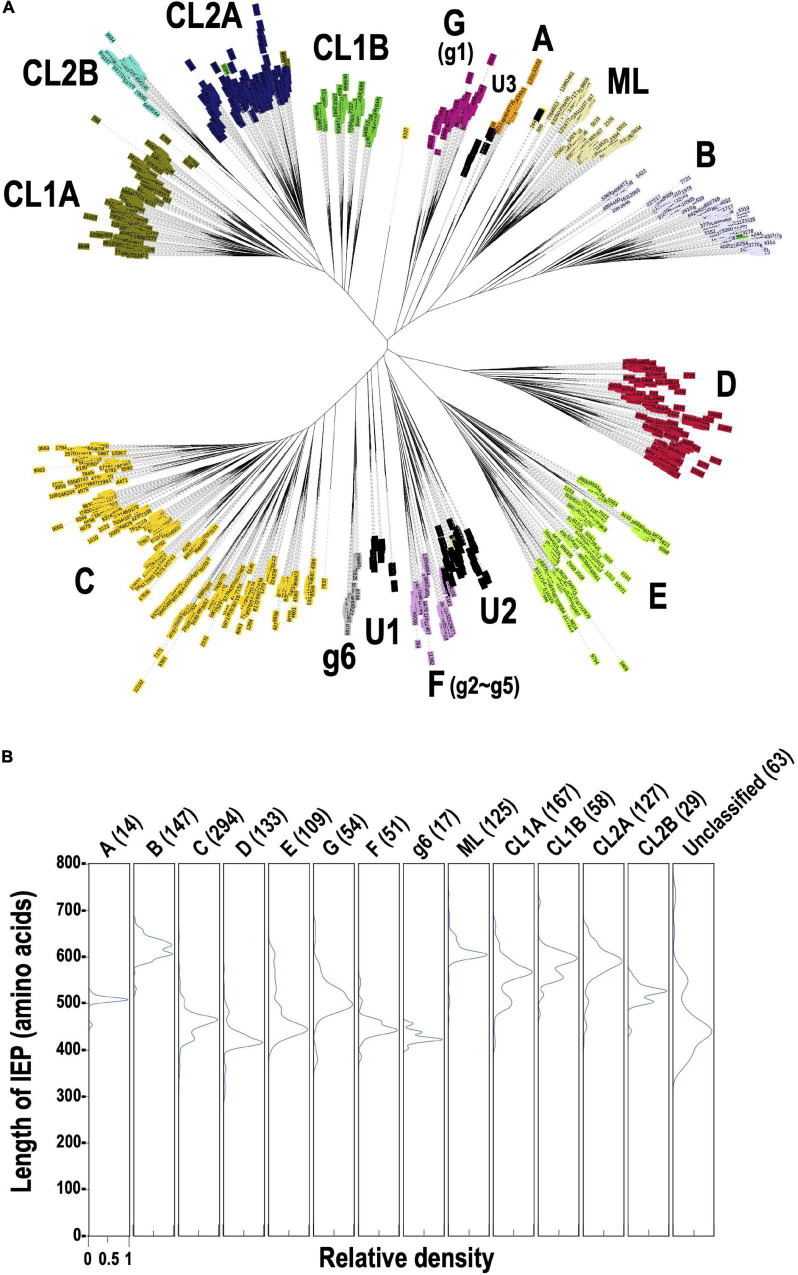
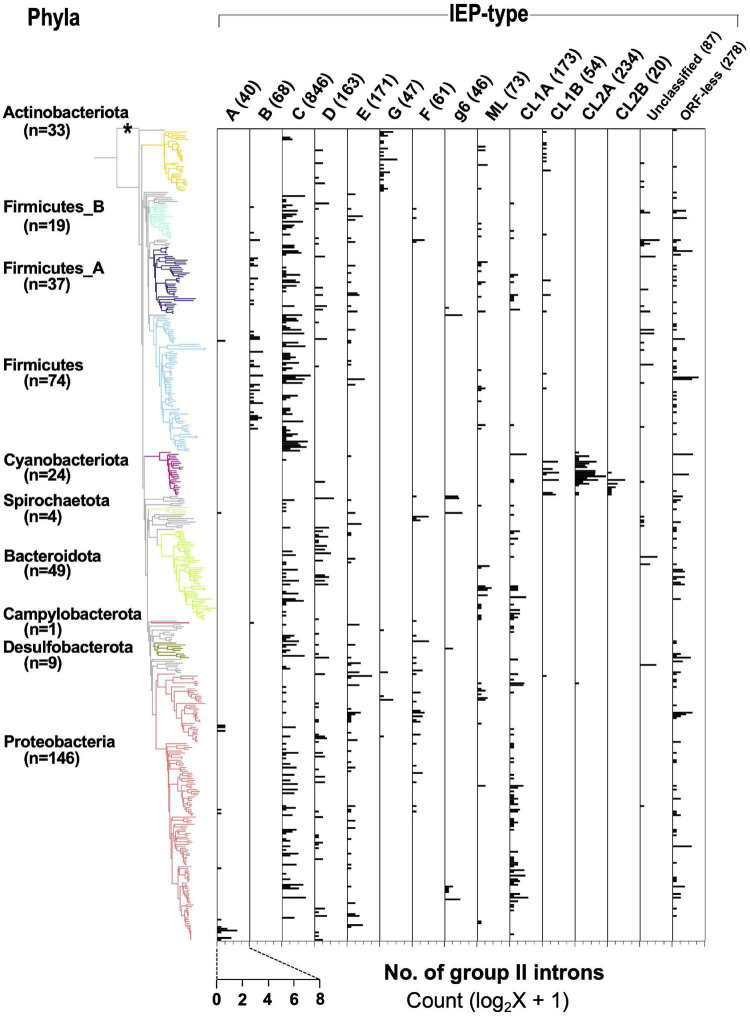
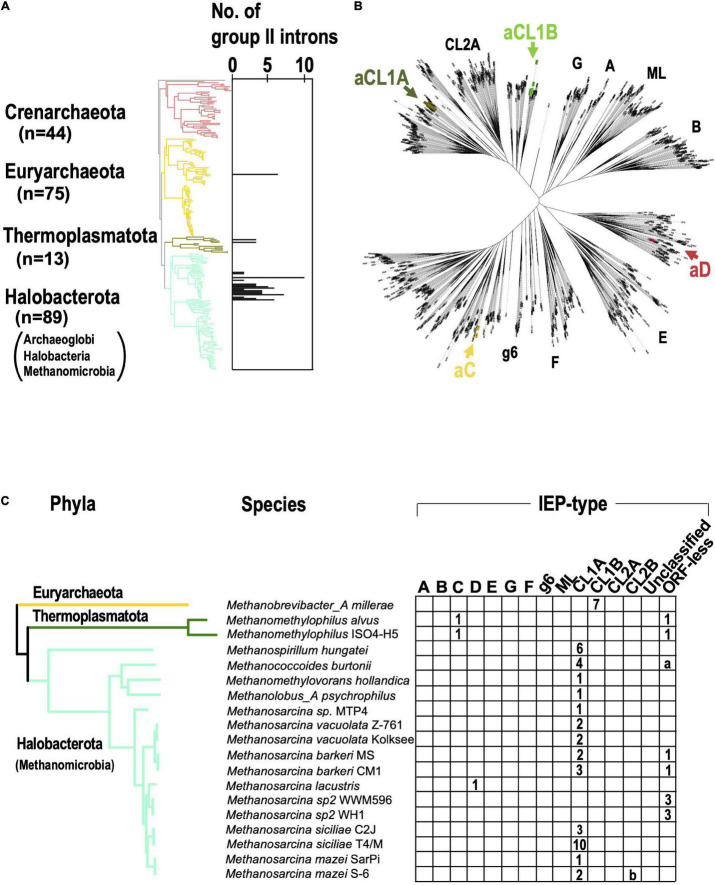
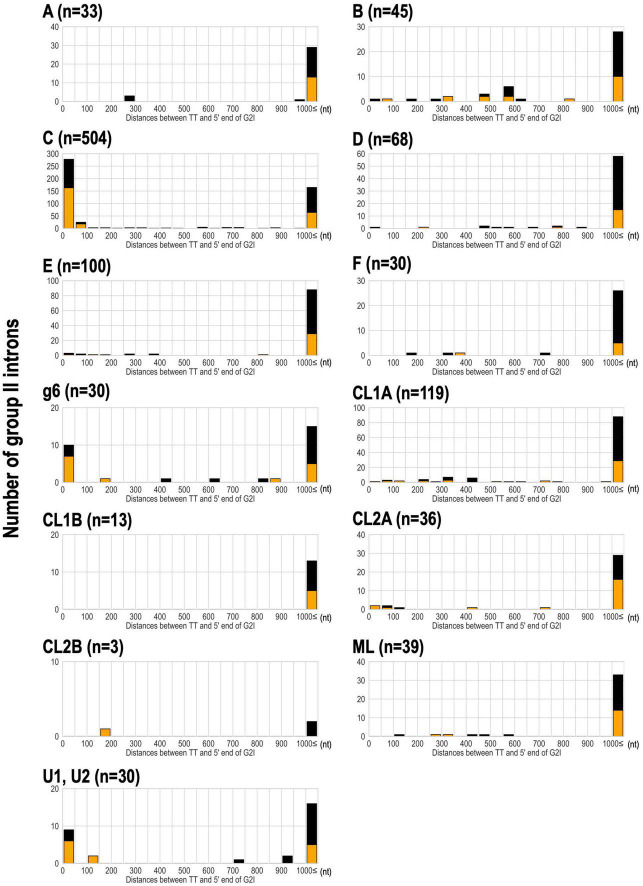
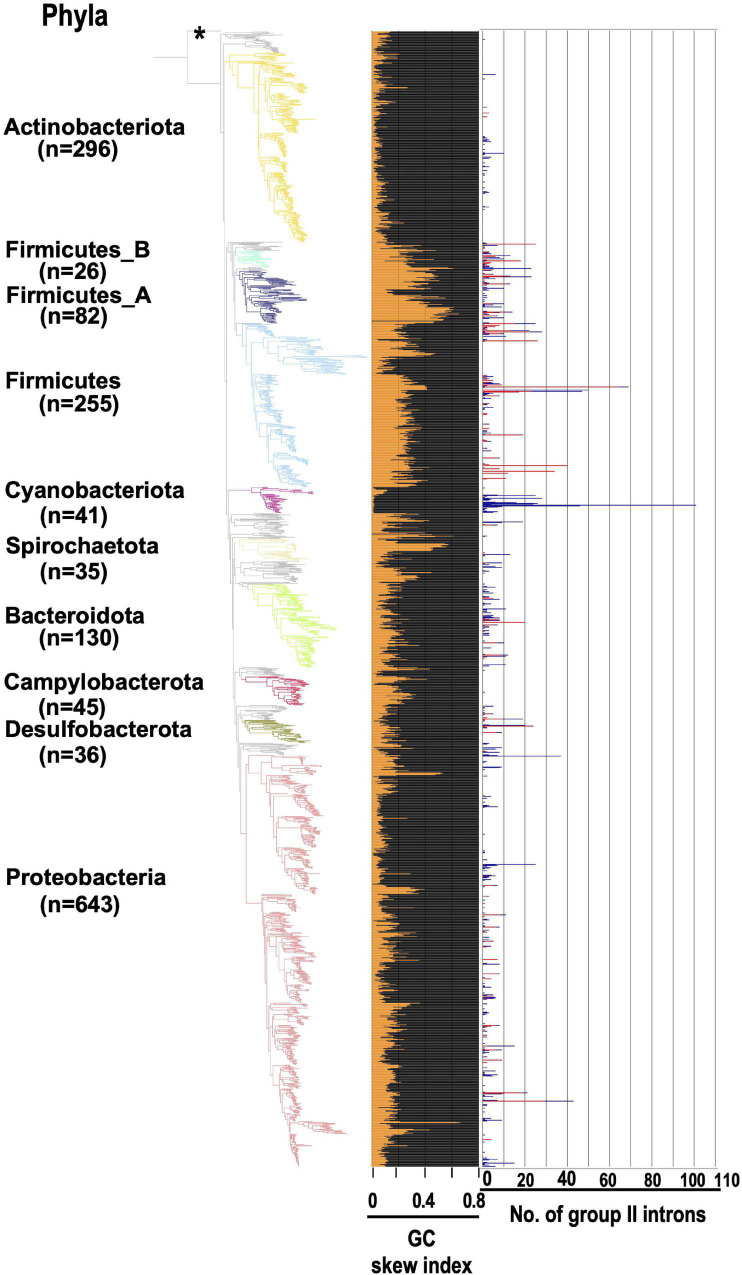
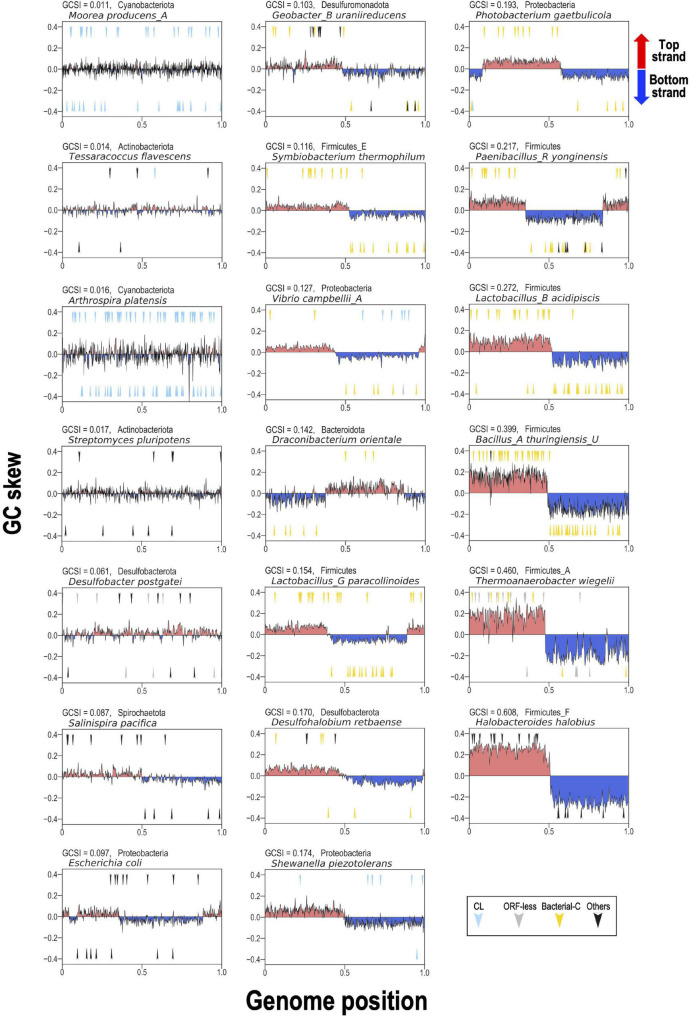
Group II introns (G2Is) are ribozymes that have retroelement characteristics in prokaryotes. Although G2Is are suggested to have been an important evolutionary factor in the prokaryote-to-eukaryote transition, comprehensive analyses of these introns among the tens of thousands of prokaryotic genomes currently available are still limited. Here, we developed a bioinformatic pipeline that systematically collects G2Is and applied it to prokaryotic genomes. We found that in bacteria, 25% (447 of 1,790) of the total representative genomes had an average of 5.3 G2Is, and in archaea, 9% (28 of 296) of the total representative genomes had an average of 3.0 G2Is. The greatest number of G2Is per genome was 101 in Arthrospira platensis (phylum Cyanobacteriota). A comprehensive sequence analysis of the intron-encoded protein (IEP) in each G2I sequence was conducted and resulted in the addition of three new IEP classes (U1-U3) to the previous classification. This analysis suggested that about 30% of all IEPs are non-canonical IEPs. The number of G2Is per genome was defined almost at the phylum level, and at least in the following two phyla, Firmicutes, and Cyanobacteriota, the type of IEP was largely associated as a factor in the G2I increase, i.e., there was an explosive increase in G2Is with bacterial C-type IEPs, mainly in the phylum Firmicutes, and in G2Is with CL-type IEPs, mainly in the phylum Cyanobacteriota. We also systematically analyzed the relationship between genomic signatures and the mechanism of these increases in G2Is. This is the first study to systematically characterize G2Is in the prokaryotic phylogenies.

Keywords: bioinformatics; genomic signatures; group II intron; intron-encoded protein; prokaryotic genomes.


Conflict of interest statement

The authors declare that the research was conducted in the absence of any commercial or financial relationships that could be construed as a potential conflict of interest.

Figures

FIGURE 1
FIGURE 1
Increase in the number of G2Is in specific bacterial genomes belonging to each bacterial phylum. The numbers of G2Is in representative complete bacterial genomes (1,774 genomes) are shown. Bacterial phyla are shown on the left and each corresponding branch on the bacterial phylogenic tree is colored. The numbers in bracket represents the number of genomes in each phylum. The position of the outgroup [Candidatus Saccharibacteria oral taxon TM7x (RefSeq assembly accession: GCF_000803625.1)] is indicated by the asterisk.
FIGURE 2
FIGURE 2
Phylogeny of the prokaryotic IEPs detected in this study. (A) An unrooted phylogenetic tree of representative IEP sets (1,949 proteins) in bacterial G2Is. The representative IEP sets were selected based on a similarity analysis (see section “Materials and Methods,” Prediction of IEP Sequences). The types of IEP are: A (bacterial-A, orange), B (bacterial-B, lavender), C (bacterial-C, yellow), D (bacterial-D, red), E (bacterial-E, light green), G [g1] (bacterial-G [g1], violet), F [g2–g5] (bacterial-F [g2–g5], plum), g6 (bacterial-g6, silver), ML (light yellow), CL1A (olive), CL1B (green), CL2A (blue), and CL2B (turquoise). U1–U3 (black) are newly identified clusters that were previously annotated as “unclassified.” (B) Distribution of the amino acid lengths of each canonical IEP. The peak relative density is set as 1.0 in each case.
FIGURE 3
FIGURE 3
Distribution of types of IEPs in the bacterial phylogeny. A bacterial phylogenetic tree was constructed from 443 representative bacterial genomes whose genome contain G2I(s) (see section “Materials and Methods”), and Candidatus Saccharibacteria oral taxon TM7x (RefSeq assembly accession: GCF_000803625.1) was used as the outgroup. See the legends of Figures 1, 2 for details. The horizontal axis represents the number of G2Is for each IEP type.
FIGURE 4
FIGURE 4
G2Is are increased in certain archaeal phyla. (A) Increases in numbers of G2Is in specific archaeal phyla. The numbers of G2Is in complete archaeal genomes (222 genomes) are shown. Archaeal phyla are shown on the left and each corresponding branch on the archaeal phylogenic tree is colored. The numbers in brackets represent the number of genomes in each phylum. (B) Positions of archaeal IEPs on an unrooted phylogenetic tree of the representative IEP sets (see Figure 2A in details). aCL1A (archaeal CL1A), aCL1B (archaeal CL1B), aC (archaeal-C), and aD (archaeal-D). (C) Distribution of types of IEPs in the archaeal phylogeny. The distribution of the types of IEPs in 19 archaeal genomes that contain G2I(s) is shown. Numbers of G2I(s) per IEP type are also shown in each box. a: Analysis of the Methanococcoides burtonii genome with our pipeline incorrectly detected four ORF-less G2Is. These were parts of CL1A-type G2Is. b: Analysis of the Methanosarcina mazei S-6 genome with our pipeline incorrectly detected one G2I classified as the CL2B type, because the G2I was divided by a transposase. A detailed analysis revealed that it was a CL1A-type G2I.
FIGURE 5
FIGURE 5
Analysis of the distance between the transcriptional terminator and the 5′ end of G2Is for each IEP type in bacteria. The distance between the transcriptional terminator and the 5′ end of the G2I was calculated, and the number of G2Is at each distance is represented as a histogram for each IEP type. L-shaped terminators are shown in orange boxes and I-shaped terminators are shown in black boxes. G2Is with bacterial-g1 IEPs are not shown because their 5′ ends were not identified in this analysis. TT: transcriptional terminator.
FIGURE 6
FIGURE 6
GCSI and number of G2Is in the bacterial phylogeny. The GC skew index and numbers of G2Is in representative complete bacterial genomes (1,774 genomes) are shown. Bacterial phyla are shown on left and each corresponding branch on the bacterial phylogenic tree is colored. The numbers in brackets represent the number of genomes in each phylum. The position of the outgroup [Candidatus Saccharibacteria oral taxon TM7x (RefSeq assembly accession: GCF_000803625.1)] is indicated by the asterisk. The orange line in the middle panel indicates the GC skew index of the longest genome in each bacterial species. The numbers of G2Is are also shown on the right (red line: G2Is with bacterial-C type IEPs; blue line: G2Is with other IEPs).
FIGURE 7
FIGURE 7
GC skew and insertion positions of G2Is in 20 representative bacterial genomes. In the boxes, the vertical axis shows the GC skew index of each genome, and the boxes are arranged in ascending order from the upper left according to the GCSI. The horizontal axis shows the relative position of each genome; the start position of the base sequence in each GenBank file is set to 0, and the end position is set to 1. The arrow in the upper half of each plot represents the insertion of G2Is into the top strand, and the arrow in the lower half represents the insertion of G2Is into the bottom strand. The colors of the arrows and the classification of G2Is are as follows: CL type (blue), ORF-less (gray), bacterial-C type (yellow), and others (black). The GCSI, bacterial phylogeny, and species name are shown in the upper left of each box. The RefSeq genome accession numbers are as follows: Moorea producens_A: NZ_CP017599.1; Tessaracoccus flavescens: NZ_CP019607.1; Arthrospira platensis: NC_016640.1; Streptomyces pluripotens: NZ_CP021080.1; Desulfobacter postgatei: NZ_CM001488.1; Salinispira pacifica: NC_023035.1; Escherichia coli: NC_011750.1; Geobacter_B uraniireducens: NC_009483.1; Symbiobacterium thermophilum: NC_006177.1; Vibrio campbellii_A: NC_009784.1; Draconibacterium orientale: NZ_CP007451.1; Lactobacillus_G paracollinoides: NZ_CP014915.1; Desulfohalobium retbaense: NC_013223.1; Shewanella piezotolerans: NC_011566.1; Photobacterium gaetbulicola: NZ_CP005974.1; Paenibacillus_R yonginensis: NZ_CP014167.1; Lactobacillus_B acidipiscis: NZ_LT630287.1; Bacillus_A thuringiensis_U: NC_022873.1; Thermoanaerobacter wiegelii: NC_015958.1; Halobacteroides halobius: NC_019978.1.

Similar articles

Cited by

References

    1. Abebe M., Candales M. A., Duong A., Hood K. S., Li T., Neufeld R. A. E., et al. (2013). A pipeline of programs for collecting and analyzing group II intron retroelement sequences from GenBank. Mob DNA 4 28. 10.1186/1759-8753-4-28 - DOI - PMC - PubMed
    1. Arakawa K., Mori K., Ikeda K., Matsuzaki T., Kobayashi Y., Tomita M. (2003). G-language Genome Analysis Environment: a workbench for nucleotide sequence data mining. Bioinformatics 19 305–306. 10.1093/bioinformatics/19.2.305 - DOI - PubMed
    1. Arakawa K., Suzuki H., Tomita M. (2009). Quantitative analysis of replication-related mutation and selection pressures in bacterial chromosomes and plasmids using generalised GC skew index. BMC Genom. 10:640. 10.1186/1471-2164-10-640 - DOI - PMC - PubMed
    1. Artsimovitch I. (2018). Rebuilding the bridge between transcription and translation. Mol. Microbiol. 108 467–472. 10.1111/mmi.13964 - DOI - PMC - PubMed
    1. Bailey T. L., Boden M., Buske F. A., Frith M., Grant C. E., Clementi L., et al. (2009). MEME SUITE: tools for motif discovery and searching. Nucleic Acids Res. 37 W202–W208. 10.1093/nar/gkp335 - DOI - PMC - PubMed

LinkOut - more resources