

Polyene Phosphatidylcholine Ameliorates High Fat Diet-Induced Non-alcoholic Fatty Liver Disease via Remodeling Metabolism and Inflammation
- PMID: 35295576
- PMCID: PMC8918669
- DOI: 10.3389/fphys.2022.810143
Polyene Phosphatidylcholine Ameliorates High Fat Diet-Induced Non-alcoholic Fatty Liver Disease via Remodeling Metabolism and Inflammation
Abstract
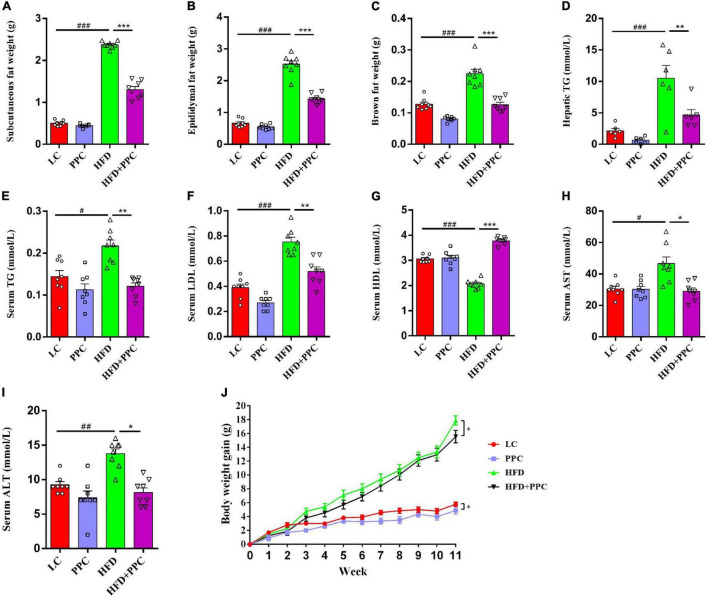
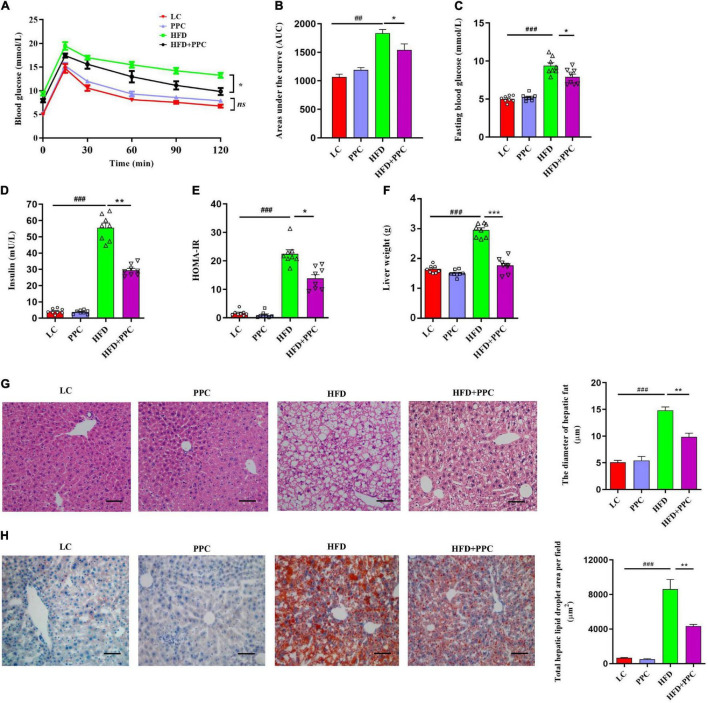
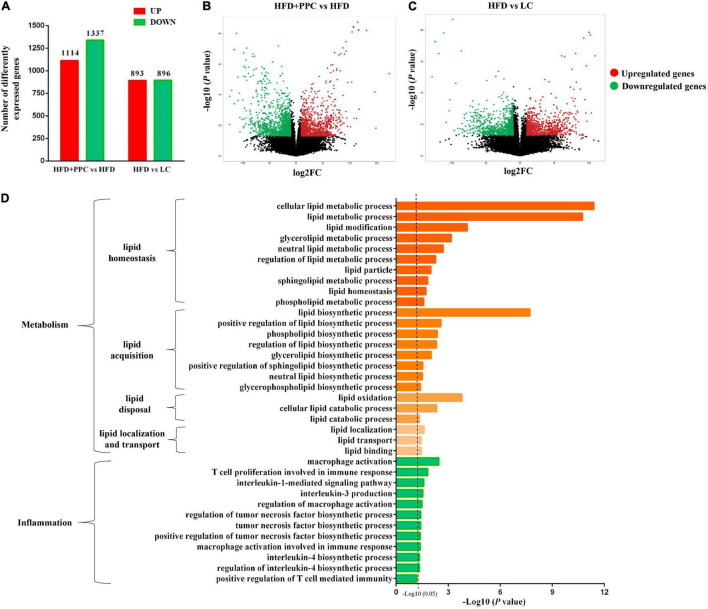
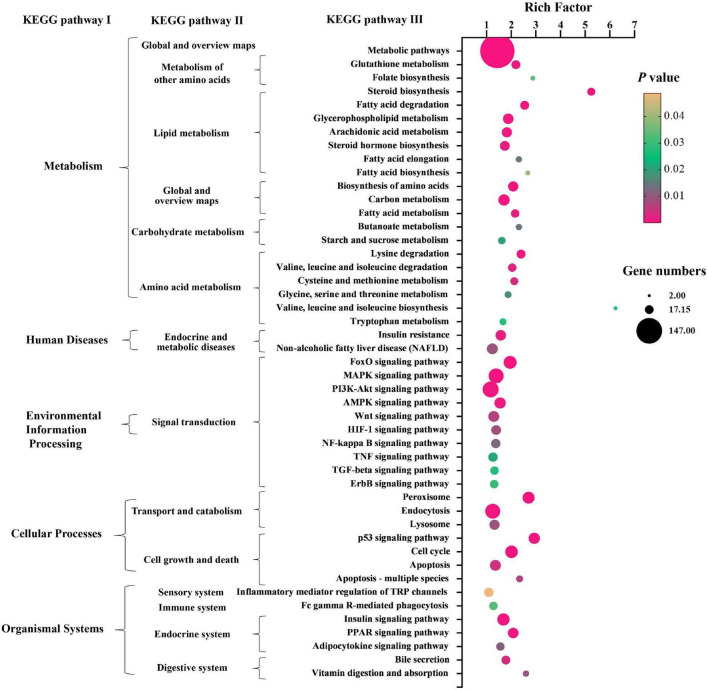
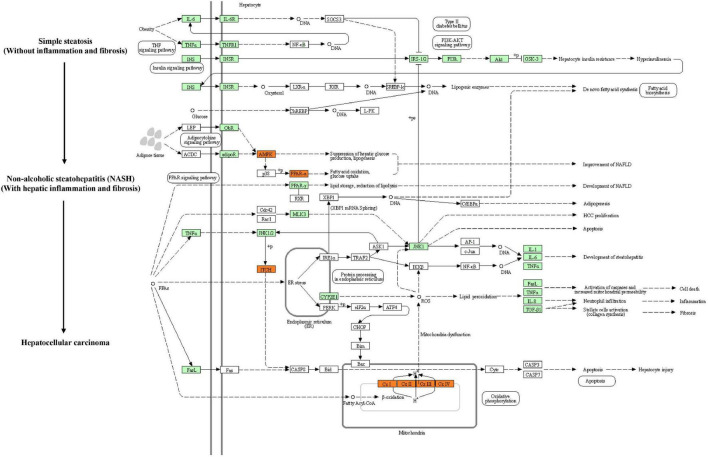
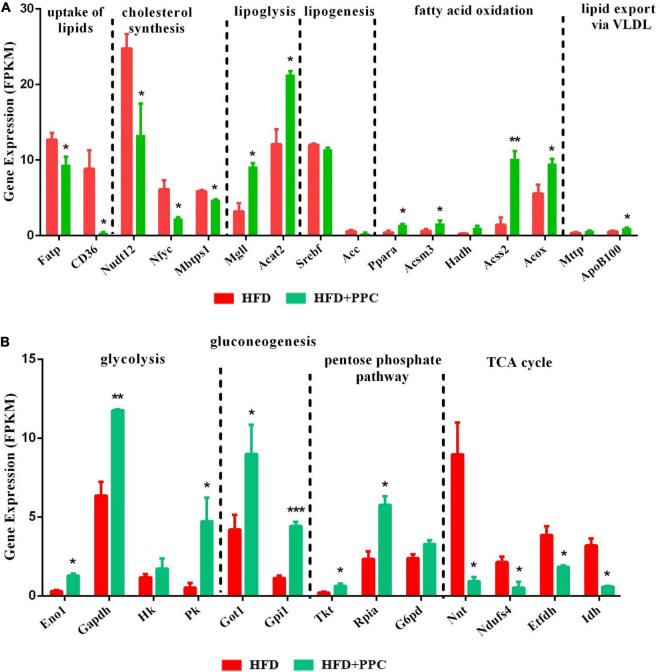
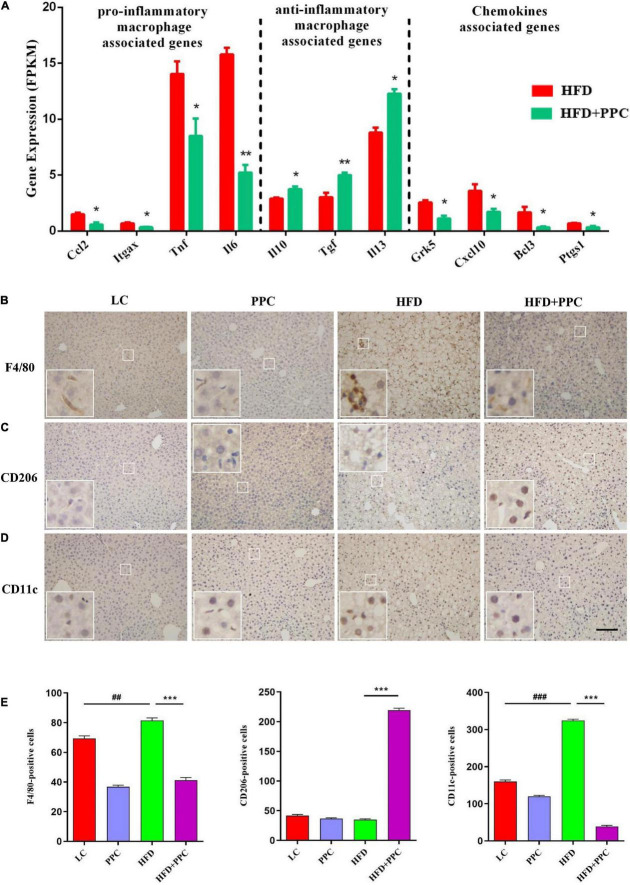
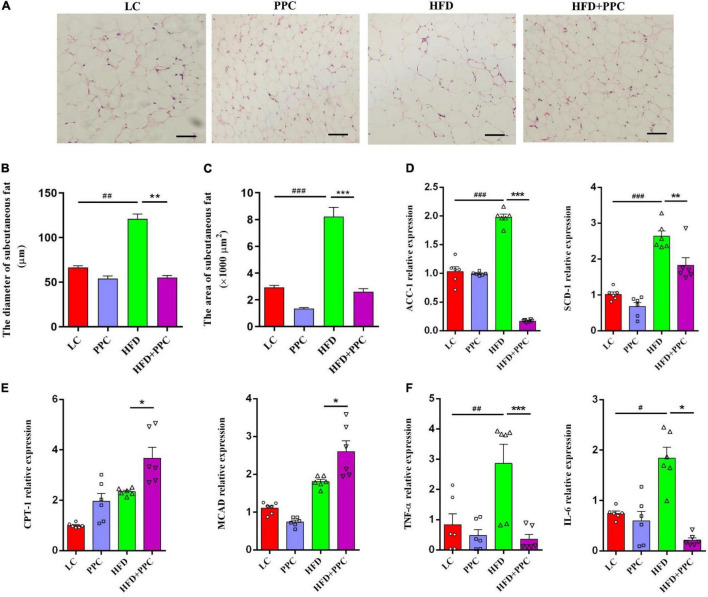
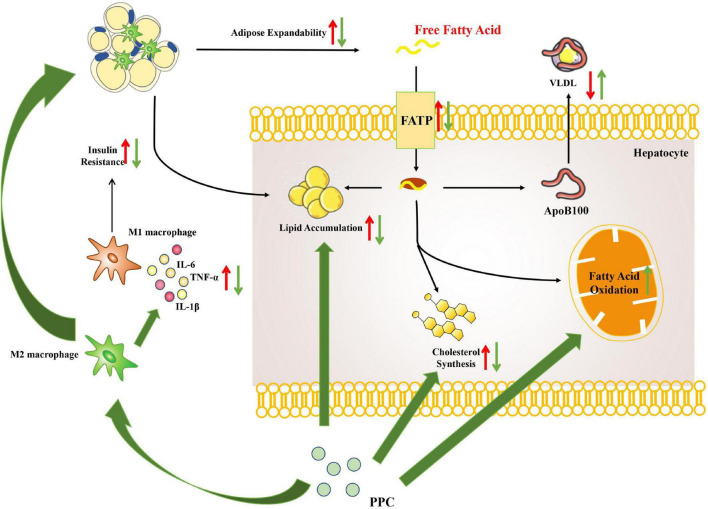
Recent years have witnessed a rise in the morbidity of non-alcoholic fatty liver disease (NAFLD), in line with the global outbreak of obesity. However, effective intervention strategy against NAFLD is still unavailable. The present study sought to investigate the effect and mechanism of polyene phosphatidylcholine (PPC), a classic hepatoprotective drug, on NAFLD induced by high fat diet (HFD). We found that PPC intervention reduced the mass of liver, subcutaneous, epididymal, and brown fats in HFD mice. Furthermore, PPC supplementation significantly mitigated liver steatosis and improved glucose tolerance and insulin sensitivity in HFD mice, which was accompanied by declined levels of hepatic triglyceride, serum triglyceride, low density lipoprotein, aspartate aminotransferase, and alanine aminotransferase. Using transcriptome analysis, there were 1,789 differentially expressed genes (| fold change | ≥ 2, P < 0.05) including 893 upregulated genes and 896 downregulated genes in the HFD group compared to LC group. A total of 1,114 upregulated genes and 1,337 downregulated genes in HFD + PPC group were identified in comparison to HFD group. With the help of Gene Ontology (GO) analysis, these differentially expressed genes between HFD+PPC and HFD group were discovered related to "lipid metabolic process (GO: 0006629)," "lipid modification (GO: 0030258)," and "lipid homeostasis (GO: 0055088)". Though Kyoto Encyclopedia of Genes and Genomes (KEGG) pathway analysis, we found pathways associated with hepatic homeostasis of metabolism and inflammation. Notably, the pathway "Non-alcoholic fatty liver disease (mmu04932)" (P-value = 0.00698) was authenticated in the study, which may inspire the potential mechanism of PPC to ameliorate NAFLD. The study also found that lipolysis, fatty acid oxidation, and lipid export associated genes were upregulated, while the genes in uptake of lipids and cholesterol synthesis were downregulated in the liver of HFD mice after PPC supplementation. Interestingly, PPC attenuated the metabolic inflammation via inhibiting pro-inflammatory macrophage in the livers of mice fed by HFD. In summary, this study demonstrates that PPC can ameliorate HFD-induced liver steatosis via reprogramming metabolic and inflammatory processes, which inspire clues for further clarifying the intervention mechanism of PPC against NAFLD.
Keywords: high fat diet; inflammation; liver steatosis; metabolic remodeling; non-alcoholic fatty liver disease; polyene phosphatidylcholine.
Copyright © 2022 Lu, Feng, Zhao, Jiang, Xu, Zhou, Dai, Wu, Sun, Yang, Lin and Pan.
Conflict of interest statement
The authors declare that the research was conducted in the absence of any commercial or financial relationships that could be construed as a potential conflict of interest.
Figures
Similar articles
-
Corilagin prevents non-alcoholic fatty liver disease via improving lipid metabolism and glucose homeostasis in high fat diet-fed mice.Front Nutr. 2022 Aug 17;9:983450. doi: 10.3389/fnut.2022.983450. eCollection 2022. Front Nutr. 2022. PMID: 36071929 Free PMC article.
-
Unraveling the molecular mechanisms of Fufangduzhong formula in alleviating high-fat diet-induced non-alcoholic fatty liver disease in mice.Front Pharmacol. 2025 Mar 12;16:1542143. doi: 10.3389/fphar.2025.1542143. eCollection 2025. Front Pharmacol. 2025. PMID: 40144651 Free PMC article.
-
Water extract from artichoke ameliorates high-fat diet-induced non-alcoholic fatty liver disease in rats.BMC Complement Med Ther. 2022 Nov 24;22(1):308. doi: 10.1186/s12906-022-03794-9. BMC Complement Med Ther. 2022. PMID: 36424606 Free PMC article.
-
Soybean polyenylphosphatidylcholine (PPC) is beneficial in liver and extrahepatic tissue injury: An update in experimental research.Anat Rec (Hoboken). 2024 Jun;307(6):2162-2186. doi: 10.1002/ar.25333. Epub 2023 Oct 10. Anat Rec (Hoboken). 2024. PMID: 37814787 Review.
-
Polyene phosphatidylcholine protects against radiation induced tissue injury without affecting radiotherapeutic efficacy in lung cancer.Am J Cancer Res. 2019 Jun 1;9(6):1091-1103. eCollection 2019. Am J Cancer Res. 2019. PMID: 31285944 Free PMC article. Review.
Cited by
-
The non-oral infection of larval Echinococcus granulosus induces immune and metabolic reprogramming in the colon of mice.Front Immunol. 2023 Jan 13;13:1084203. doi: 10.3389/fimmu.2022.1084203. eCollection 2022. Front Immunol. 2023. PMID: 36713407 Free PMC article.
-
Bioinformatics based exploration of the anti-NAFLD mechanism of Wang's empirical formula via TLR4/NF-κB/COX2 pathway.Mol Med. 2024 Dec 27;30(1):278. doi: 10.1186/s10020-024-01022-3. Mol Med. 2024. PMID: 39730994 Free PMC article.
-
Hydroxysafflor yellow A alleviates oxidative stress and inflammatory damage in the livers of mice with nonalcoholic fatty liver disease and modulates gut microbiota.Front Pharmacol. 2025 Jun 6;16:1568608. doi: 10.3389/fphar.2025.1568608. eCollection 2025. Front Pharmacol. 2025. PMID: 40548050 Free PMC article.
-
Effects of semaglutide-loaded lipid nanocapsules on metabolic dysfunction-associated steatotic liver disease.Drug Deliv Transl Res. 2024 Oct;14(10):2917-2929. doi: 10.1007/s13346-024-01576-z. Epub 2024 Apr 13. Drug Deliv Transl Res. 2024. PMID: 38615156 Free PMC article.
-
Hedan tablet ameliorated non-alcoholic steatohepatitis by moderating NF-κB and lipid metabolism-related pathways via regulating hepatic metabolites.J Cell Mol Med. 2024 Apr;28(7):e18194. doi: 10.1111/jcmm.18194. J Cell Mol Med. 2024. PMID: 38506086 Free PMC article.
References
LinkOut - more resources
Full Text Sources