. 2022 Feb 22:12:808250.
doi: 10.3389/fmicb.2021.808250. eCollection 2021.

Expression of MicroRNAs Is Dysregulated by HIV While Mycobacterium tuberculosis Drives Alterations of Small Nucleolar RNAs in HIV Positive Adults With Active Tuberculosis

Affiliations

Expression of MicroRNAs Is Dysregulated by HIV While Mycobacterium tuberculosis Drives Alterations of Small Nucleolar RNAs in HIV Positive Adults With Active Tuberculosis

Oskar Olsson et al. Front Microbiol. .

Abstract

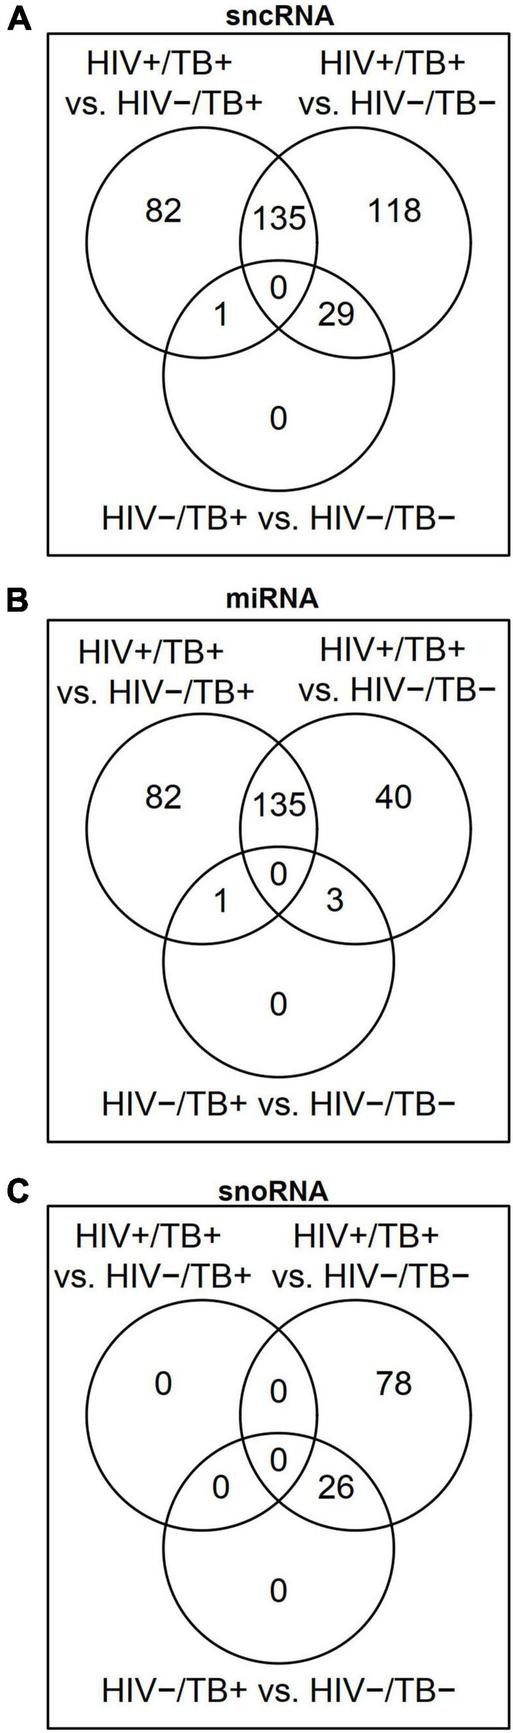
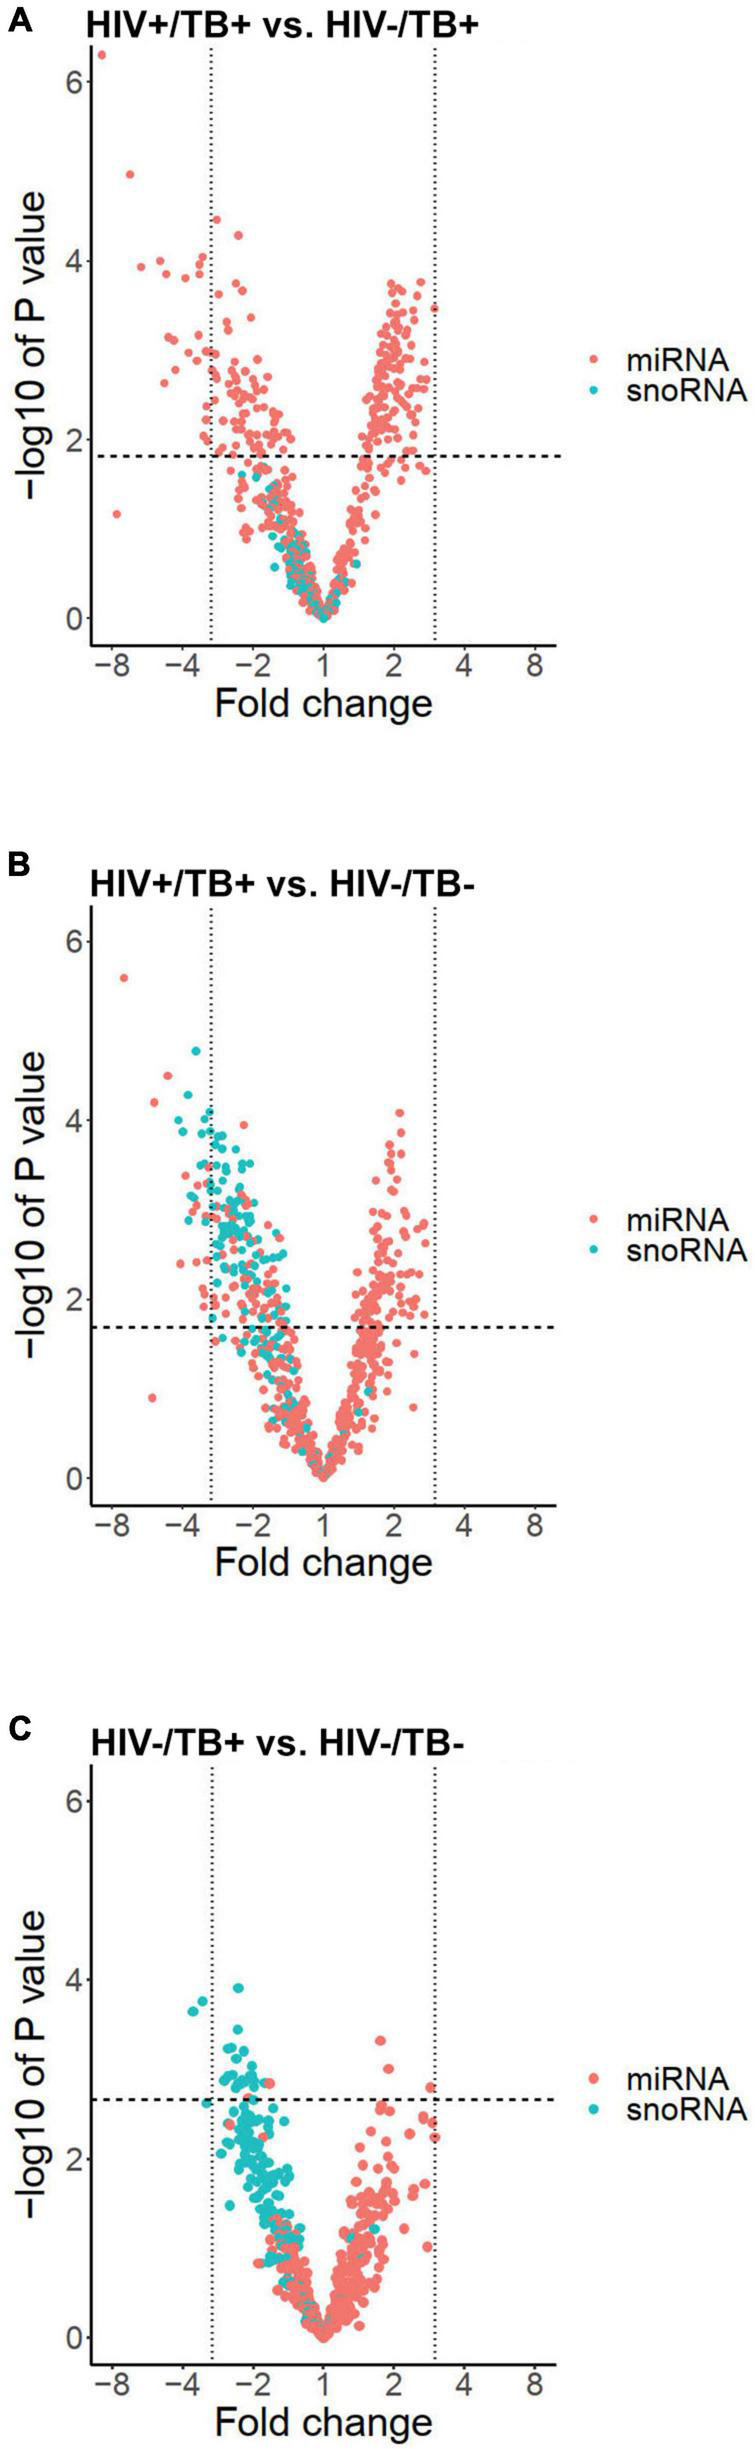
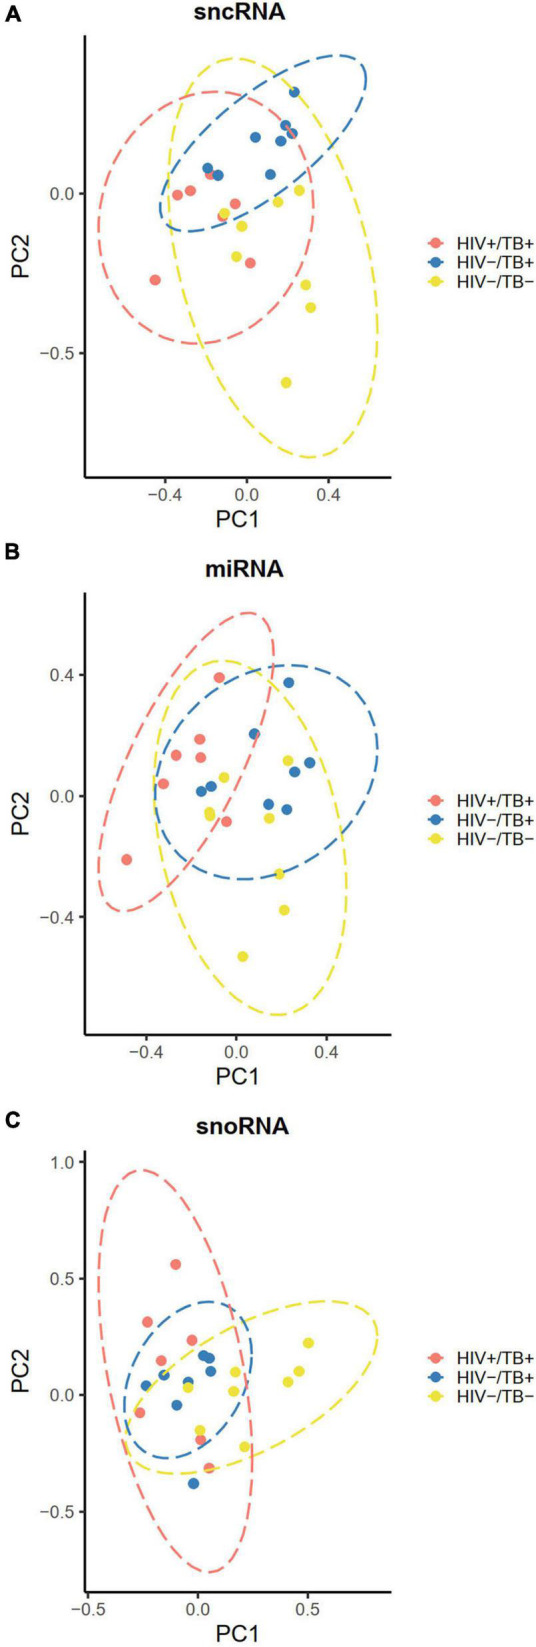
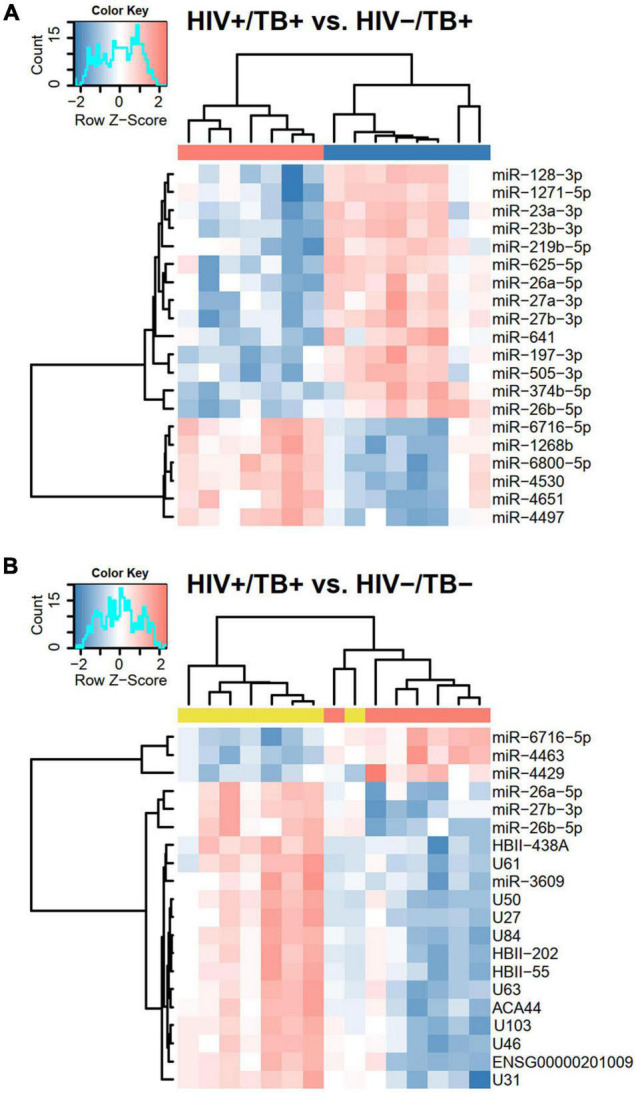
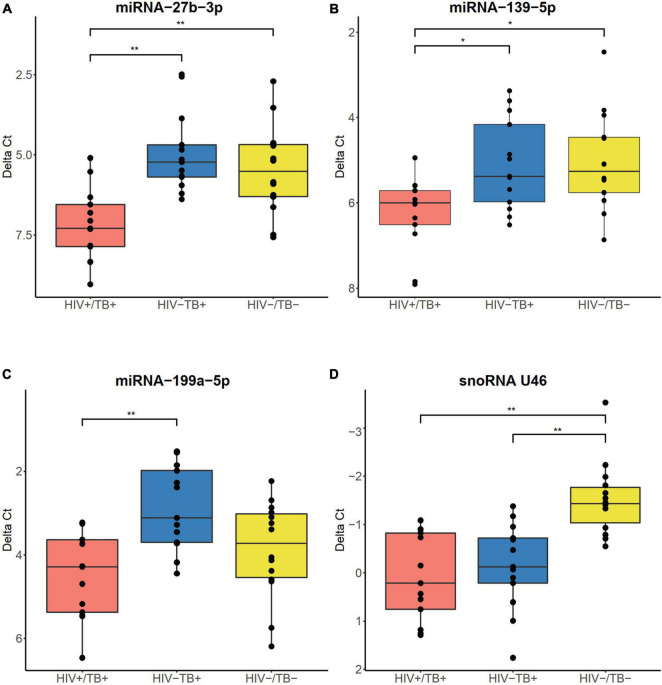
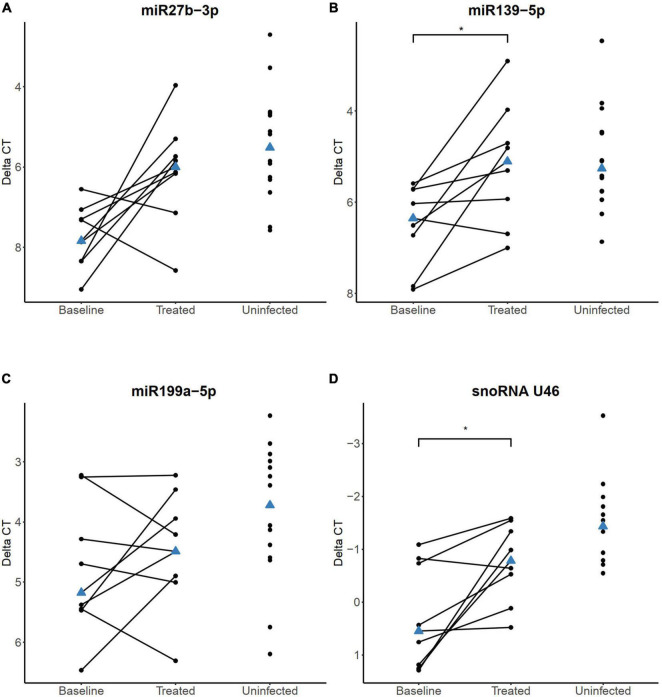
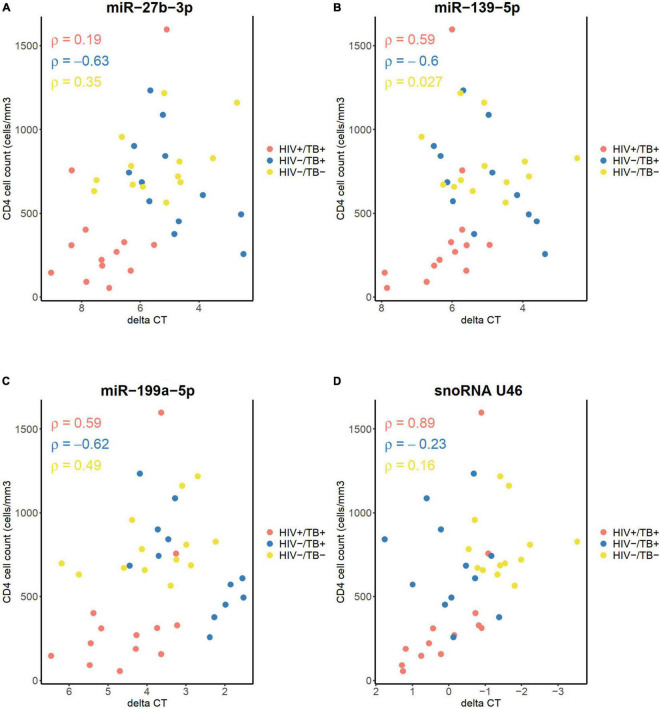
HIV infection affects the course of tuberculosis (TB), and HIV and Mycobacterium tuberculosis (Mtb) synergize in disease progression through complex immunological interplay. To gain further understanding of these mechanisms, we compared the microRNA (miRNA) and small nucleolar RNA (snoRNA) expression patterns in whole blood of individuals with active TB, with and without HIV coinfection (HIV+/TB+ and HIV-/TB+), and HIV and TB-negative individuals (HIV-/TB-). We found that 218 miRNAs were differentially expressed between HIV+/TB+ and HIV-/TB+, while no statistically significant difference in snoRNA expression was observed between these groups. In contrast, both miRNA (n = 179) and snoRNA (n = 103) expression patterns were significantly altered in HIV+/TB+ individuals compared to those of the HIV-/TB- controls. Of note, 26 of these snoRNAs were also significantly altered between the HIV-/TB+ and HIV-/TB- groups. Normalization toward the miRNA and snoRNA expression patterns of the HIV-/TB- control group was noted during anti-TB and antiretroviral treatment in HIV+/TB+ participants. In summary, these results show that HIV coinfection influences miRNA expression in active TB. In contrast, snoRNA expression patterns differ between individuals with and without active TB, independently of HIV coinfection status. Moreover, in coinfected individuals, therapy-induced control of HIV replication and clearance of Mtb appears to normalize the expression of some small non-coding RNA (sncRNA). These findings suggest that dysregulation of miRNA is a mechanism by which HIV may modify immunity against TB, while active TB alters snoRNA expression. Improved understanding of how regulation of sncRNA expression influences the disease course in coinfected individuals may have implications for diagnostics, risk stratification, and host-directed therapy. Here, we propose a novel mechanism by which HIV alters the immune response to TB.

Keywords: HIV; anti-retroviral therapy; anti-tuberculosis treatment; microRNA; small non-coding RNA; small nucleolar RNA; tuberculosis.


Conflict of interest statement

The authors declare that the research was conducted in the absence of any commercial or financial relationships that could be construed as a potential conflict of interest.

Figures

FIGURE 1
FIGURE 1
Venn diagrams showing differentially expressed (FDR < 0.05) (A) small non-coding RNAs (sncRNAs), (B) microRNAs (miRNAs), and (C) small nucleolar RNAs (snoRNAs) in the HIV+/TB+, HIV-/TB+ and HIV-/TB- groups.
FIGURE 2
FIGURE 2
Volcano plots illustrating expression profiles of miRNAs (red dots) and snoRNAs (blue dots) according to fold change on a logarithmic scale (x-axis) and -log of P-value (y-axis) in the groups (A) HIV+/TB+ vs. HIV-/TB+, (B) HIV+/TB+ vs. HIV-/ TB-, and (C) HIV-/TB- and HIV-/TB+. Vertical black lines indicate a fold change of three. Horizontal line indicates largest P-value generating FDR < 0.05.
FIGURE 3
FIGURE 3
Principal component plots illustrating clustering of the participants according to their infection status HIV+/TB+ (red), HIV-/TB+ (blue) and HIV-/TB- (yellow) based on (A) all sncRNAs (B) miRNAs (C) snoRNAs. Data ellipses calculated based on the t-statistic with 95% confidence intervals. Microarray data were median centered before analysis.
FIGURE 4
FIGURE 4
Heatmaps based on hierarchical clustering analyses including (A) HIV+/TB+ and HIV-/TB+ and (B) HIV-/TB- and HIV+/TB+ subjects and the 20 sncRNAs that generated the smallest P-values in Limma analysis from the respective comparisons. Microarray data were median centered before the analysis. Pearson’s correlation was used as a distance matrix. The red and blue colors indicate upregulated and downregulated sncRNAs, respectively. Color codes at the top represent infection status, HIV+/TB+ (red), HIV-/TB+ (blue), and HIV-/TB- (yellow). Probe HBII-438A also assigned to HBII-438B, probe U84 to ENSG00000263442/ENSG00000264591/ENSG00000265325/ENSG00000265607/ENSG00000266646/ENSG00000266755, probe ACA44 to ENSG00000252840, and probe U103 to U103B.
FIGURE 5
FIGURE 5
Boxplots illustrating expression of (A) miR-27b-3p, (B) miR-139-5p, (C) miR-199a-5p, and (D) snoRNA U46, validated by RT-qPCR. Boxes show median and interquartile range, and whiskers extend to the largest values within 1.5 interquartile range from the quartile. Infection status is represented by colors, HIV+/TB+ (red), HIV-/TB+ (blue), and HIV-/TB- (yellow). Symbols on top indicate: * adjusted P < 0.05 and ** adjusted P < 0.01. P-values from the Mann–Whitney U-test with Holm-Bonferroni correction.
FIGURE 6
FIGURE 6
sncRNA expression levels quantified by RT-qPCR in HIV+/TB+ study participants before and after the initiation of anti-tuberculosis treatment and antiretroviral treatment (A) miR-27, (B) miR-139-5p, (C) miR-199a-5p, and (D) snoRNA U46. Paired samples of participants longitudinally followed before and during treatment are connected with a line. HIV-/TB- control group is included in all plots for comparison. The blue triangle indicates the median value. *Adjusted P < 0.05. P-values were calculated from paired samples Wilcoxon test with Holm-Bonferroni correction.
FIGURE 7
FIGURE 7
Correlation between CD4+ cell count before treatment, and the levels of (A) miR-27b-3p, (B) miR-139-5p, (C) miR-199a-5p, and (D) snoRNA U46, measured by qPCR. Infection status is represented by color, HIV+/TB+ (red), HIV-/TB+ (blue) and HIV-/TB- (yellow). Spearman’s rho is indicated for each group in the matching color.

References

    1. Ai J. W., Ruan Q. L., Liu Q. H., Zhang W. H. (2016). Updates on the risk factors for latent tuberculosis reactivation and their managements. Emerg. Microbes Infect. 5:e10. 10.1038/emi.2016.10 - DOI - PMC - PubMed
    1. Alles J., Fehlmann T., Fischer U., Backes C., Galata V., Minet M., et al. (2019). An estimate of the total number of true human miRNAs. Nucleic Acids Res. 47 3353–3364. 10.1093/nar/gkz097 - DOI - PMC - PubMed
    1. Auld S. C., Staitieh B. S. (2020). HIV and the tuberculosis “set point”: How HIV impairs alveolar macrophage responses to tuberculosis and sets the stage for progressive disease. Retrovirology 17:32. 10.1186/s12977-020-00540-2 - DOI - PMC - PubMed
    1. Balcha T. T., Sturegård E., Winqvist N., Skogmar S., Reepalu A., Jemal Z. H., et al. (2014). Intensified tuberculosis case-finding in HIV-positive adults managed at Ethiopian health centers: Diagnostic yield of xpert MTB/RIF compared with smear microscopy and liquid culture. PLoS One 9:e85478. 10.1371/journal.pone.0085478 - DOI - PMC - PubMed
    1. Busk P. K. (2014). A tool for design of primers for microRNA-specific quantitative RT-qPCR. BMC Bioinform. 15:29. 10.1186/1471-2105-15-29 - DOI - PMC - PubMed

LinkOut - more resources