. 2022 Feb 28:10:810980.
doi: 10.3389/fcell.2022.810980. eCollection 2022.

The Signature of Moderate Perinatal Hypoxia on Cortical Organization and Behavior: Altered PNN-Parvalbumin Interneuron Connectivity of the Cingulate Circuitries

Affiliations

The Signature of Moderate Perinatal Hypoxia on Cortical Organization and Behavior: Altered PNN-Parvalbumin Interneuron Connectivity of the Cingulate Circuitries

Sara Trnski et al. Front Cell Dev Biol. .

Abstract

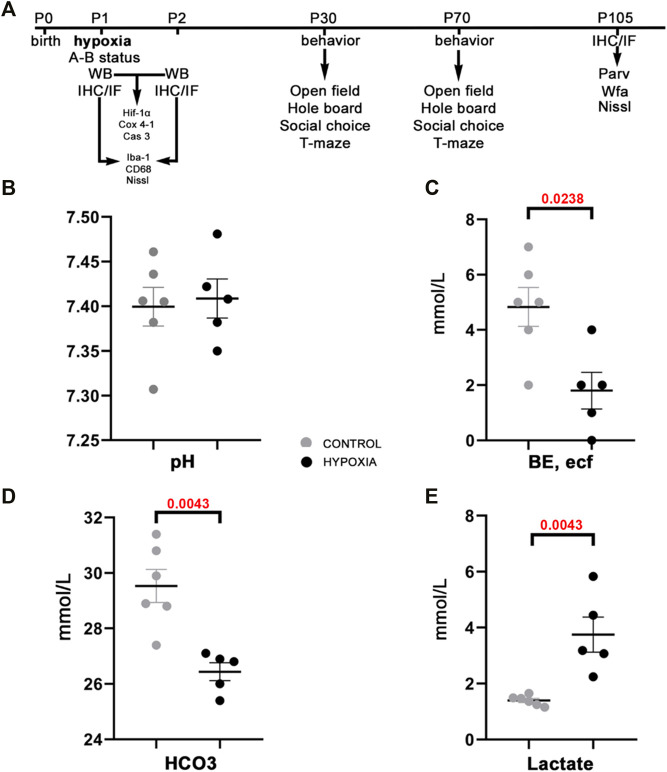
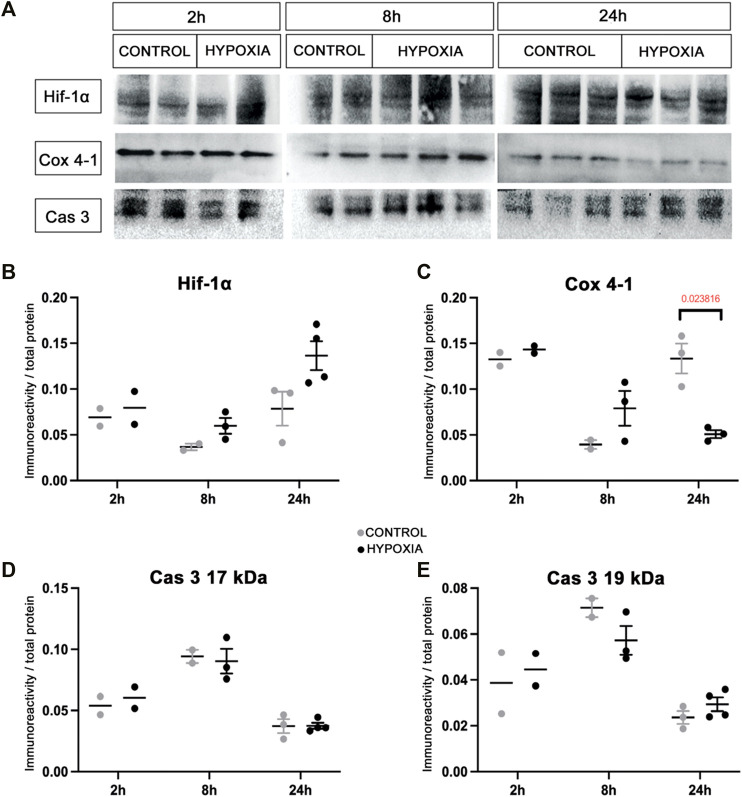
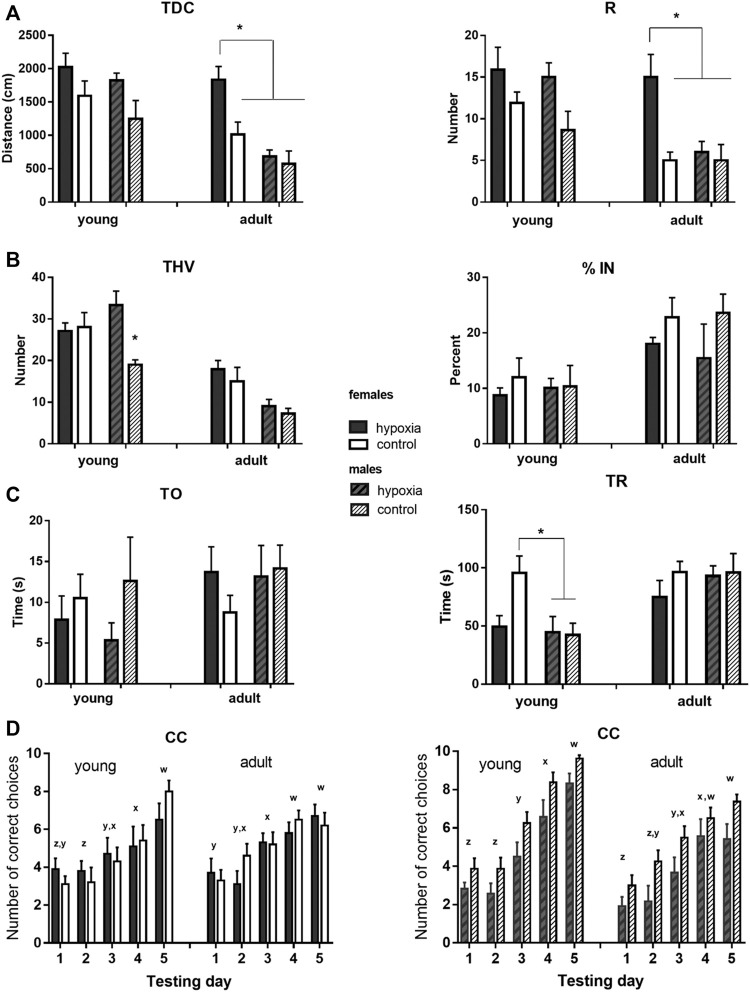
This study was designed in a rat model to determine the hallmarks of possible permanent behavioral and structural brain alterations after a single moderate hypoxic insult. Eighty-two Wistar Han (RccHan: WIST) rats were randomly subjected to hypoxia (pO2 73 mmHg/2 h) or normoxia at the first postnatal day. The substantially increased blood lactate, a significantly decreased cytochrome-C-oxygenase expression in the brain, and depleted subventricular zone suggested a high vulnerability of subset of cell populations to oxidative stress and consequent tissue response even after a single, moderate, hypoxic event. The results of behavioral tests (open-field, hole-board, social-choice, and T-maze) applied at the 30-45th and 70-85th postnatal days revealed significant hyperactivity and a slower pace of learning in rats subjected to perinatal hypoxia. At 3.5 months after hypoxic insult, the histochemical examination demonstrated a significantly increased number of specific extracellular matrix-perineuronal nets and increased parvalbumin expression in a subpopulation of interneurons in the medial and retrosplenial cingulate cortex of these animals. Conclusively, moderate perinatal hypoxia in rats causes a long-lasting reorganization of the connectivity in the cingulate cortex and consequent alterations of related behavioral and cognitive abilities. This non-invasive hypoxia model in the rat successfully and complementarily models the moderate perinatal hypoxic injury in fetuses and prematurely born human babies and may enhance future research into new diagnostic and therapeutic strategies for perinatal medicine.

Keywords: cortical development; hyperactivity behaviors; learning disabilities; oxidative stress; plasticity.


Conflict of interest statement

The authors declare that the research was conducted in the absence of any commercial or financial relationships that could be construed as a potential conflict of interest.

Figures

FIGURE 1
FIGURE 1
The study design and acid-base status of the animals indicate sufficient compensatory buffers capacity, ensuring acid-base homeostasis at this design of moderate perinatal hypoxia in rat. (A) A presentation of the study design by timeline with the time points chosen for data acquisition by various tests, staining’s of brain tissue sections, and subsequent qualitative and quantitative analysis of the behavior and brain structures. Treated and control animal distribution per each experiment is presented in Supplementary Table S1. The treated rats were subjected to hypoxia (during 2 h) at P1. Immediately after, some were sacrificed to measure different parameters of A-B status. Other animals were sacrificed later at 8 h, and 24 h after hypoxia for brain samples, on which WB, IF, IHC were employed with different antibodies. The antibodies used in the study are listed in Table 1. The remainder of the animals were tested at two different age points: starting at P30 and P70 during five subsequent days. The animals were tested with four behavioral tests (open filed, hole board, social choice, T-maze). These animals were sacrificed at P105 to isolate the brain tissue for differential staining’s and further data acquisition. (B–E) The values of different blood parameters showing acid-base status measured immediately after hypoxia. (B) The pH (hydrogen potential) values speak in favor of sufficient compensatory capacity that ameliorates electrolyte imbalance in the rat neonates. (C) BE, ecf (base excess in the extracellular fluid) show significantly lower values in the hypoxic animals due to depletion of base buffers for compensation of the metabolic acidosis. (D,E) The HCO3 (bicarbonate) and lactate concentrations in the blood show statistically significant differences between hypoxia-treated and control animals, proving shift from aerobic to anaerobic metabolic condition in the tissue as a consequence of hypoxia. All results are shown as mean ± standard error of the mean (SEM). P-postnatal day; A-B—acid-base status; WB-Western blot; IHC/IF—immunohistochemistry and/or immunofluorescence; Hif-1α—hypoxia-inducible factor 1α; Cox 4-1—cytochrome c oxidase subunit 4 isoform 1; Cas 3—caspase 3; Iba-1—ionized-calcium-binding-adaptor-molecule-1; CD68—class D scavenger receptor 68; Nissl (modification of cresyl-violet) staining; Parv—parvalbumin; Wfa—Wisteria floribunda agglutinin.
FIGURE 2
FIGURE 2
Expression of the hypoxia-related proteins in the brain tissue of control and hypoxia-treated animals confirms moderate hypoxic lesion. (A) Representative Western blots of hypoxia-inducible factor-1 alpha (Hif-1α), cytochrome C oxidase subunit-4 isoform-1 (Cox 4-1), and cleaved caspase 3 (Cas 3) from brain samples obtained at 2, 8, and 24 h post hypoxia. The results of quantification of protein signal intensity is shown in correspondence to total protein amount (in Suplementary material suppl. Figure 1). (B) Notable changes in expression of Hif-1α (control 0.078 ± 0.011, hypoxia 0.136 ± 0.008), and (C) Cox 4-1 (control 0.133 ± 0.009, hypoxia 0.051 ± 0.003, p = 0.024, Student’s t-test) were measured in the samples obtained 24 h after the hypoxia. There is no difference between the groups at earlier time points. (D,E) There is no observed difference in Cas 3 expression in the brain tissue between the control and hypoxia group at any time point.
FIGURE 3
FIGURE 3
The coronal sections of the subventricular zone (SVZ) and microglial cell morphology confirming the affected proliferation pool and limited microglial cell activation after moderate perinatal hypoxia. (A,A’,C,C’) Show a distinct decrease of cell density in the proliferative SVZ in hypoxia-treated animals compared to controls, at 8 h (A,A’) and more pronounced at 24 h (C,C’) after hypoxia. (B,B’) The ionized-calcium-binding-adaptor-molecule-1 (Iba-1) staining 8 h after hypoxia shows less numerous but more ramified microglial cells in SVZ in hypoxia-treated animals. (D,D’) The class D scavenger receptor 68 (CD68) staining 24 h after hypoxia reveals no severe macrophage reactivity in hypoxia-treated animals compared to controls. (E–G’) Display a change in morphology of Iba-1-immunoreactive microglia in the cingulate cortex and SVZ, but not in the corpus callosum. Control animals’ cingulate cortex and SVZ contained intermediate microglia (E,G), while in hypoxia-treated animals, microglia developed a ramified morphology [(E’,G’) arrows], suggesting their precocious maturation. (F,F’) Within the corpus callosum, these cells have the same amoeboid morphology in both groups of animals. The actual image magnification for (A,A’,C,C’) is shown with the scale bar in (C’), presenting 100 µm, for (B,B’,D,D’) is shown in (D) presenting 50 µm, and for (E–G’) scale bar is in (G’) presenting 25 µm.
FIGURE 4
FIGURE 4
Results of the behavioral testing in young and mature animals display altered behavior and cognition in juvenile and adult rats. The rats were exposed to a battery of behavioral tests at juvenile (adolescent) (P33-P41) and adult (P83-P91) ages, to examine whether any behavioral and cognitive differences were still present or had newly appeared in adulthood. (A) Locomotor activity was measured as the total distance covered (TDC) and the number of rearing times (R) in an open field. Two-way ANOVA revealed: for TDC, a significant influence of hypoxia in juveniles and of hypoxia, sex, and hypoxia-sex interaction in the adults; for R, there was a significant influence of hypoxia in juveniles and a significant influence of hypoxia and sex, with the indicative influence of hypoxia-sex interaction in the adults. (B) Exploratory behavior was measured as the total number of visited holes (THV), and anxiety-like behavior was measured as the percentage of visited inner holes (% IN) in a hole-board. Two-way ANOVA revealed: for THV, a significant influence of hypoxia and hypoxia-sex interaction in juveniles and a significant impact of sex in adults; for % IN, no significant influences. (C) Social behavior was measured as time spent exploring an object (TO) and time spent exploring a rat (TR) in a social choice apparatus. Two-way ANOVA revealed for TO, no significant influences; for TR, a significant influence of sex, and hypoxia x sex interaction, only in juveniles. (D) Learning abilities were measured in a T-maze separately for males and females, and as the number of correct choices (CC) in sessions of ten trials during five consecutive days. Repeated measure two-way ANOVA revealed: for males, a significant influence of hypoxia and time, in juveniles, and an indicative influence of hypoxia and a significant effect of time, in adults; for females, the analysis showed a significant influence of time, in both juveniles and adults. Results are shown as mean ± standard error of the mean (SEM); Tukey’s honestly significance post-hoc test was performed after establishing a significant/indicative hypoxia-sex interaction influence and values that significantly differ are marked with an *(A–C). Letters x-z are indicators of significant differences (different letters) or the lack of significant difference (same letters) in the mean number of correct choices among different testing days as revealed by Tukey’s honestly significance post-hoc test (D).
FIGURE 5
FIGURE 5
Coronal sections of the mature cingulate cortex at the age of 3.5 months indicate a downregulation of the diffuse Wfa-positive ECM and parvalbumin-positive neuropil, and concomitant upregulation of PNN expression around some neurons and parvalbumin-immunoreactivity of the interneurons’ soma in animals subjected to perinatal hypoxia. (a) Coronal section through cerebrum at the bregma level −1.56 mm display medial cingulate cortex area (MCC). The black rectangle frame indicates the part of the cortex presented below with higher magnification. (b) Schematic presentation of the position of ACC, MCC, and RSC regarding bregma scale and the position from which below presented sections are isolated. (c) Coronal section through cerebrum at the level of bregma −2.76 mm that displays retrosplenial cingulate cortex area (RSC). The black rectangle frame indicates the part of the cortex presented below with the higher magnification. (A–D) Coronal sections stained by cresylic-violet (Nissl modification) showing preserved gross morphology and proper cortical layering in the MCC and RSC in control and hypoxia-treated animals. (A’–D’) Coronal sections histochemically stained with Wisteria floribunda agglutinin (Wfa) show difference in qualitative characteristics of extracellular matrix where Wfa-positive matrix is diffusely present in all cortical layers and in the form of PNN around some neurons of predominantly cortical layers III and V. In contrast, in the hypoxia-treated animals the Wfa-positive extracellular matrix is localized almost exclusively in the form of PNN. The PNN are most frequently around interneurons of layers II/III and even more in layer V, especially prominent in RSC, in hypoxia treated animals compared to controls. (A”–D”) Coronal sections through MCC and RSC stained with parvalbumin-immunohistochemistry (Parv) indicate downregulated diffuse parvalbumin expression in the cortical neuropil of animals subjected to perinatal hypoxia. However, interneurons’ parvalbumin-positive soma were pronounced, especially in cortical layers II/III and V of these animals. Contrary, Parv-positive cingulate neuropil is pronounced in cortical layers II/III and V, but with less pronounced paralbumin expressing interneurons in controls. The actual image magnification from (A–D”), is shown with the scale bar in (D”) presenting 200 µm.
FIGURE 6
FIGURE 6
The qualitative and quantitative differences in perineuronal nets (PNN) and parvalbumin-positive interneurons (PV) between control and hypoxia-treated animals at the age of 3.5 months confirm a permanent structural change in the connectivity of the cingulate cortex. (a–b’,A–B’) High magnification of cortical layers III-Va of MCC (a,b), cortical layers III-Va of RSC (a’,b’), both stained by Wfa, and quantitative findings for the number of PNN in all cortical layers of MCC (A,B) and RSC (A’,B’). The PNN are more numerous in hypoxia-treated animals in both cingulate areas. The Wfa staining of PNN is denser and thicker around the soma and proximal portion of the dendrites after perinatal hypoxia (b,b’) compared to controls (a,a’). (A–B’) Two-way ANOVA revealed a significant influence of hypoxia on the number of PNN/mm2: (A) in the MCC (Hypoxia = F (1.12) = 72.46; p < 0.0001; Sex = F (1.12) = 3.641; p = 0.0806; Interaction = F (1.12) = 0.1863; p = 0.6736), and (A’) in the RSC area (Hypoxia = F (1.9) = 10.11; p = 0.0112; Sex = F (1.9) = 0.01477; p = 0.9059; Interaction = F (1.9) = 0.7814; p = 0.3997). The hypoxia-treated animals of both sexes had a significantly higher number of PNN in the MCC area (B), and the same, but insignificant, trend was observed in RSC area (B’). (c–d’) High magnification of layers III-Va of MCC (c,c’), cortical layers III-Va of RSC (d,d’) stained by parvalbumin, and quantitative findings for the PV in all cortical layers of MCC (C,D) and RSC (C’,D’). The interneurons soma is strongly parvalbumin - positively stained as well as the proximal portion of the dendrites in the animals subjected to perinatal hypoxia (d,d’) compared to controls (c,c’). Two-way ANOVA revealed a significant influence of hypoxia on the number of PV per mm2: (C) in the MCC (Hypoxia = F (1.12) = 8.770; p = 0.0119; Sex = F (1.12) = 0.01956; p = 0.8911; Interaction = F (1.12) = 0.1141; p = 0.7413), and (C’) in the RSC area (Hypoxia = F (1.12) = 17.84; p = 0.0012; Sex = F (1.12) = 0.2751; p = 0.6095; Interaction = F (1.12) = 0.05901; p = 0.8122). The hypoxia-treated animals of both sexes had a significantly higher number of PV interneurons in the RSC area (D’), while in the MCC area (D), the difference is only indicative. Data are shown as mean ± standard error of the mean (SEM) (error bars). (E) A representative PNN (Wfa-positive, green) is visible around the cell body of PV (Parv, red) as a thin coat. The PV of the control animal also has larger soma when compared with PV in hypoxia-treated animal. (F) Representative PNNs (Wfa-positive, green) in the brain section of hypoxia-treated animal, show thicker and denser ECM-coat around the cell soma, surrounding the proximal portion of the dendrites, and often the initial axon segment [(F); arrow]. The PV stained with parvalbumin (Parv, red) reveals the smaller neurons soma in the cingulate cortex of hypoxia-treated animal compared to control. The actual image magnification for (a–d’) is shown with the scale bar in (d’), presenting 50 µm, for (E,F) is shown with the scale bar in (F), presenting 25 µm.

Similar articles

Cited by

References

    1. Alexander M., Garbus H., Smith A. L., Rosenkrantz T. S., Fitch R. H. (2014). Behavioral and Histological Outcomes Following Neonatal HI Injury in a Preterm (P3) and Term (P7) Rodent Model. Behav. Brain Res. 259, 85–96. 10.1016/j.bbr.2013.10.038 - DOI - PMC - PubMed
    1. Ball G., Seidlitz J., O’Muircheartaigh J., Dimitrova R., Fenchel D., Makropoulos A., et al. (2020). Cortical Morphology at Birth Reflects Spatiotemporal Patterns of Gene Expression in the Fetal Human Brain. Plos Biol. 18, e3000976. 10.1371/journal.pbio.3000976 - DOI - PMC - PubMed
    1. Banerjee S. B., Gutzeit V. A., Baman J., Aoued H. S., Doshi N. K., Liu R. C., et al. (2017). Perineuronal Nets in the Adult Sensory Cortex Are Necessary for Fear Learning. Neuron 95, 169–179. e3. 10.1016/j.neuron.2017.06.007 - DOI - PMC - PubMed
    1. Batalle D., Hughes E. J., Zhang H., Tournier J.-D., Tusor N., Aljabar P., et al. (2017). Early Development of Structural Networks and the Impact of Prematurity on Brain Connectivity. Neuroimage 149, 379–392. 10.1016/j.neuroimage.2017.01.065 - DOI - PMC - PubMed
    1. Bertocchi I., Mele P., Ferrero G., Oberto A., Carulli D., Eva C. (2021). NPY-Y1 Receptor Signaling Controls Spatial Learning and Perineuronal Net Expression. Neuropharmacology 184, 108425. 10.1016/j.neuropharm.2020.108425 - DOI - PubMed

LinkOut - more resources