. 2022 Mar 11:13:20417314221084096.
doi: 10.1177/20417314221084096. eCollection 2022 Jan-Dec.

Strategy for improving cell-mediated vascularized soft tissue formation in a hydrogen peroxide-triggered chemically-crosslinked hydrogel

Affiliations

Strategy for improving cell-mediated vascularized soft tissue formation in a hydrogen peroxide-triggered chemically-crosslinked hydrogel

Shih-Yen Wei et al. J Tissue Eng. .

Abstract

The physically-crosslinked collagen hydrogels can provide suitable microenvironments for cell-based functional vascular network formation due to their biodegradability, biocompatibility, and good diffusion properties. However, encapsulation of cells into collagen hydrogels results in extensive contraction and rapid degradation of hydrogels, an effect known from their utilization as a pre-vascularized graft in vivo. Various types of chemically-crosslinked collagen-based hydrogels have been successfully synthesized to decrease volume contraction, retard the degradation rate, and increase mechanical tunability. However, these hydrogels failed to form vascularized tissues with uniformly distributed microvessels in vivo. Here, the enzymatically chemically-crosslinked collagen-Phenolic hydrogel was used as a model to determine and overcome the difficulties in engineering vascular networks. Results showed that a longer duration of inflammation and excessive levels of hydrogen peroxide limited the capability for blood vessel forming cells-mediated vasculature formation in vivo. Lowering the unreacted amount of crosslinkers reduced the densities of infiltrating host myeloid cells by half on days 2-4 after implantation, but blood vessels remained at low density and were mainly located on the edge of the implanted constructs. Co-implantation of a designed spacer with cell-laden hydrogel maintained the structural integrity of the hydrogel and increased the degree of hypoxia in embedded cells. These effects resulted in a two-fold increase in the density of perfused blood vessels in the hydrogel. Results agreed with computer-based simulations. Collectively, our findings suggest that simultaneous reduction of the crosslinker-induced host immune response and increase in hypoxia in hydrogen peroxide-triggered chemically-crosslinked hydrogels can effectively improve the formation of cell-mediated functional vascular networks.

Keywords: Vascular tissue engineering; collagen contraction; enzymatically crosslinked; phenolic-protein hydrogels.


Conflict of interest statement

Declaration of conflicting interests: The author(s) declared no potential conflicts of interest with respect to the research, authorship, and/or publication of this article.

Figures

Figure 1.
Figure 1.
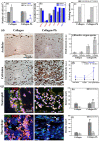
Kinetics of the fibril formation process and resultant microstructures of the collagen and collagen-Ph hydrogel. (a) The sequences of topography images obtained by the tapping mode of AFM, showing fibril formation of collagen and collagen-Ph prepolymers within 30 min. Scan area: 1.5 × 1.5 μm2. During the gelation process, collagen molecules self-assembled into a fibril (white square) along one direction to increase the length and thickness and form a fibrillar network. Collagen-Ph molecules were multi-directionally crosslinked with nearby molecules to form a honeycomb-like network (white square). Comparison of microstructures of collagen and collagen-Ph hydrogels: (b) confocal images and (c) SEM images.
Figure 2.
Figure 2.
Cell-mediated contraction of the cell-laden collagen-based hydrogel. (a) Representative optical macroscopic images of the top view (left column) and side view (right column) of cell-laden collagen and collagen-Ph hydrogels at days 0 and 1 after culture. (b) Quantitative analysis of hydrogel contraction by measuring the area and thickness of the indicated hydrogel during culturing. (c) Spreading area of embedded HUVECs and MSCs (μm2/cell) co-cultured into the indicated hydrogel group. Data are presented as the mean ± SD. *p < 0.05, ***p < 0.001 indicate significant differences from the prior time point in the same hydrogel group (n = 4–5). #p < 0.05 and ##p < 0.01 indicate significant differences from the collagen group at the same time point (n = 4).
Figure 3.
Figure 3.
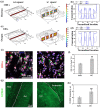
Hydrogel-mediated vascularized soft tissue constructs were formed at a subcutaneous site on day 7 after implantation. (a) Optical macroscopic images of the tissue construct at the subcutaneous site (inset), 3D topography images, and (b) quantitative analysis of average area and thickness of entire constructs were obtained by 3D laser scanning confocal microscopy. (c) Representative cross-sectional H&E images of tissue constructs revealed the distribution of perfused blood vessels (white arrows) in the constructs (inset). Mature perfused human vessels were lined exclusively with hCD31-expressing HUVECs (green) and surrounded by αSMA-expressing MSCs (red). Nuclei (blue) were labeled with DAPI. (d) The extent of vascular network formation was quantified by counting the densities of erythrocyte-filled lumens in H&E images. (e) Representative images of sections stained with hCD31-expressing HUVECs identified by immunohistochemistry. (f) The area distribution of human microvessels was quantified by counting hCD31+ lumens, as a percentage of the total number. #p < 0.05 indicates significant differences from the collagen group at the same time point.
Figure 4.
Figure 4.
Longer-term host inflammatory responses were induced by subcutaneously injecting the hydrogen peroxide-triggered collagen-Ph hydrogel. (a) Numbers of ROS- and hypoxia-positive cells inside hydrogels after 2 and 12 h of culture, as detected by indicator dyes. (b) Human cytokine array analysis of conditioned medium obtained after 1 day of co-culture of HUVECs and MSCs into the collagen and collagen-Ph hydrogels. (c) Quantitative analysis of VEGF, IL-8, and MMP-9 expression in stained sectioned slices of explants on day 2 after implantation. (d) Representative DAB expression and quantitative (e) total intensity and (f) distribution analysis in stained slices sectioned from acellular and cell-laden collagen and collagen-Ph constructs on day 2 after injection. ***p < 0.001 indicates significant differences from the acellular group (n = 3). ##p < 0.01 and ###p < 0.001 indicate significant differences from the collagen group. (g) Representative immunofluorescence staining and quantification analysis of (h) Ly6G+/CD45+ neutrophils and (i) F4/80+/CD45+ macrophages in collagen and collagen-Ph constructs after injection. **p < 0.01 and ***p < 0.001 indicate significant differences from day 2 in the same hydrogel group (n = 4–5). ##p < 0.01 and ###p < 0.001 indicate significant differences from the collagen group at the same time point.
Figure 5.
Figure 5.
Through the stop process in the cell-laden collagen-Ph groups, the densities of infiltrating neutrophils and macrophages induced by the host immune response were significantly reduced on days 2–4 after implantation. (a) Representative DAB expression and (b) quantitative DAB intensity analysis in the non-stop and stop groups from the cell-laden collagen-Ph constructs removed from animals on day 2. Representative immunofluorescence staining for the densities of (c) Ly6G+ (green)/CD45+ (red) neutrophils and (e) F4/80+ (green)/CD45+ (red) macrophages. Nuclei (blue) were labeled with DAPI. Quantification of (d) Ly6G+/CD45+ neutrophils and (f) F4/80+/CD45+ macrophages on days 2 and 4 after implantation. *p < 0.05 and **p < 0.01 indicate significant differences from the prior time point in the same group. #p < 0.05, ##p < 0.01, and ###p < 0.001 indicate significant differences from the non-stop group at the same time point.
Figure 6.
Figure 6.
In the absence of a spacer, cell-laden collagen-Ph structures in the stop or non-stop group did not maintain the volume of the engineered constructs and did not support the formation of vascular networks on day 7 after implantation. (a) Optical macroscopic images of a tissue construct at a subcutaneous site (inset), 3D topography images, and (b) quantitative analysis of the entire explant volume (i.e. area and thickness) were performed by 3D laser scanning confocal microscopy. (c) Representative cross-sectional H&E images of the tissue constructs did not reveal lumens or perfused blood vessels in the structures. (d) Vessel density in the engineered tissue constructs was removed 7 days after implantation. #p < 0.05 indicates significant differences from the non-stop group.
Figure 7.
Figure 7.
Using a spacer, cell-laden collagen-Ph structures in the stop group maintained the volume of the engineered constructs and supported the formation of vascular networks on day 7 after implantation. (a) Optical macroscopic images of the tissue construct at a subcutaneous site (inset), and (b) quantitative analysis of the entire construct volume (i.e. area and thickness) were obtained by 3D laser scanning confocal microscopy. (c) Representative cross-sectional H&E images of the tissue constructs revealed perfused blood vessels (labeled with white arrows) in the structures. (d) The extent of vascular network formation was quantified by counting the densities of erythrocyte-filled lumens. (e) Representative images of mature perfused human vessels were lined exclusively with hCD31-expressing HUVECs (green) and surrounded by αSMA-expressing MSCs (red). Nuclei (blue) are labeled with DAPI. (f) Area of hCD31+ human microvessels, as a percentage of the total area. *p < 0.05 indicates significant differences from the vessel area with 0–50 μm2 in the same group (n = 3). #p < 0.05, ##p < 0.01, and ###p < 0.001 indicate significant differences from the non-stop group.
Figure 8.
Figure 8.
Transport properties of nutrients and oxygen in the cell-laden hydrogel with and without the support of a designed spacer at the subcutaneous site of mice. Dextran (molecular weight: 70 kDa) served as a transport tracer for nutrients. Three-dimensional computational simulation of (a) dextran and (c) oxygen transport properties in cell-laden hydrogels at the indicated time points. The distribution of (b) dextran and (d) oxygen at the center plane of the construct at different time points. Representative fluorescence images and quantitative analysis of the expression of (e and f) HIF-1α and human nuclei (h-nuclei) and (g and h) human-specific VEGF in the with- and without-spacer groups in the collagen-Ph constructs removed from animals on day 2. ##p < 0.01 and ###p < 0.001 indicate significant differences from the w/ spacer group.

Similar articles

Cited by

References

    1. Rioja AY, Tiruvannamalai Annamalai R, Paris S, et al.. Endothelial sprouting and network formation in collagen- and fibrin-based modular microbeads. Acta Biomater 2016; 29: 33–41. - PMC - PubMed
    1. Lu KG, Stultz CM. Insight into the degradation of type-I collagen fibrils by MMP-8. J Mol Biol 2013; 425: 1815–1825. - PubMed
    1. Lauer-Fields JL, Juska D, Fields GB. Matrix metalloproteinases and collagen catabolism. Biopolymers 2002; 66: 19–32. - PubMed
    1. Ferreira AM, Gentile P, Chiono V, et al.. Collagen for bone tissue regeneration. Acta Biomater 2012; 8: 3191–3200. - PubMed
    1. Li Y, Meng H, Liu Y, et al.. Fibrin gel as an injectable biodegradable scaffold and cell carrier for tissue engineering. Sci World J 2015; 2015: 1–10. - PMC - PubMed

LinkOut - more resources