. 2022 Feb 28:16:825735.
doi: 10.3389/fncir.2022.825735. eCollection 2022.

Response Selectivity of the Lateral Posterior Nucleus Axons Projecting to the Mouse Primary Visual Cortex

Affiliations

Response Selectivity of the Lateral Posterior Nucleus Axons Projecting to the Mouse Primary Visual Cortex

Satoru Kondo et al. Front Neural Circuits. .

Abstract

Neurons in the mouse primary visual cortex (V1) exhibit characteristic response selectivity to visual stimuli, such as orientation, direction and spatial frequency selectivity. Since V1 receives thalamic visual inputs from the lateral geniculate nucleus (LGN) and lateral posterior nucleus (LPN), the response selectivity of the V1 neurons could be influenced mostly by these inputs. However, it remains unclear how these two thalamic inputs contribute to the response selectivity of the V1 neurons. In this study, we examined the orientation, direction and spatial frequency selectivity of the LPN axons projecting to V1 and compared their response selectivity with our previous results of the LGN axons in mice. For this purpose, the genetically encoded calcium indicator, GCaMP6s, was locally expressed in the LPN using the adeno-associated virus (AAV) infection method. Visual stimulations were presented, and axonal imaging was conducted in V1 by two-photon calcium imaging in vivo. We found that LPN axons primarily terminate in layers 1 and 5 and, to a lesser extent, in layers 2/3 and 4 of V1, while LGN axons mainly terminate in layer 4 and, to a lesser extent, in layers 1 and 2/3 of V1. LPN axons send highly orientation- and direction-selective inputs to all the examined layers in V1, whereas LGN axons send highly orientation- and direction-selective inputs to layers 1 and 2/3 but low orientation and direction selective inputs to layer 4 in V1. The distribution of preferred orientation and direction was strongly biased toward specific orientations and directions in LPN axons, while weakly biased to cardinal orientations and directions in LGN axons. In spatial frequency tuning, both the LPN and LGN axons send selective inputs to V1. The distribution of preferred spatial frequency was more diverse in the LPN axons than in the LGN axons. In conclusion, LPN inputs to V1 are functionally different from LGN inputs and may have different roles in the orientation, direction and spatial frequency tuning of the V1 neurons.

Keywords: axons; lateral geniculate nucleus; lateral posterior nucleus; mice; primary visual cortex; response selectivity; two-photon calcium imaging.


Conflict of interest statement

The authors declare that the research was conducted in the absence of any commercial or financial relationships that could be construed as a potential conflict of interest.

Figures

FIGURE 1
FIGURE 1
V1 receives inputs from both the LGN and LPN. (A) A retrograde labeling by CTB injection into either V1 or LPN. (B) CTB was injected into V1 (upper), both the LGN and LPN were retrogradely labeled (middle), and the retrogradely labeled neurons were observed (lower, enlargement of the white rectangles in the middle). (C) CTB was injected into the anterior part of the LPN (upper), SC was retrogradely labeled (middle), and the retrogradely labeled neurons were observed (lower, enlargement of the white rectangle in the middle). (D) AAV-tdTomato was injected into SC (upper) and both the aLPN (middle) and pLPN (lower) were innervated by SC neurons. Note that the shell of the LGN also received SC inputs (middle). LGN, lateral geniculate nucleus; LPN, lateral posterior nucleus; aLPN, anterior part of LPN; pLPN, posterior part of LPN; CX, cortex; HIP, hippocampus; CTB, cholera toxin subunit B; V1, primary visual cortex; SGS, upper stratum griseum superficial; SO, stratum opticum; SGI, stratum griseum intermedium; sSC, superficial layers of the superior colliculus; dSC, deep layers of the superior colliculus; APN, anterior pretectal nucleus; IMA, intramedullary thalamic area.
FIGURE 2
FIGURE 2
Axonal projections from the LPN and LGN in V1. (A) An anterograde labeling of the LGN and LPN axons with different fluorescent proteins. (B) A local injection of AAV-GFP in the LGN (upper) and AAV-tdTomato in the LPN (lower). (C) The distribution of the LGN (left) and LPN (middle) axons in V1 of the coronal slice. LGN axons project mainly to the layer 4, while LPN axons project mainly to the layer 1 (right). LPN, lateral posterior nucleus; LGN, lateral geniculate nucleus; V1, primary visual cortex; AAV-GFP, adeno-associated virus-green fluorescent protein.
FIGURE 3
FIGURE 3
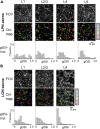
Orientation selectivity of LPN and LGN boutons in V1. (A) FOV images (upper), orientation color map (middle) and distribution of gOSI (lower) of the LPN axons in V1. (B) FOV images (upper) and orientation color map (middle) and distribution of gOSI (lower) of the LGN axons in V1. Only the LGN axons in the layer 4 indicated low orientation selectivity. LPN, lateral posterior nucleus; LGN, lateral geniculate nucleus; V1, primary visual cortex; FOV, field-of-view. *P ≤ 0.05, ***P ≤ 0.001 The data of LGN axons are re-use from the previous publication (Kondo and Ohki, 2016).
FIGURE 4
FIGURE 4
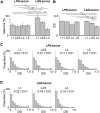
Proportion of orientation-selective axons and distribution of gOSI of LPN and LGN boutons in V1. (A) The proportion of orientation-selective LPN and LGN boutons. The proportion of LGN boutons in the layer 4 was significantly different from that of LGN boutons in the remaining layers as well as that of LPN boutons in all the layers (P ≤ 0.001, Mann–Whitney U-test with Bonferroni correction). The proportion of LGN boutons in the layer 2/3 was significantly different from that of LPN boutons in the layer 1 (p = 0.012, Mann–Whitney U-test with Bonferroni correction) but no significant difference from layers 2/3, 4, and 5 (p = 1, Mann–Whitney U-test with Bonferroni correction). The proportion of LGN boutons in the layer 1 was not significantly different from that of LPN boutons in all the layers (layer 1, p = 0.118; layers 2/3, 4 and 5, p = 1, Mann–Whitney U-test with Bonferroni correction). (B) The mean gOSI of responsive LPN and LGN boutons. gOSI of LGN boutons in the layer 4 was significantly lower than that of LGN boutons in the layers 1, 2/3, LPN axons in the layers 1, 2/3, 4, and 5 (P ≤ 0.001, Mann–Whitney U-test with Bonferroni correction). gOSI of LGN boutons between the layers 1 and 2/3 (p = 1, Mann–Whitney U-test with Bonferroni correction), and gOSI of LPN boutons among different layers were statistically not different (between the layers 1 and 2/3, p = 1; between the layers 1 and 4, p = 0.105; between the layers 1 and 5, p = 0.126; between the layers 2/3 and 4, p = 1; between the layers 2/3 and 5, p = 0.588; between the layers 4 and 5, p = 1, Mann–Whitney U-test with Bonferroni correction). (C) The distribution of gOSI of LPN boutons in the layer 1 (left, n = 562 boutons from six mice, 11 FOVs), layer 2/3 (second from left, n = 313 boutons from six mice, 7 FOVs), layer 4 (second from right, n = 458 boutons from five mice, 8 FOVs), and layer 5 (right, n = 391 boutons from two mice, 9 FOVs). (D) The distribution of gOSI of LGN boutons in the layer 1 (left, n = 2,924 boutons from 37 mice, 123 FOVs), layer 2/3 (second from left, n = 2,818 boutons from 36 mice, 97 FOVs), and layer 4 (second from right, n = 1,722 boutons from 30 mice, 98 FOVs). Arrows (B,C) indicate the threshold (gOSI = 0.33) for sharply orientation-selective boutons. gOSI, global orientation-selective index; LPN, lateral posterior nucleus; LGN, lateral geniculate nucleus; V1, primary visual cortex; FOV, field-of-view. *P ≤ 0.05; ***P ≤ 0.001. The data of LGN axons are re-use from the previous publication (Kondo and Ohki, 2016).
FIGURE 5
FIGURE 5
Distribution of preferred orientations of LPN and LGN boutons in V1. The distribution of preferred orientations of LPN boutons (A) and LGN boutons (B) in each layer of V1. LPN boutons showed skewed bias from horizontal to vertical orientation, whereas LGN boutons showed cardinal bias. LPN, lateral posterior nucleus; LGN, lateral geniculate nucleus; and V1, primary visual cortex. The data of LGN axons are re-use from the previous publication (Kondo and Ohki, 2016).
FIGURE 6
FIGURE 6
Proportion of direction-selective boutons and distribution of DSI of the LPN and LGN boutons in V1. (A) The proportion of direction-selective LPN and LGN boutons. The proportion of the LGN boutons in layer 1 was significantly different from that of the LPN boutons in all the layers (P ≤ 0.001, Mann–Whitney U-test with Bonferroni correction). The proportion of LGN boutons in layer 2/3 was significantly different from that of LPN boutons in layers 2/3 and 5 (layer 2/3, p = 0.032; layer 5, p = 0.045, Mann–Whitney U-test with Bonferroni correction). The proportion of LGN boutons in layer 4 was significantly different from that of LPN boutons in layers 1 and 5 (layer 1, p = 0.023; layer 5, p = 0.031, Mann–Whitney U-test with Bonferroni correction) and LGN boutons in the remaining layers (p ≤ 0.001, Mann–Whitney U-test with Bonferroni correction). (B) The mean DSI of responsive LPN and LGN boutons. DSI of LGN boutons in the layer 4 was significantly lower than that of LGN boutons in the layer 1, LPN boutons in the layers 1, 2/3, 5 (P ≤ 0.001, Mann–Whitney U-test with Bonferroni correction) and LGN boutons in the layer 2/3 and LPN boutons in the layer 4 (LGN layer 2/3, p = 0.015; LPN layer 4, p = 0.041, Mann–Whitney U-test with Bonferroni correction). DSI of LGN boutons between the layers 1 and 2/3 (p = 1, Mann–Whitney U-test with Bonferroni correction) and DSI of LPN boutons among different layers were statistically not different (between layers 1 and 5, p = 0.882; other pairs, p = 1, Mann–Whitney U-test with Bonferroni correction). (C) The distribution of DSI of LPN boutons in the layer 1 (left, n = 187 boutons from six mice, 11 FOVs), layer 2/3 (second from left, n = 93 boutons from six mice, 7 FOVs), layer 4 (second from right, n = 81 boutons from five mice, 8 FOVs), and layer 5 (right, n = 134 boutons from two mice, 9 FOVs). (D) The distribution of DSI of LGN boutons in the layer 1 (left, n = 1,954 boutons from 37 mice, 123 FOVs), layer 2/3 (middle, n = 1,630 boutons from 36 mice, 97 FOVs), and layer 4 (right, n = 931 boutons from 30 mice, 98 FOVs). Arrows show the threshold (DSI = 0.3) for direction-selective boutons. DSI, direction-selective index; LPN, lateral posterior nucleus; LGN, lateral geniculate nucleus; V1, primary visual cortex; FOV, field-of-view. *P ≤ 0.05; ***P ≤ 0.001. The data of LGN axons are re-use from the previous publication (Kondo and Ohki, 2016).
FIGURE 7
FIGURE 7
Distribution of preferred directions of LPN and LGN boutons in V1. The distribution of preferred directions of LPN boutons (A) and LGN boutons (B) in each layer of V1. LPN boutons showed skewed bias from the horizontal to vertical direction, but this bias was less prominent than the orientation bias of LPN boutons. In contrast, LGN boutons showed cardinal bias, which was also less prominent than the orientation bias of LGN boutons. LPN, lateral posterior nucleus; LGN, lateral geniculate nucleus; V1, primary visual cortex. The data of LGN axons are re-use from the previous publication (Kondo and Ohki, 2016).
FIGURE 8
FIGURE 8
High orientation selectivity of mixed LGN and LPN axons in V1. (A) Targeted expression of GCaMP6s to LGN was conducted but expression of GCaMP6s was leaked in LPN. (B) Projections of mixed LGN and LPN axons in V1. Projections can be seen not only in the V1 but also in the HVAs. (C) A FOV image of the mixed LGN and LPN axons in the layer 4 of V1. (D) An orientation color map of the mixed LGN and LPN axons in the layer 4 of V1. Mixed LGN and LPN axons in the layer 4 showed high orientation selectivity. (E) The proportion of orientation-selective mixed LGN and LPN boutons in layers 1 (n = 941 boutons from 5 mice, 5 FOVs), 2/3 (n = 1,106 boutons from 5 mice, 5 FOVs) and 4 (n = 1,042 boutons from 5 mice, 5 FOVs). The proportion of orientation-selective mixed LGN and LPN boutons among different layers were statistically not different (between layers 1 and 4, p = 0.258; other pairs, p = 1, Mann–Whitney U-test with Bonferroni correction). LPN, lateral posterior nucleus; LGN, lateral geniculate nucleus; V1, primary visual cortex; FOV, field-of-view.
FIGURE 9
FIGURE 9
Spatial frequency tuning of LPN and LGN boutons in V1. (A) The proportion of SPF-selective LPN and LGN boutons. The proportion of LPN boutons in the layers 1 and 5 was significantly different from that of LGN boutons in all layers (P ≤ 0.01, Mann–Whitney U-test with Bonferroni correction). The proportion of LPN boutons in layer 4 was significantly different from that of LGN boutons in all layers (layer 1, p = 0.024; layer 2/3, p = 0.032; layer 5, p = 0.047, Mann–Whitney U-test with Bonferroni correction). (B) The mean preferred SPF of responsive LPN and LGN boutons. Mean preferred frequency of LPN boutons of all the layers had significant difference from LGN boutons of all the layers (P ≤ 0.001, Mann–Whitney U-test with Bonferroni correction). Mean preferred frequency among LPN boutons had no significant difference (between layers 1 and 2/3, p = 0.896; other pairs, p = 1, Mann–Whitney U-test with Bonferroni correction). Mean preferred frequency of the layer 4 LGN boutons was significantly different from LGN boutons of layer 1 and V1 neurons in layer 4 (LGN boutons in layer 1, p = 0.037; V1 neurons in layer 4, p = 0.013, Mann–Whitney U-test with Bonferroni correction). (C) The distribution of the preferred SPFs of LPN boutons in the layer 1 (left, n = 893 boutons from six mice, 13 FOVs), layer 2/3 (second from left, n = 659 boutons from six mice, 9 FOVs), layer 4 (second from right, n = 844 boutons from five mice, 8 FOVs), and layer 5 (right, n = 1,000 boutons from three mice, 13 FOVs). (D) The distribution of the preferred SPFs of LGN boutons in the layer 1 (left, n = 3,817 boutons from 20 mice, 42 FOVs), layer 2/3 (second from left, n = 2,669 boutons from 18 mice, 29 FOVs), and layer 4 (second from right, n = 5,576 boutons from 20 mice, 55 FOVs), and V1 neurons in the layer 4 (right, n = 6,210 neurons from 9 mice, 12 volumes). LPN, lateral posterior nucleus; LGN, lateral geniculate nucleus; V1, primary visual cortex; SPF, spatial frequency; FOV, field-of-view; cpd, cycle per degree. *P ≤ 0.05; **P ≤ 0.01; ***P ≤ 0.001. The data of LGN axons and V1 neurons are re-use from the previous publication (Kondo and Ohki, 2016).

Similar articles

References

    1. Adesnik H., Naka A. (2018). Cracking the Function of Layers in the Sensory Cortex. Neuron. 100 1028–1043. 10.1016/j.neuron.2018.10.032 - DOI - PMC - PubMed
    1. Ahmadlou M., Heimel J. A. (2015). Preference for concentric orientations in the mouse superior colliculus. Nat. Commun. 6:6773. 10.1038/ncomms7773 - DOI - PMC - PubMed
    1. Ahmadlou M., Zweifel L. S., Heimel J. A. (2018). Functional modulation of primary visual cortex by the superior colliculus in the mouse. Nat. Commun. 9:3895. 10.1038/s41467-018-06389-6 - DOI - PMC - PubMed
    1. Alitto H. J., Dan Y. (2013). Cell-type-specific modulation of neocortical activity by basal forebrain input. Front. Syst. Neurosci. 6:79. 10.3389/fnsys.2012.00079 - DOI - PMC - PubMed
    1. Allen A. E., Procyk C. A., Howarth M., Walmsley L., Brown T. M. (2016). Visual input to the mouse lateral posterior and posterior thalamic nuclei: photoreceptive origins and retinotopic order. J. Physiol. 594 1911–1929. 10.1113/JP271707 - DOI - PMC - PubMed

Publication types

LinkOut - more resources