

Development and Validation of a Nomogram to Predict Cancer-Specific Survival for Middle-Aged Patients With Early-Stage Hepatocellular Carcinoma
- PMID: 35296046
- PMCID: PMC8918547
- DOI: 10.3389/fpubh.2022.848716
Development and Validation of a Nomogram to Predict Cancer-Specific Survival for Middle-Aged Patients With Early-Stage Hepatocellular Carcinoma
Abstract
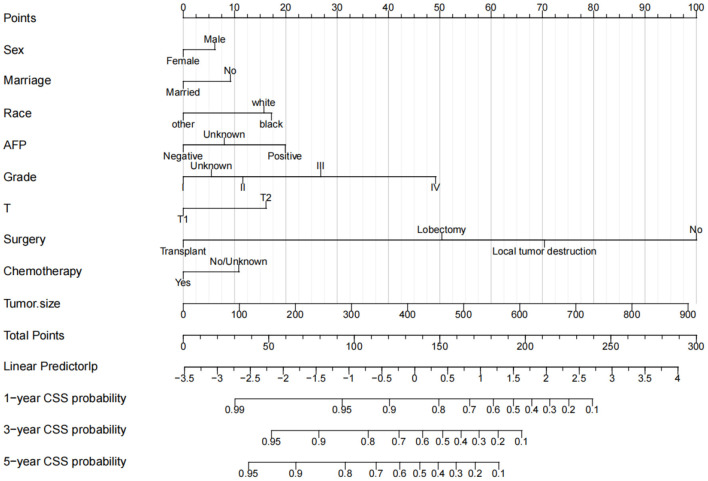
Background: Hepatocellular carcinoma is a common cause of death in middle-aged patients. We aimed to construct a new nomogram to predict cancer-specific survival (CSS) in middle-aged patients with hepatocellular carcinoma at an early stage.
Method: We collected clinicopathological information on early middle-aged patients with hepatocellular carcinoma from the SEER database. Univariate and multivariate Cox regression models were used to screen the independent risk factors for prognosis. These risk factors were used to construct predictions of CSS in patients with hepatocellular carcinoma. Consistency index (C- index), calibration curve, area under the receiver operating curve (AUC) were used. A decision analysis curve (DCA) was used to evaluate the clinical utility of the predictive model.
Results: A total of 6,286 patients with hepatocellular carcinoma in early middle age were enrolled. Univariate and multivariate Cox regression analysis showed that sex, marriage, race, histological tumor grade, T stage, surgery, chemotherapy, AFP, and tumor size were independent risk factors for prognosis. All independent risk factors were included in the nomogram to predict CSS at 1-, 3-, and 5-years in early middle age patients with hepatocellular carcinoma. In the training cohort and validation cohort, the C-index of the prediction model was 0.728 (95%CI: 0.716-0.740) and 0.733 (95%CI: 0.715-0.751), respectively. The calibration curve showed that the predicted value of the prediction model is highly consistent with the observed value. AUC also suggested that the model has good discrimination. DCA suggested that the nomogram had better predictive power than T staging.
Conclusion: We constructed a new nomogram to predict CSS in middle-aged patients with early-stage hepatocellular carcinoma. This prediction model has good accuracy and reliability, which can help patients and doctors to judge prognosis and make clinical decisions.
Keywords: SEER; cancer-specific survival; hepatocellular carcinoma; middle-aged patients; nomogram.
Copyright © 2022 Wen, Tang and Luo.
Conflict of interest statement
The authors declare that the research was conducted in the absence of any commercial or financial relationships that could be construed as a potential conflict of interest.
Figures


References
Publication types
MeSH terms
LinkOut - more resources
Full Text Sources
Medical