. 2022 Feb 28:13:781364.
doi: 10.3389/fimmu.2022.781364. eCollection 2022.

A Specific CD44lo CD25lo Subpopulation of Regulatory T Cells Inhibits Anti-Leukemic Immune Response and Promotes the Progression in a Mouse Model of Chronic Lymphocytic Leukemia

Affiliations

A Specific CD44lo CD25lo Subpopulation of Regulatory T Cells Inhibits Anti-Leukemic Immune Response and Promotes the Progression in a Mouse Model of Chronic Lymphocytic Leukemia

Agnieszka Goral et al. Front Immunol. .

Abstract

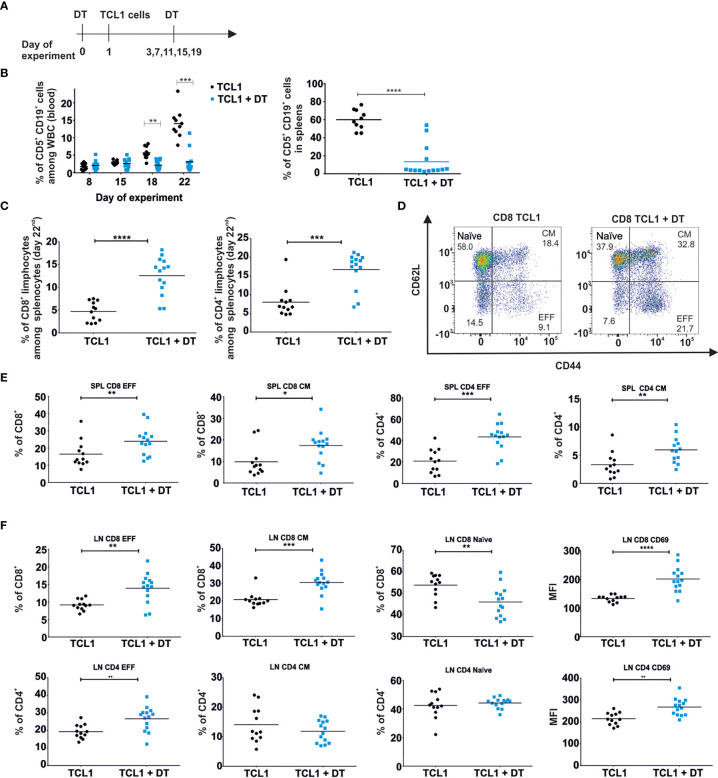
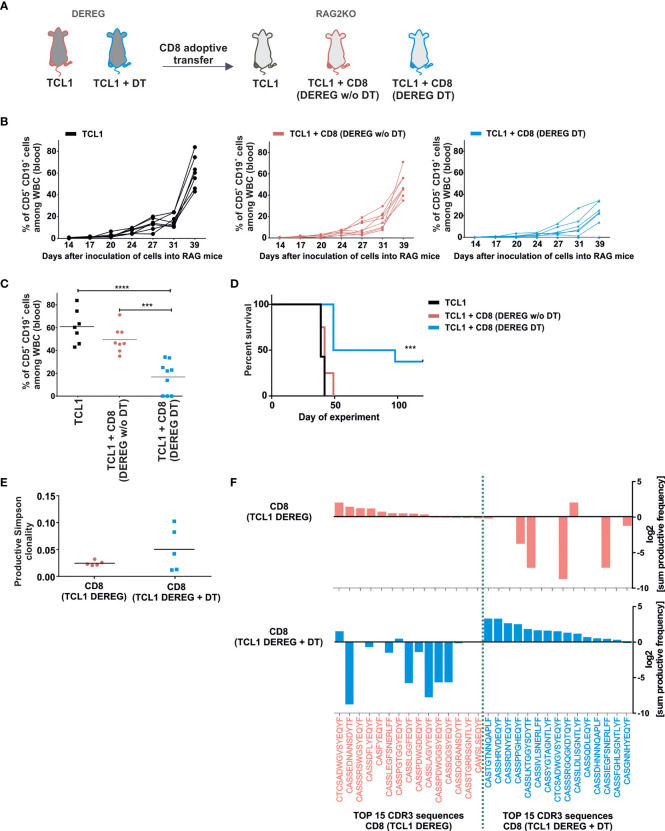
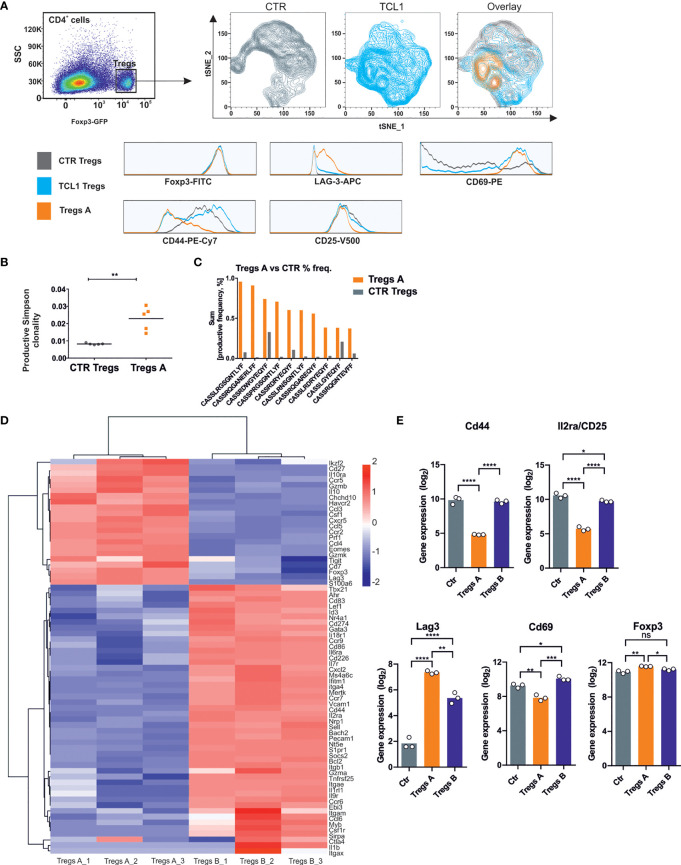
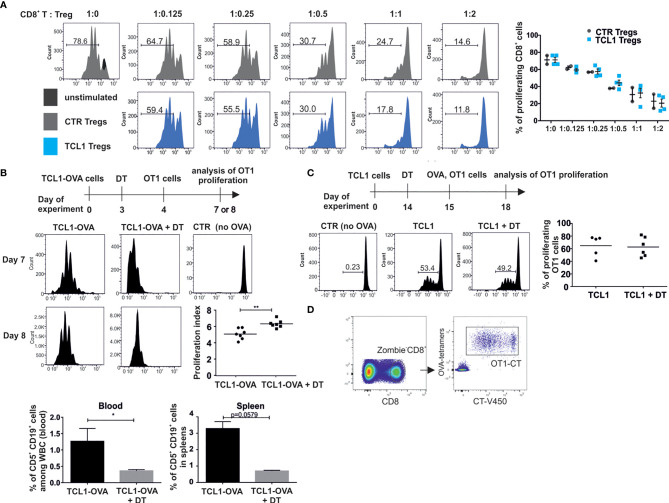
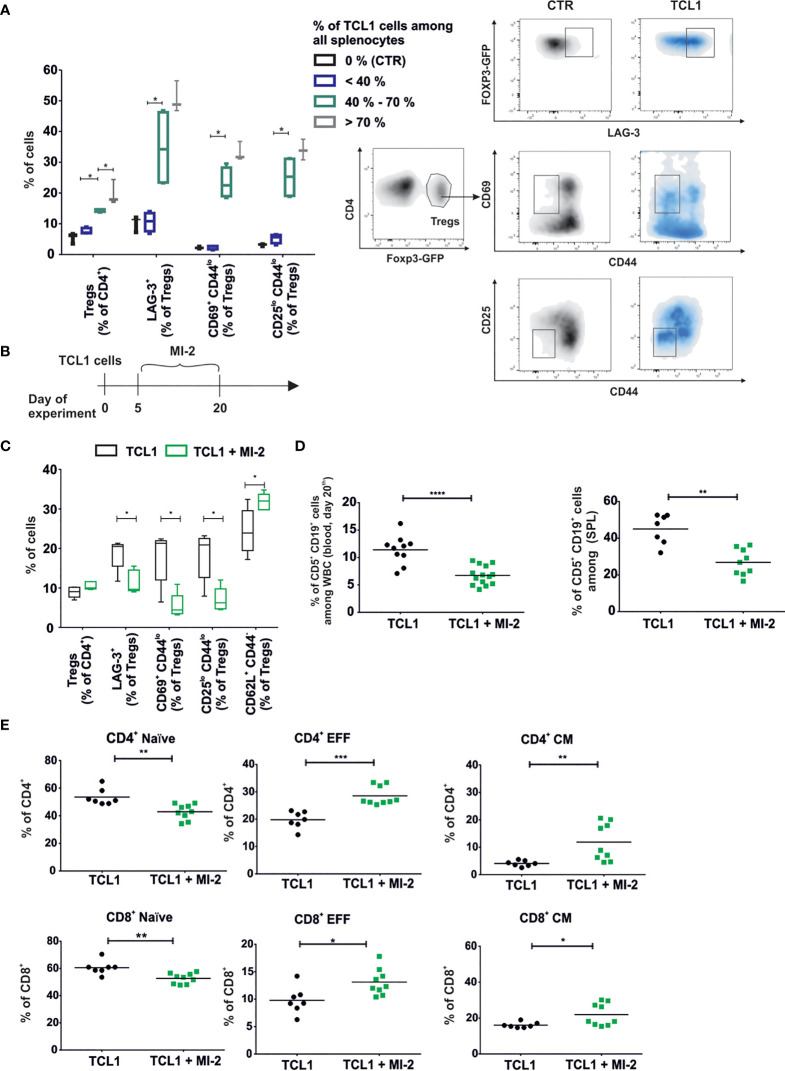
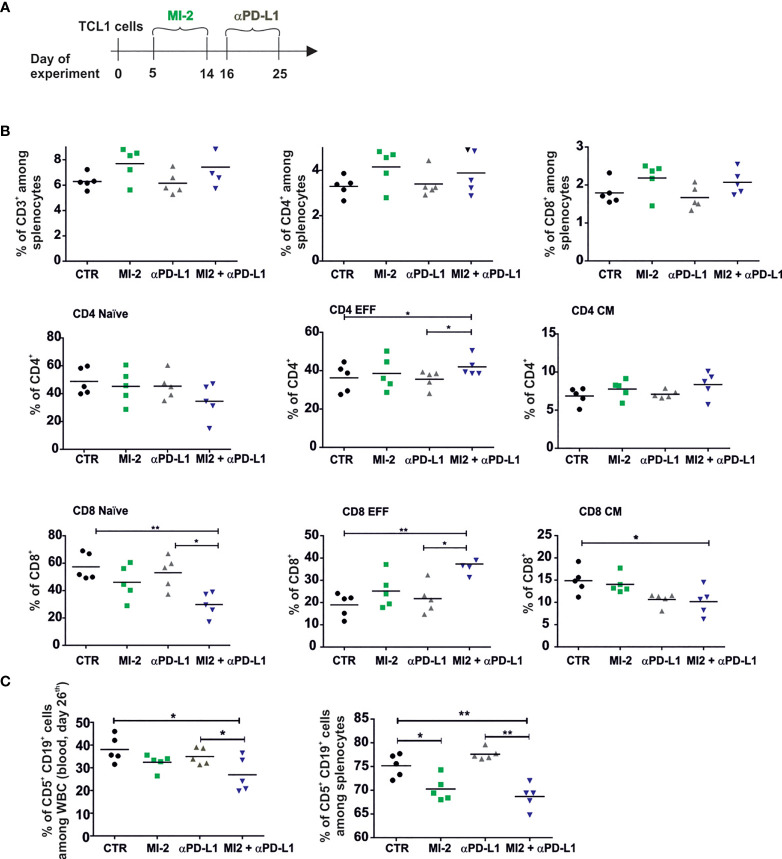
Regulatory T cells (Tregs) are capable of inhibiting the proliferation, activation and function of T cells and play an important role in impeding the immune response to cancer. In chronic lymphocytic leukemia (CLL) a dysfunctional immune response and elevated percentage of effector-like phenotype Tregs have been described. In this study, using the Eµ-TCL1 mouse model of CLL, we evaluated the changes in the Tregs phenotype and their expansion at different stages of leukemia progression. Importantly, we show that Tregs depletion in DEREG mice triggered the expansion of new anti-leukemic cytotoxic T cell clones leading to leukemia eradication. In TCL1 leukemia-bearing mice we identified and characterized a specific Tregs subpopulation, the phenotype of which suggests its role in the formation of an immunosuppressive microenvironment, supportive for leukemia survival and proliferation. This observation was also confirmed by the gene expression profile analysis of these TCL1-specific Tregs. The obtained data on Tregs are consistent with those described so far, however, above all show that the changes in the Tregs phenotype described in CLL result from the formation of a specific, described in this study Tregs subpopulation. In addition, functional tests revealed the ability of Tregs to inhibit T cells that recognize model antigens expressed by leukemic cells. Moreover, inhibition of Tregs with a MALT1 inhibitor provided a therapeutic benefit, both as monotherapy and also when combined with an immune checkpoint inhibitor. Altogether, activation of Tregs appears to be crucial for CLL progression.

Keywords: CLL; Eµ-TCL1; MALT1; TCR repertoire; Tregs; anti-leukemic immune response.


Conflict of interest statement

The authors declare that the research was conducted in the absence of any commercial or financial relationships that could be construed as a potential conflict of interest.

Figures

Figure 1
Figure 1
Depletion of Tregs diminishes the progression of leukemia in DEREG mice and affects the relative frequency of conventional T cell subpopulations. (A) The graph presenting a scheme of the experiment. Tregs were depleted with DT and on the next day mice were injected with TCL1 CD19+ leukemic cells. The depletion of Tregs (DT administration) was repeated every 4 days. (B) The percentage of leukemic cells (CD5+CD19+) among all white blood cells (WBC) assessed by flow cytometry in blood (at indicated time points of the experiment, left) and spleens (day 22nd of experiment, right) of untreated (TCL1) and DT-treated (TCL1+DT) TCL1 leukemia-bearing mice. The graphs represent mean results from two independent experiments. Each dot represents an individual sample (mouse), n = 10-12, Mann-Whitney U test *p ≤ 0.05. (C) The Percentage of CD8+ (left) and CD4+ (right) T cells in spleens of untreated and DT-treated TCL1 leukemia-bearing mice. The graphs present mean results from two independent experiments. Each dot represents an individual sample (mouse), n = 12-14, Mann-Whitney U test ***p ≤ 0.001, ****p < 0.0001. (D–F) The percentage of CD4+ and CD8+ T cells with phenotype of naïve, effector (EFF) and central memory (CM) subpopulations according to the expression of CD44 and CD62L surface markers. Representative dot plots with a gating strategy (D) and the graphs present the results from spleens (SPL) (E) and lymph nodes (LN) (F) of untreated and DT-treated TCL1 leukemia-bearing mice. In (F) the graphs presenting the expression of CD69 surface marker on CD4+ and CD8+ T cells in LN are also shown. The data from two independent experiments are showing mean values. Each dot represents an individual sample (mouse), n = 12-14, Mann-Whitney U test *p ≤ 0.05, **p ≤ 0.01, ***p ≤ 0.001, ****p < 0.0001.
Figure 2
Figure 2
Depletion of Tregs in TCL1 leukemia-bearing DEREG mice results in the expansion of CD8+ lymphocytes capable of eradicating leukemic cells. (A) The graph presenting a scheme of the experiment. DEREG mice were treated according to scheme from Fig1A. Then 5 x 10⁶ of splenic CD8+ T cells isolated with magnetic beads from untreated (DEREG w/o DT) or DT-treated (DEREG DT) leukemic DEREG mice were injected to RAG2-KO mice following the injection of TCL1 (CD5+CD19+) cells. (B, C) The percentage of leukemic cells (CD5+CD19+) assessed at indicated time points in the peripheral blood of RAG2-KO mice: TCL1 leukemia-injected mice (black lines), TCL1- and CD8+-injected mice (CD8+ isolated from TCL1 leukemia bearing-DEREG w/o DT, pink lines), and TCL1- and CD8+-injected mice (CD8+ isolated from leukemia-bearing DEREG treated with DT, blue lines). Each line represents an individual sample (mouse), (B) and on day 39th (C), each dot represents an individual sample (mouse). The graphs represent mean results from two independent experiments, n = 7-9, Mann-Whitney U test ***p ≤ 0.001, ****p < 0.0001. (D) The survival plot summarizing the results from two independent experiments, n = 7-9, log-rank survival test ***p ≤ 0.001. (E) The productive Simpson clonality of CD8+ lymphocytes sorted from untreated or DT-treated mice analyzed in immunoSEQ Analyzer (from Adaptive Biotechnologies), n = 5. (F) The top 15 amino acid sequences of CDR3 TCRβ with the highest sum frequency (total amount of clones with a given sequence in all tested mice), of CD8+ lymphocytes sorted from untreated (pink) or DT-treated TCL1 leukemia-bearing DEREG mice (blue). The Graphs present log2 transformation of % sum frequency of a given sequence in untreated (pink, upper graph) and DT- treated TCL1- injected DEREG mice (blue, lower graph), n = 5.
Figure 3
Figure 3
A specific Tregs population is formed during the progression of TCL1 leukemia. (A) tSNE analysis of Tregs phenotype isolated from control (grey) and TCL1 leukemia-bearing (blue) B6 Foxp3EGFP mice 14 days after injections with leukemic cells. The overlay of counterplots presents the Tregs subpopulation, specific for TCL1 leukemia-bearing mice (Tregs A, orange). The Tregs GFP+-were plot on the graphs according to the expression of CD44, CD69, CD25, and LAG-3 that are presented on the histograms. The counter plots show representative analysis of Tregs from 2 control and 4 TCL1 leukemia-injected mice. (B) The productive Simpson clonality of Tregs sorted from control (all Tregs, CTR Tregs) and TCL1 leukemia-bearing (the specific TCL1-associated Tregs subpopulation, Tregs A) DEREG mice, n = 5. (C) The productive sum frequency of top 10 amino acid sequences of CDR3 TCRβ of Tregs A which were present in all of tested TCL1 leukemia-bearing DEREG mice, n = 5. (D) Clustering of selected DEGs between Tregs A and Tregs B (RNA sequencing with FDR < 0.05 and log2FC > 1) by correlation with complete linkage, n = 3. (E) Gene expression (log2, RNA sequencing) of genes from panel A in Tregs from CTR and TCL1 leukemia-bearing mice, n = 3. One-way ANOVA * p≤ 0.05, ** p< 0.01, *** p< 0.001.
Figure 4
Figure 4
Tregs from TCL1 leukemia-bearing mice are capable of inhibiting T cells proliferation. (A) All Tregs-GFP+ sorted from spleens of control (CTR Tregs) and TCL1-injected (TCL1 Tregs) B6-Foxp3EGFP mice, were added to the Cell Trace Violet (CT) stained CD8+ lymphocytes isolated from control mice and activated with αCD3 and αCD28 antibodies. The proliferation of – CT-stained CD8+ T cells was assessed by flow cytometry. Graphs show the results from two independent experiments, mean ± SD, n = 2-4 (B) OT1 CD8+ cell proliferation in mice injected with TCL1-OVA cells. After TCL1-OVA cells inoculation the mice were treated with DT and injected with CT-positive OT1 CD8+ lymphocytes (scheme of the experiment, upper panel). The proliferation of OT1 CD8+ cells from untreated or DT-treated mice was evaluated on the same day (7th or 8th). The representative histograms of proliferation measured on days 7th and 8th are shown (left panel) and the proliferation index, from two independent experiments, is shown on the graph (middle right panel), n = 7 **p ≤ 0.01. Proliferation index was calculated by FlowJo software as the total number of divisions divided by the number of cells that went into division. The percentage of leukemic cells was assessed in blood and spleens of DEREG mice on day 8th of the experiment (lower panel), data is presented as mean ± SD, n = 3-4, Mann-Whitney U test * p ≤ 0.05. (C) OT1 CD8+ cell proliferation in mice injected with TCL1 cells and vaccinated with OVA protein. The representative histograms (left panel) and graph summarizing the results from two independent experiments (right panel), n = 5-6. (D) Gating strategy incorporated for analysis of CT-positive OT1 CD8+ T cells proliferation in functional in vivo tests.
Figure 5
Figure 5
Development of a specific TCL1-related Tregs (Tregs A) population is correlated with the stage of the disease and can be blocked by MALT-1 inhibitor. (A) The box plot min-max graph (left panel) and density plots with gating strategy (right panel) present phenotype of Tregs in relation to the percentage of leukemic cells (CD5+CD19+) in the spleens. Mean ± SD, n=11, Mann-Whitney U test *p ≤ 0.05. (B) The graph presenting a scheme of the experiment. MI-2 was administered daily at dose 20 mg/kg via intraperitoneal injections for two weeks. (C) The phenotype of Tregs collected from spleens of TCL1 leukemia-bearing B6 Foxp3EGFP mice, untreated (TCL1) or treated with MI-2(TCL1 + MI-2). Mean ± SD, Mann-Whitney U test n = 5, *p ≤ 0.05. (D) Percentage of leukemic cells (CD5+CD19+) assessed by flow cytometry in blood (left graph) and spleens (right graph) on day 21st of the experiment. The graph presents data from three (blood, n = 10-14) or two (spleens, n = 7-8) independent experiments. Each dot represents an individual sample (mouse), means, Mann-Whitney U test **p ≤ 0.01, ***p ≤ 0.001, **** p < 0.0001. (E) The percent of naïve, effector (EFF), central memory (CM), subpopulations of CD4+ and CD8+ T cells. Cells were collected from spleens of untreated and MI-2-treated TCL1 leukemia-bearing B6 Foxp3EGFP mice in two independent experiments, n = 7-12. Each dot represents an individual sample (mouse), means, Mann-Whitney U test *p ≤ 0.05, **p ≤ 0.01, ***p ≤ 0.001.
Figure 6
Figure 6
The pretreatment with MALT-1 inhibitor sensitizes leukemia to the therapy with anti-PD-L1 at the advanced stage of the disease. (A) The graphs presenting a scheme of the experiment. (B) The percentage of CD3+, CD4+, CD8+ and naïve, effector (EFF), and central memory (CM) subpopulations of CD4+ and CD8+. Cells were collected from spleens of untreated (CTR), MI-2 and/or aPD-L1-treated TCL1 leukemia-bearing mice, n = 4-5, each dot represents an individual sample (mouse), means, Mann-Whitney U test *p ≤ 0.05, **p ≤ 0.01. (C) The Percentage of leukemic cells (CD5+CD19+) assessed by flow cytometry in blood (left panel) and spleens (right panel) at day 26th of the experiment, n = 5, each dot represents an individual sample (mouse), means, Mann-Whitney U test *p ≤ 0.05, **p ≤ 0.01.

Similar articles

Cited by

References

    1. Sedlarikova L, Petrackova A, Papajik T, Turcsanyi P, Kriegova E. Resistance-Associated Mutations in Chronic Lymphocytic Leukemia Patients Treated With Novel Agents. Front Oncol (2020) 10:894. doi: 10.3389/fonc.2020.00894 - DOI - PMC - PubMed
    1. Lemal R, Tournilhac O. State-Of-the-Art for CAR T-Cell Therapy for Chronic Lymphocytic Leukemia in 2019. J Immunother Cancer (2019) 7(1):202. doi: 10.1186/s40425-019-0686-x - DOI - PMC - PubMed
    1. Cox MJ, Lucien F, Sakemura R, Boysen JC, Kim Y, Horvei P, et al. . Leukemic Extracellular Vesicles Induce Chimeric Antigen Receptor T Cell Dysfunction in Chronic Lymphocytic Leukemia. Mol Ther J Am Soc Gene Ther (2020) 29(4):1529–40. doi: 10.1016/j.bbmt.2019.12.137 - DOI - PMC - PubMed
    1. June CH, Sadelain M. Chimeric Antigen Receptor Therapy. N Engl J Med (2018) 379(1):64–73. doi: 10.1056/NEJMra1706169 - DOI - PMC - PubMed
    1. Wierz M, Pierson S, Guyonnet L, Viry E, Lequeux A, Oudin A, et al. . Dual PD1/LAG3 Immune Checkpoint Blockade Limits Tumor Development in a Murine Model of Chronic Lymphocytic Leukemia. Blood (2018) 131(14):1617–21. doi: 10.1182/blood-2017-06-792267 - DOI - PMC - PubMed

Publication types

Substances