. 2022 Mar 17;20(1):67.
doi: 10.1186/s12915-022-01257-8.

Identification and characterisation of spontaneous mutations causing deafness from a targeted knockout programme

Affiliations

Identification and characterisation of spontaneous mutations causing deafness from a targeted knockout programme

Morag A Lewis et al. BMC Biol. .

Abstract

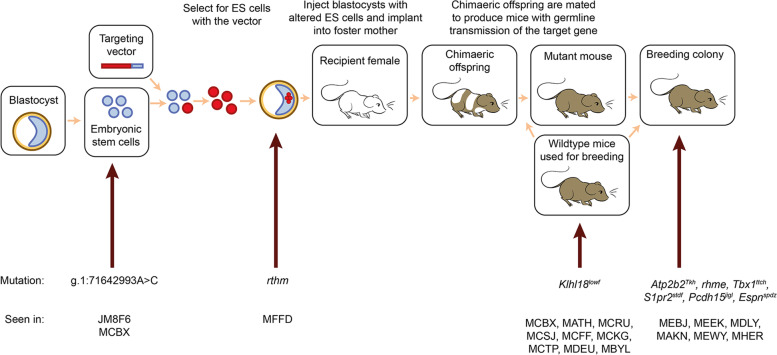
Background: Mice carrying targeted mutations are important for investigating gene function and the role of genes in disease, but off-target mutagenic effects associated with the processes of generating targeted alleles, for instance using Crispr, and culturing embryonic stem cells, offer opportunities for spontaneous mutations to arise. Identifying spontaneous mutations relies on the detection of phenotypes segregating independently of targeted alleles, and having a broad estimate of the level of mutations generated by intensive breeding programmes is difficult given that many phenotypes are easy to miss if not specifically looked for. Here we present data from a large, targeted knockout programme in which mice were analysed through a phenotyping pipeline. Such spontaneous mutations segregating within mutant lines may confound phenotypic analyses, highlighting the importance of record-keeping and maintaining correct pedigrees.

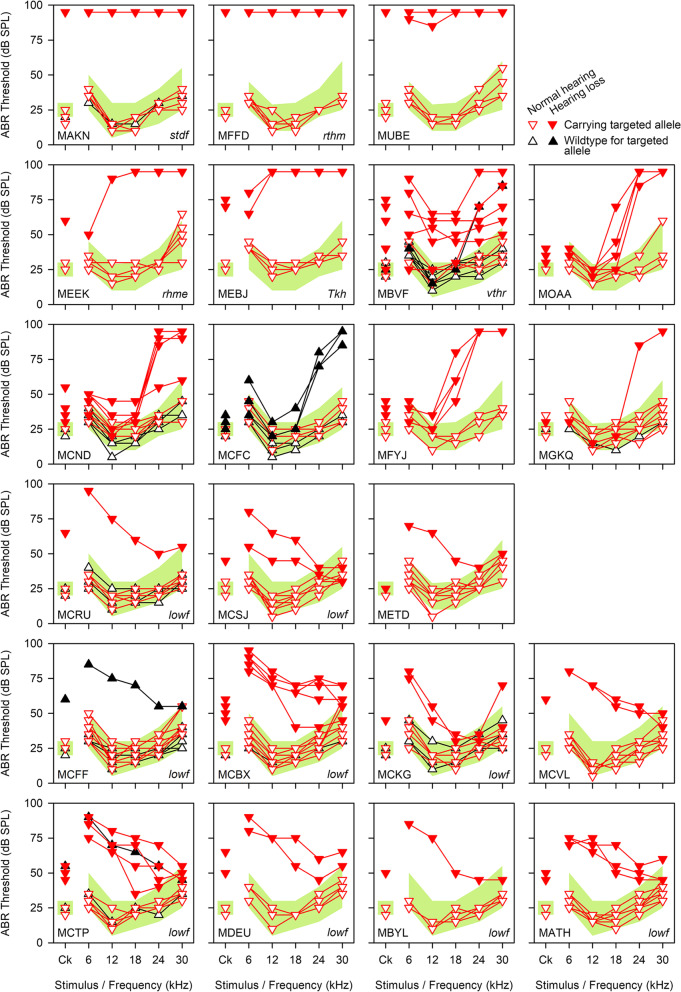
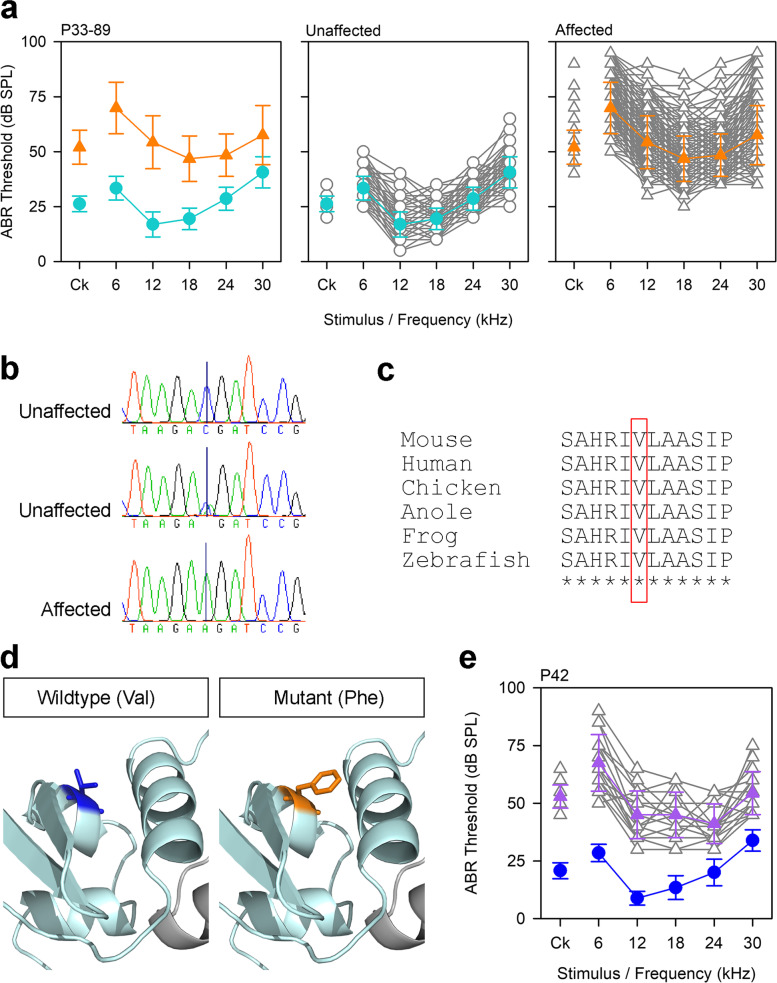
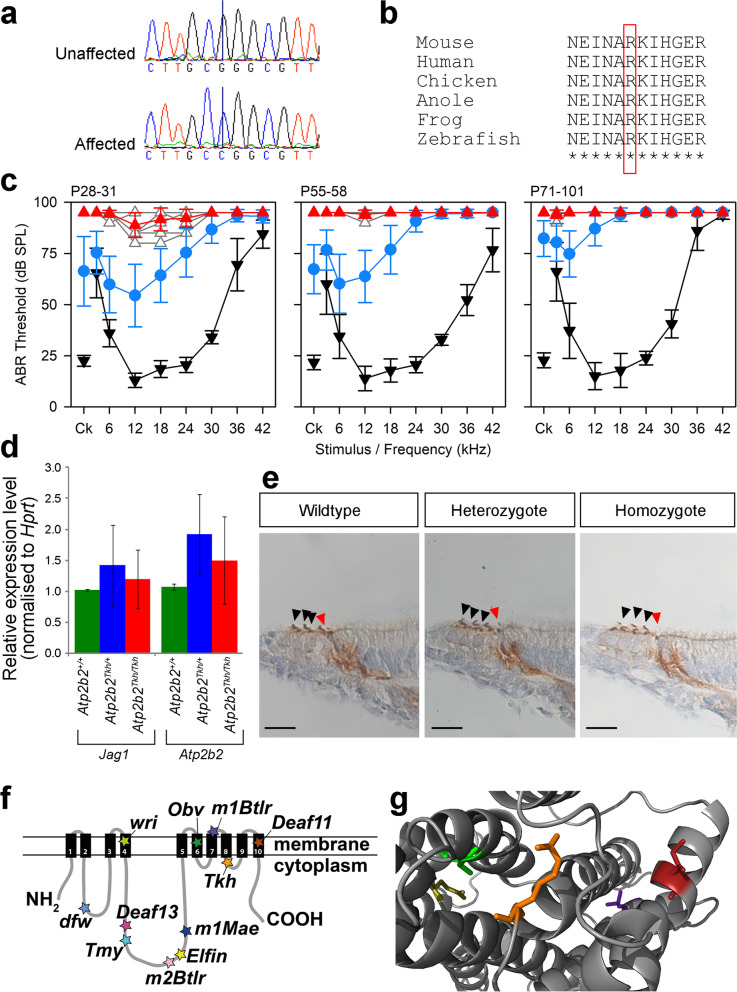
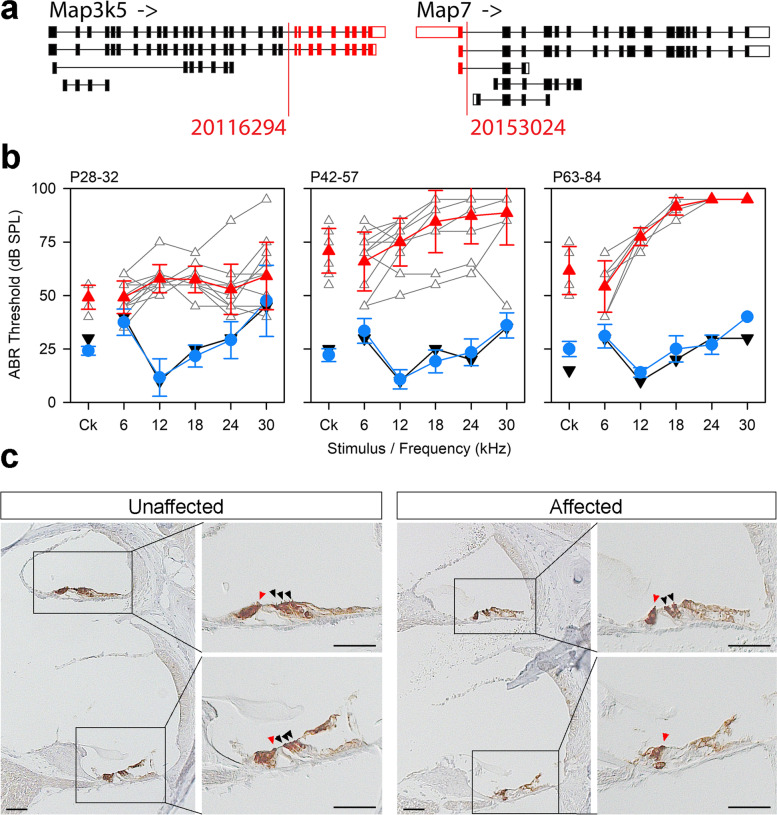
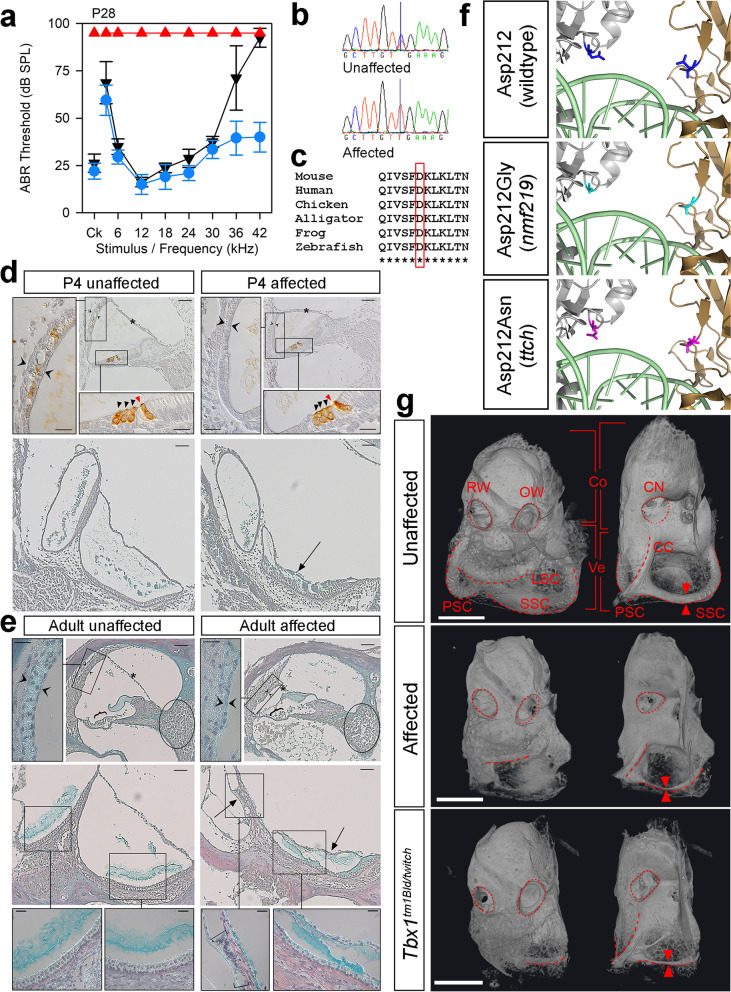
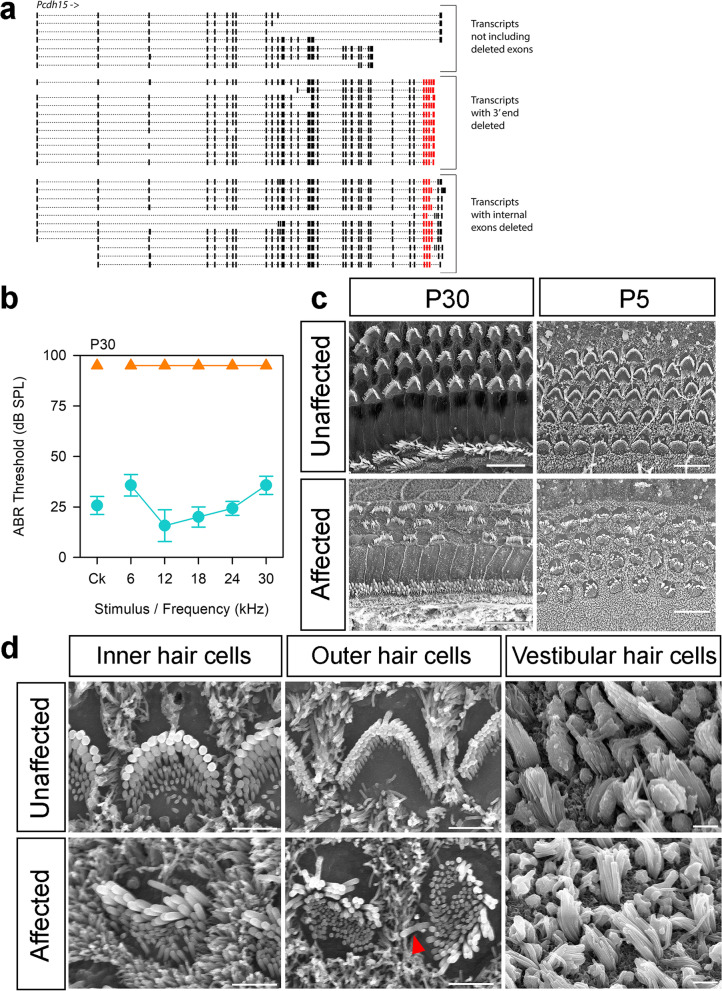
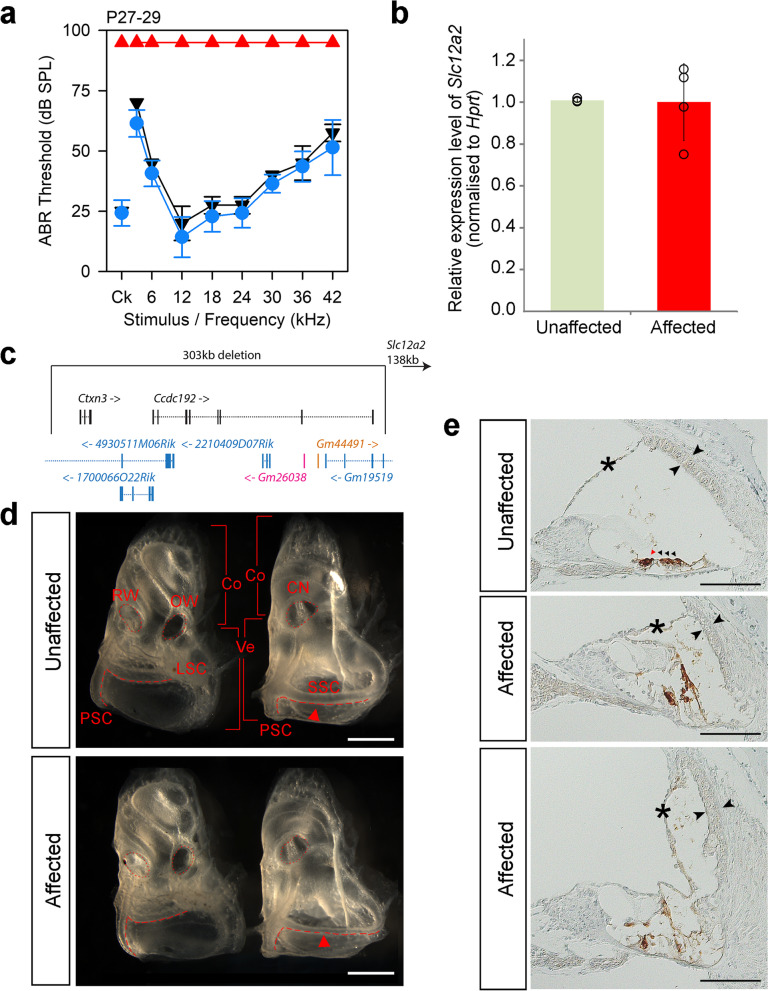
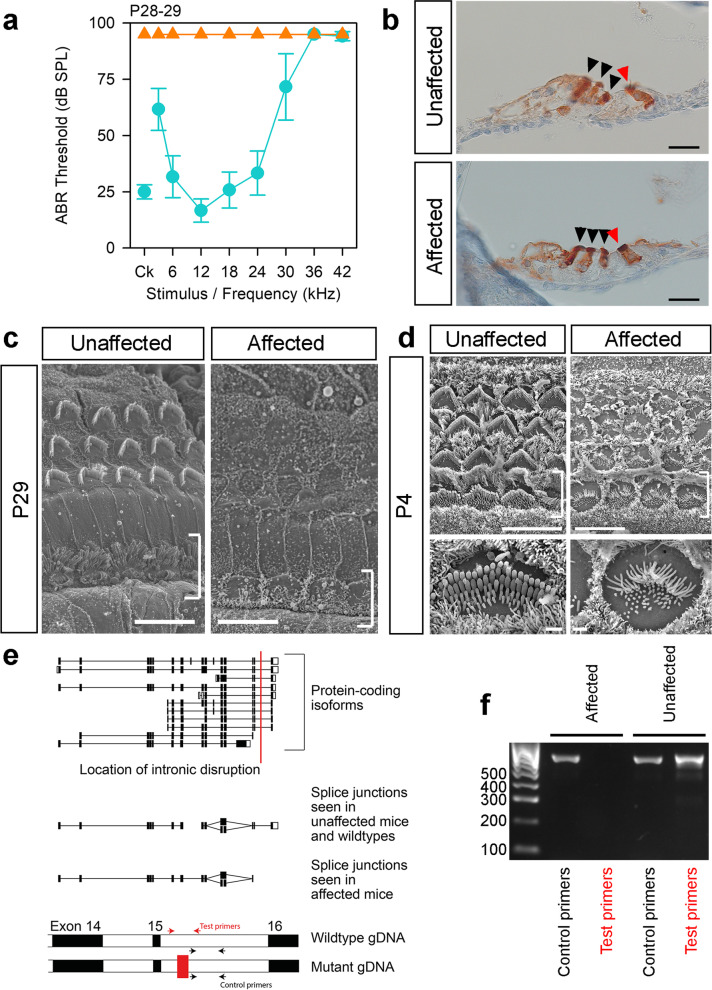
Results: Twenty-five lines out of 1311 displayed different deafness phenotypes that did not segregate with the targeted allele. We observed a variety of phenotypes by Auditory Brainstem Response (ABR) and behavioural assessment and isolated eight lines showing early-onset severe progressive hearing loss, later-onset progressive hearing loss, low frequency hearing loss, or complete deafness, with vestibular dysfunction. The causative mutations identified include deletions, insertions, and point mutations, some of which involve new genes not previously associated with deafness while others are new alleles of genes known to underlie hearing loss. Two of the latter show a phenotype much reduced in severity compared to other mutant alleles of the same gene. We investigated the ES cells from which these lines were derived and determined that only one of the 8 mutations could have arisen in the ES cell, and in that case, only after targeting. Instead, most of the non-segregating mutations appear to have occurred during breeding of mutant mice. In one case, the mutation arose within the wildtype colony used for expanding mutant lines.

Conclusions: Our data show that spontaneous mutations with observable effects on phenotype are a common side effect of intensive breeding programmes, including those underlying targeted mutation programmes. Such spontaneous mutations segregating within mutant lines may confound phenotypic analyses, highlighting the importance of record-keeping and maintaining correct pedigrees.

Keywords: Deafness; Large-scale mutagenesis programme; Non-segregating phenotypes; Progressive hearing loss; Spontaneous mutations.


Conflict of interest statement

The authors declare that they have no competing interests.

Figures

Fig. 1
Fig. 1
ABR thresholds from 22 targeted lines displaying non-segregating hearing loss. ABR thresholds showing individual mice from targeted mutant lines displaying hearing loss (filled symbols) which does not segregate with the targeted mutant allele (red, inverted triangles) from the original ABR screen. Mice with normal hearing are shown with empty symbols, and black triangles indicate mice which were wildtype for the targeted mutant allele. Affected mice from the MAKN, MFFD and MUBE lines (top) were almost completely deaf. Affected mice from the MEEK and MEBJ colonies exhibited severe hearing loss, while affected mice from the MBVF colony exhibited varying degrees of hearing loss across all frequencies. Affected mice from the MOAA, MCND, MCFC, MFYJ and MGQK colonies (second and third lines) had hearing loss affecting only the higher frequencies, while the remaining eleven colonies all exhibited hearing loss affecting primarily the low frequencies. The shaded pale green area on each panel denotes the 95% reference range for a large population of control wildtype mice derived from littermates of the tested mice, defined in [11]. All mice were tested at 14 weeks old. Mice from three other lines which exhibited non-segregating hearing loss were detected because of their vestibular phenotype (due to the Tbx1ttch, Pcdh15jigl and Espnspdz alleles) and did not undergo ABRs as part of the ABR screening pipeline. MAKN n = 7 unaffected, 3 affected; MFFD n = 5 unaffected, 1 affected; MUBE n = 4 unaffected, 2 affected; MEEK n = 5 unaffected, 1 affected; MEBJ n = 4 unaffected, 2 affected; MBVF n = 11 unaffected, 6 affected; MOAA n = 3 unaffected, 6 affected; MCND n = 9 unaffected, 5 affected; MCFC n = 7 unaffected, 3 affected; MFYJ n = 3 unaffected, 4 affected; MGKQ n = 9 unaffected, 1 affected; MCRU n = 11 unaffected, 1 affected; MCSJ n = 7 unaffected, 2 affected; METD n = 7 unaffected, 1 affected; MDEU n = 5 unaffected, 2 affected; MCFF n = 16 unaffected, 1 affected; MCBX n = 9 unaffected, 5 affected; MCKG n = 8 unaffected, 2 affected; MCVL n = 7 unaffected, 2 affected; MCTP n = 7 unaffected, 5 affected; MBYL n = 5 unaffected, 1 affected; MATH n = 8 unaffected, 3 affected. Data underlying these plots are in Additional File 3
Fig. 2
Fig. 2
Mutations in Klhl18 cause low frequency hearing loss. a Mean ABR thresholds from mice tested during establishment of the breeding colony derived from the MCBX colony. Mice were tested between 33 and 89 days old, and grouped into affected (n = 221, orange triangles) and unaffected (n = 213, teal circles) based on the bimodal distributions of thresholds for clicks and 6 kHz stimuli. Plots of individual ABR thresholds (grey) are shown separately with the mean trace indicated by coloured lines and symbols; error bars on mean trace are standard deviations. b Sequence traces from two unaffected mice (one wildtype, one heterozygote) and an affected mouse (homozygote) showing the variant Klhl18lowf (MCBX colony), p.V55F. c Clustal alignment from mouse, human, chicken, anole lizard, frog and zebrafish showing that the affected amino acid is highly conserved (red box). d Close-up of the BTB domain (pale cyan) showing the amino acid structures for the wildtype residue (blue, left) and the mutant residue (orange, right). e Mean ABR thresholds from mice heterozygous for the lowf allele (n = 13, blue circles) and compound heterozygotes carrying the lowf allele and the Klhl18tm1a allele (n = 17, purple triangles), demonstrating the low frequency hearing loss phenotype. Individual traces for the compound heterozygotes are shown in grey; error bars on mean trace are standard deviations. Data underlying plots in this figure are in Additional File 3
Fig. 3
Fig. 3
A missense mutation in Atp2b2 results in semidominant progressive hearing loss. a Sequence traces from an unaffected and an affected mouse showing the variant Atp2b2Tkh (MEBJ colony), p.R969G. b Clustal alignment from mouse, human, chicken, anole lizard, frog and zebrafish showing that the affected amino acid is highly conserved (red box). c Mean ABR thresholds from wildtype (black inverted triangles), heterozygote (blue circles) and homozygote (red triangles) mice at P28-P31 (n = 10 wildtypes, 27 heterozygotes, 9 homozygotes), P55-P58 (n = 9 wildtypes, 24 heterozygotes, 6 homozygotes) and P71-P101 (n = 9 wildtypes, 24 heterozygotes, 6 homozygotes). Error bars are standard deviations. d Jag1 and Atp2b2 qPCR on RNA from the organ of Corti at P4 (n = 6 wildtypes, 6 heterozygotes and 6 homozygotes). There was no difference between the Jag1 levels of wildtypes, heterozygotes and homozygotes (p = 0.307, Welch’s one-way ANOVA). We found a marginally significant difference in Atp2b2 levels (p = 0.036, Welch’s one-way ANOVA), but this was not borne out by the post hoc Games-Howell multiple comparison test (p = 0.052 for wildtypes compared to heterozygotes, p = 0.379 for wildtypes compared to homozygotes, p = 0.553 for heterozygotes compared to homozygotes). The bars show the mean expression levels, and error bars are standard deviations. e PMCA2 antibody stains at P4 (n = 3 wildtypes, 3 heterozygotes, 3 homozygotes), showing hair cells from the region 43% of the distance along the organ of Corti from base to apex. Images are representative examples for each genotype, and no differences were observed between genotypes. Arrowheads indicate the hair cells, red for the inner hair cell and black for the outer hair cells. Scale bar = 20 µm. f Schematic of PMCA2 protein showing the 10 transmembrane helices and the 11 known missense mutations [, , –34, 36]). g Model of PMCA2 protein with the amino acid affected by the Tkh allele in orange. The four other missense mutations located in or near the transmembrane helices are also visible, shown in green (Obv [31]), dark red (Deaf11 [25]), olive yellow (wri [33]) and purple (M1Btlr [29]). The wildtype amino acid structures are shown for all four residues. Data underlying plots in this figure are in Additional File 3
Fig. 4
Fig. 4
The rhme deletion spanning Map3k5 and Map7 causes progressive hearing loss and disrupts the organ of Corti. a Schematic of the rhme deletion seen in the MEEK line showing the different isoforms of the two affected genes (not to scale). Red indicates missing exons. b Mean ABR thresholds showing progressive hearing loss in mice homozygous for the deletion (wildtype shown by black inverted triangles, heterozygote by blue circles, homozygotes by red triangles) (n = 1 wildtype, 6 heterozygotes and 12 homozygotes at P28-32; 1 wildtype, 19 heterozygotes and 11 homozygotes at P42-57; 1 wildtype, 5 heterozygotes and 6 homozygotes at P63-84 (see Additional File 1: Fig. S9a for individual thresholds)). Traces from individual homozygotes are shown in grey; error bars on mean trace are standard deviations. c Expression of MYO7A, a hair cell marker, in the organ of Corti of adult mice showing an apical turn (top; 94% of the distance along the organ of Corti from base to apex), where the hair cells are still present in affected mice, and a mid-basal turn (bottom, 43% of the distance from base to apex), where only the inner hair cell is identifiable (hair cells are marked with arrowheads; red for inner hair cells, black for outer hair cells). Brown indicates where MYO7A is expressed. Three affected and 3 unaffected littermates (at matched ages between 33 and 84 days old) were examined, and the images shown are representative of our observations. Scale bar = 50 µm. Data underlying plots in this figure are in Additional File 3
Fig. 5
Fig. 5
A missense mutation in Tbx1 causes malformation of the semicircular canals and profound deafness. a Mean ABR thresholds from P28 mice homozygous (n = 6, red triangles), heterozygous (n = 10, blue circles) and wildtype (n = 4, black inverted triangles) for the Tbx1ttch allele (MDLY colony), p.D212N. Error bars are standard deviations. See Additional File 1: Fig. S9b for individual thresholds. b Sequence traces from an unaffected and an affected mouse showing the variant. c Clustal alignment showing conservation of the affected amino acid (red box). d P4 sections showing the cochlear duct (top, anti-MYO7A brown stain, blue counterstain, 43% of the distance along the organ of Corti from base to apex) and the maculae (bottom, trichrome staining) (n = 3 affected, 3 unaffected littermates). MYO7A is expressed in hair cells (arrowheads; red/black for inner/outer hair cells) and the intermediate cells of the stria vascularis. e Trichrome-stained sections from adult mice (n = 4 affected, 4 unaffected littermates) showing the cochlear duct (top, 72% of the distance along the organ of Corti from base to apex) and the maculae (bottom). Brackets mark the organ of Corti and the spiral ganglion area is circled. Square brackets indicate abnormal saccular hair cells. In d and e, main panel scale bars = 50 µm, high magnification panel scale bars = 20 µm. Asterisks mark Reissner’s membrane, twin open arrowheads the stria vascularis, and arrows the collapsed saccule. f Human TBX1 protein model [104], as a homodimer (silver, gold) bound to DNA (pale green). The Asp212 residue is marked in blue (top), with the nmf219 mutant residue [41] in cyan (middle) and the ttch mutant residue in magenta (bottom). g MicroCT scans of cleared inner ears from affected P28 mice (n = 3, middle) and compound heterozygotes (Tbx1tm1Bld/ttch) at P21 (n = 2, bottom). An unaffected P21 mouse is shown at the top (P21 n = 4; P28 n = 3). Dashed lines outline the semicircular canals, with twin arrowheads for comparison of their width. The middle ear side, with the round (RW) and oval (OW) windows (dotted lines) is on the left, and the brain side, where the cochlear nerve exits (CN, dotted lines), on the right. Brackets indicate the cochlea (Co) and vestibular region (Ve). LSC = lateral semicircular canal; SSC = superior semicircular canal; PSC = posterior semicircular canal, CC = common crus. Scale bar = 1 mm. Data underlying plots in this figure are in Additional File 3
Fig. 6
Fig. 6
A deletion within the Pcdh15 gene causes disruption of stereocilia bundles and profound deafness. a Schematic of Pcdh15 isoforms showing the internal deletion in Pcdh15 (jigl, MEWY colony), showing the effects of the deletion on different transcripts (not to scale). Red indicates the deleted exons. Transcripts are shown in their entirety, but not all exons are visible due to scale. b Mean ABR thresholds of affected (n = 6, orange triangles) and unaffected (n = 7, teal circles) mice at P30. Error bars are standard deviations. c Scanning electron micrographs of the organ of Corti at P30 (60–70% of the distance from base to apex, scale bar = 10 µm, n = 3 unaffected, 6 affected mice) and P5 (50–80% of the distance from base to apex, scale bar = 10 µm, n = 5 unaffected, 4 affected mice). Mice at P5 were not able to be phenotyped by circling behaviour, but the scanning electron micrographs showed a clear bimodal distribution of affected and unaffected based on disorganisation of hair bundles, and we were unable to amplify the deleted region in affected pups (see Table S7 for primers). Representative examples are shown here. Affected P5 mice had less well-organised hair cell bundles than unaffected littermates. The overall “V” shape of the stereocilia bundle was distorted and irregular in the organ of Corti of affected mice. The polarity of some outer hair cell bundles was rotated by up to 90°, and in some cases, the kinocilium was on the opposite side of the cell (arrowhead in d). d Close ups of hair cells at P5, showing cochlear hair cells from the same region as in c, and vestibular hair cells from the macula (n = 2 unaffected and 2 affected mice). The arrowhead indicates an example of a kinocilium on the opposite side of the outer hair cell from the stereocilia bundle. Macular stereocilia bundles seemed to have a more ordered staircase structure in the mice classed as unaffected compared to affected mice, where all stereocilia appeared to be long with little sign of a staircase arrangement. Scale bars = 2 µm. Data underlying plots in this figure are in Additional File 3
Fig. 7
Fig. 7
A 303 kb deletion on chr18 affects semicircular canals and results in profound deafness. a Mean ABR thresholds of mice homozygous (n = 6, red triangles), heterozygous (n = 7, blue circles) and wildtype (n = 2, black inverted triangles) for the rthm allele (MFFD colony) at P28 ± 1 day. Error bars are standard deviations. See Additional File 1: Fig. S9c for individual thresholds. b Slc12a2 qPCR on RNA from the brains of P28 affected (n = 4, red, right) and unaffected (n = 4, green, left) mice. There is no significant difference between wildtypes and homozygotes (p = 1, Wilcoxon rank sum test). The bars show the mean expression level, and the points show the individual measures. Error bars are standard deviations. c Schematic showing the genes affected by the deletion. There are two protein-coding genes (black), one miRNA gene (orange), one snRNA gene (pink) and four lncRNA genes (blue). Slc12a2 is located 138 kb downstream of the 3’ end of the deletion (indicated by arrow top right). d Inner ears from affected (n = 3) and unaffected (n = 3) mice at P28 ± 1 day. The middle ear side, with the round (RW) and oval (OW) windows is shown on the left of each panel, and the brain side, where the cochlear nerve exits (CN), on the right. The round and oval windows and the cochlear nerve exits are marked by dotted lines, and the semicircular canals by dashed lines. Brackets indicate the cochlea (Co) and vestibular region (Ve). LSC = lateral semicircular canal; SSC = superior semicircular canal; PSC = posterior semicircular canal. Scale bar = 1 mm.The superior semicircular canals are thinner in affected mice (red arrowheads). e Immunohistochemistry of the cochlear duct of affected (n = 3) and unaffected (n = 3) mice at P28. Brown indicates the presence of MYO7A, which marks hair cells and the intermediate cells of the stria vascularis (marked by twin open arrowheads). Hair cells are only clearly visible in the unaffected mouse, indicated by the arrowheads (red for the inner hair cell and black for the outer hair cells). Asterisks show the Reissner’s membrane, which is displaced in affected mice. The top two panels show the apical region, 72% of the distance from the base to the apex. The lower panel shows the basal region, at 16% of the base-apex distance. Scale bar = 100 mm. Data underlying plots in this figure are in Additional File 3
Fig. 8
Fig. 8
Mice carrying the spdz allele (MHER colony) are profoundly deaf, with abnormal hair cell stereocilia at P5 and hair cell degeneration by P29. a Mean ABR thresholds of affected (orange triangles, n = 7) and unaffected (teal circles, n = 6) mice at P28-29. Error bars are standard deviations. b Expression of MYO7A (brown) in hair cells from the apical region of the organ of Corti (90–95% of the distance from base to apex) of mice at P28 (n = 3 affected, 3 unaffected), showing that hair cells are visible in affected mice (arrowheads, red for the inner hair cell and black for outer hair cells). Scale bar = 20 µm. c Scanning electron micrographs of the 12 kHz best-frequency region (65–70% of the distance from base to apex) of the organ of Corti in unaffected (n = 4) and affected (n = 3) mice at P29. Brackets indicate the inner hair cell row. Most hair bundles are missing. Scale bar = 10 µm. d Scanning electron micrographs of a homozygous mutant mouse at P4 (n = 3) and an age-matched wildtype, showing the 42 kHz best-frequency region (20% of the distance from base to apex). Brackets indicate the inner hair cell row; scale bar = 10 µm. Lower panels show a magnified view of inner hair cells in the same region (scale bar = 1 µm). e Schematic showing the known protein-coding isoforms of Espn and the location of the intronic disruption (red line). The splice junctions identified in brain cDNA are shown below; each line indicates a splice junction visible in at least one mouse. At the bottom is a schematic of the genomic DNA (gDNA) showing exons 14, 15 and the start of exon 16 in black, separated by introns in white (not to scale). The disruption in the mutant is shown by the addition of a red block in the intron. The “test” primer pair (red arrows) fails to amplify in mutant gDNA, and the “control” primer pair (black arrows) works for both wildtype and mutant. f Gel showing bands amplified using these primer pairs (Additional File 2: Table S3) on an affected mouse and an unaffected mouse. The size of ladder bands is shown at the side in bp. Data underlying plots in this figure are in Additional File 3
Fig. 9
Fig. 9
There are many opportunities for spontaneous mutations to arise during the process of making a targeted knockout allele. A schematic showing the stages of making knockout mice. Spontaneous mutations can arise at any point in this process. The mutations described in this paper are shown at the bottom, with arrows indicating the latest possible time at which that mutation could have occurred. If a spontaneous mutation occurs in the cultured embryonic stem cells before targeting, it has the potential to affect multiple mouse lines, but although we detected variants in MCBX mice which were present in the parental ES cell line JM8F6 (eg g.1: 71642993A > C, Additional File 1: Fig S7, Additional File 2: Table S4b), none of the eight mutations affecting hearing were found in any of the parental ES cell lines (Table 1). A mutation arising later in the process may be specific to a single line (such as the rthm allele, which is likely to have arisen in the targeted ES cell) or a single mating within that line, which is likely to be the case for most of the mutations described here. The Klhl18lowf mutation, on the other hand, probably arose within the wildtype line used for expansion for all the colonies in which mice with the low frequency hearing loss phenotype were found

References

    1. Ayabe S, Nakashima K, Yoshiki A. Off- and on-target effects of genome editing in mouse embryos. J Reprod Dev. 2019;65(1):1–5. - PMC - PubMed
    1. Iyer V, Boroviak K, Thomas M, Doe B, Riva L, Ryder E, Adams DJ. No unexpected CRISPR-Cas9 off-target activity revealed by trio sequencing of gene-edited mice. PLoS Genet. 2018;14(7):e1007503. - PMC - PubMed
    1. Willi M, Smith HE, Wang C, Liu C, Hennighausen L. Mutation frequency is not increased in CRISPR-Cas9-edited mice. Nat Methods. 2018;15(10):756–758. - PubMed
    1. Anderson KR, Haeussler M, Watanabe C, Janakiraman V, Lund J, Modrusan Z, Stinson J, Bei Q, Buechler A, Yu C, et al. CRISPR off-target analysis in genetically engineered rats and mice. Nat Methods. 2018;15(7):512–514. - PMC - PubMed
    1. Cervantes RB, Stringer JR, Shao C, Tischfield JA, Stambrook PJ. Embryonic stem cells and somatic cells differ in mutation frequency and type. Proc Natl Acad Sci U S A. 2002;99(6):3586–3590. - PMC - PubMed

Publication types