. 2022 Mar 16;21(1):75.
doi: 10.1186/s12943-022-01557-1.

LSD1 deletion decreases exosomal PD-L1 and restores T-cell response in gastric cancer

Affiliations

LSD1 deletion decreases exosomal PD-L1 and restores T-cell response in gastric cancer

Dan-Dan Shen et al. Mol Cancer. .

Abstract

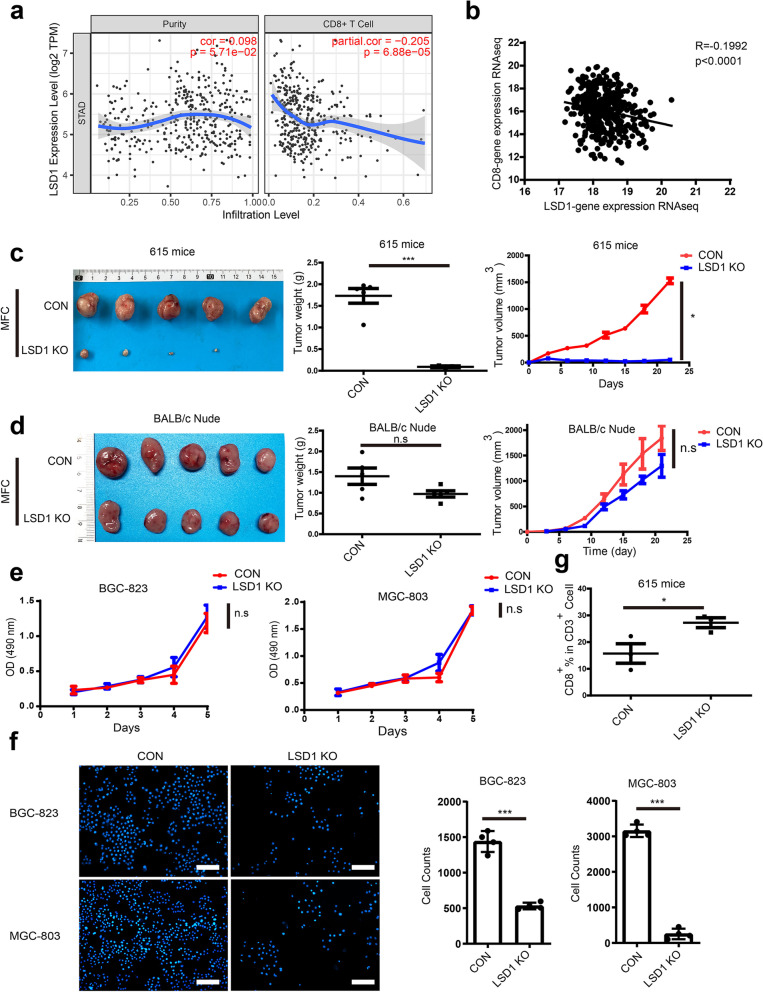
Background: Histone lysine-specific demethylase 1 (LSD1) expression has been shown to be significantly elevated in gastric cancer (GC) and may be associated with the proliferation and metastasis of GC. It has been reported that LSD1 repressed tumor immunity through programmed cell death 1 ligand 1 (PD-L1) in melanoma and breast cancer. The role of LSD1 in the immune microenvironment of GC is unknown.

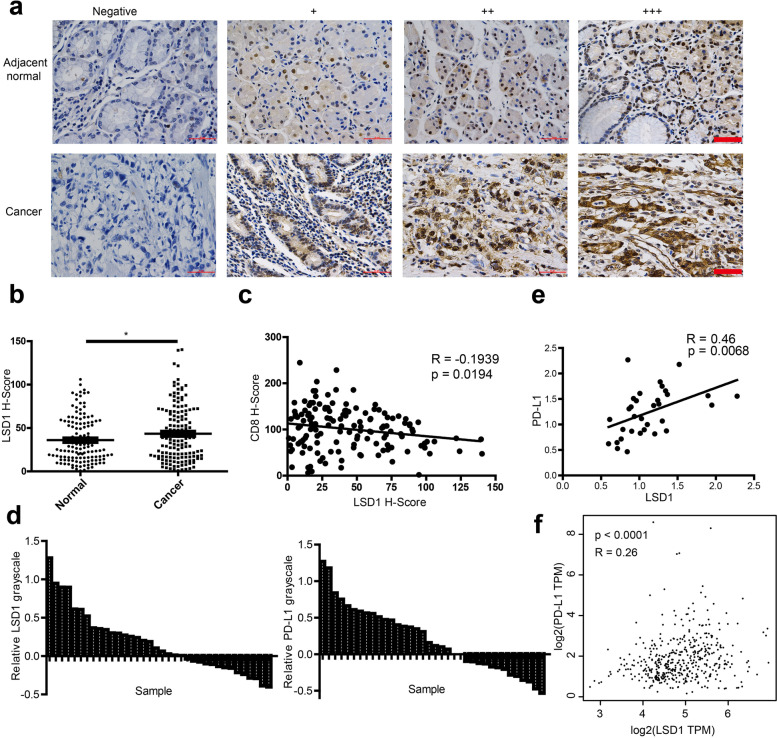
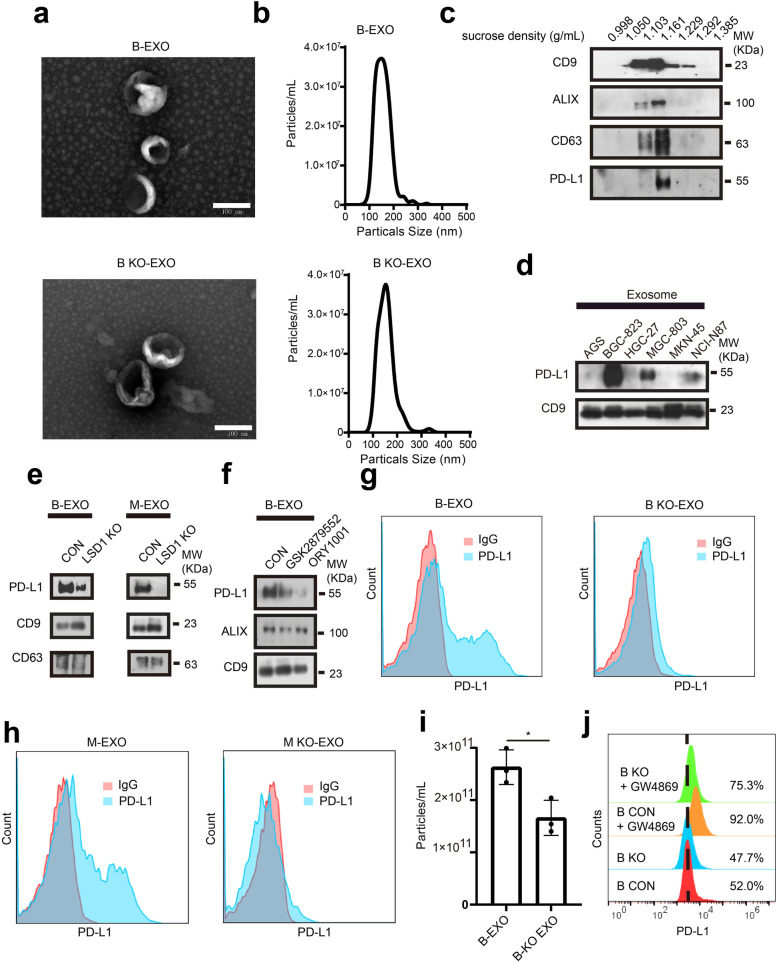
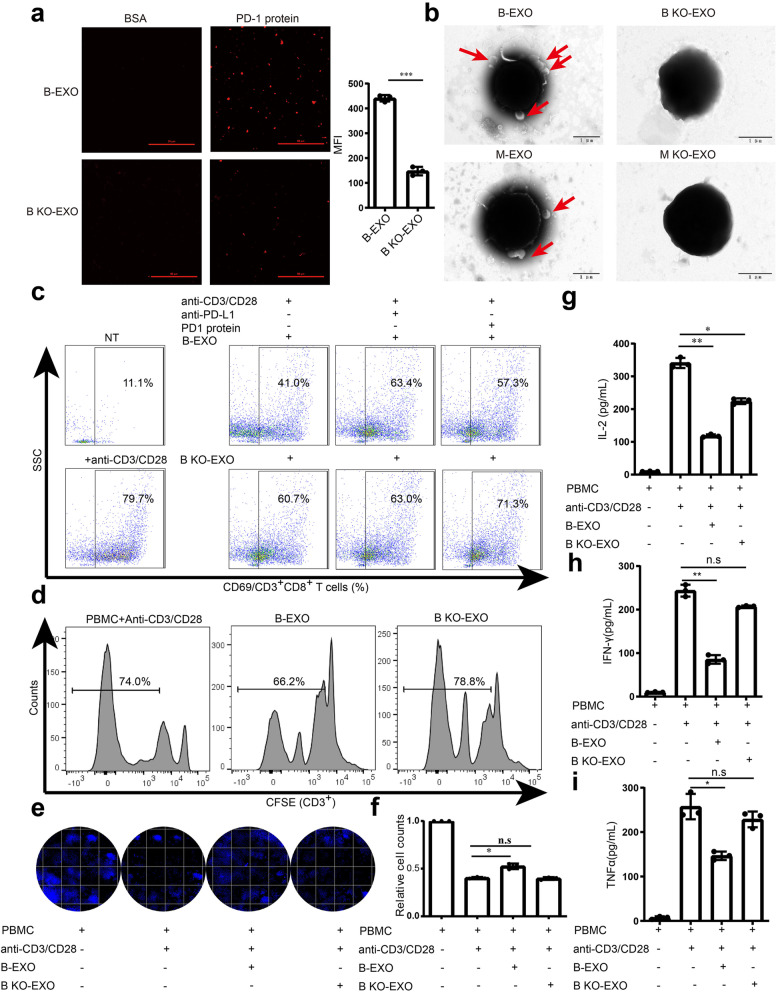
Methods: Expression LSD1 and PD-L1 in GC patients was analyzed by immunohistochemical (IHC) and Western blotting. Exosomes were isolated from the culture medium of GC cells using an ultracentrifugation method and characterized by transmission electronic microscopy (TEM), nanoparticle tracking analysis (NTA), sucrose gradient centrifugation, and Western blotting. The role of exosomal PD-L1 in T-cell dysfunction was assessed by flow cytometry, T-cell killing and enzyme-linked immunosorbent assay (ELISA).

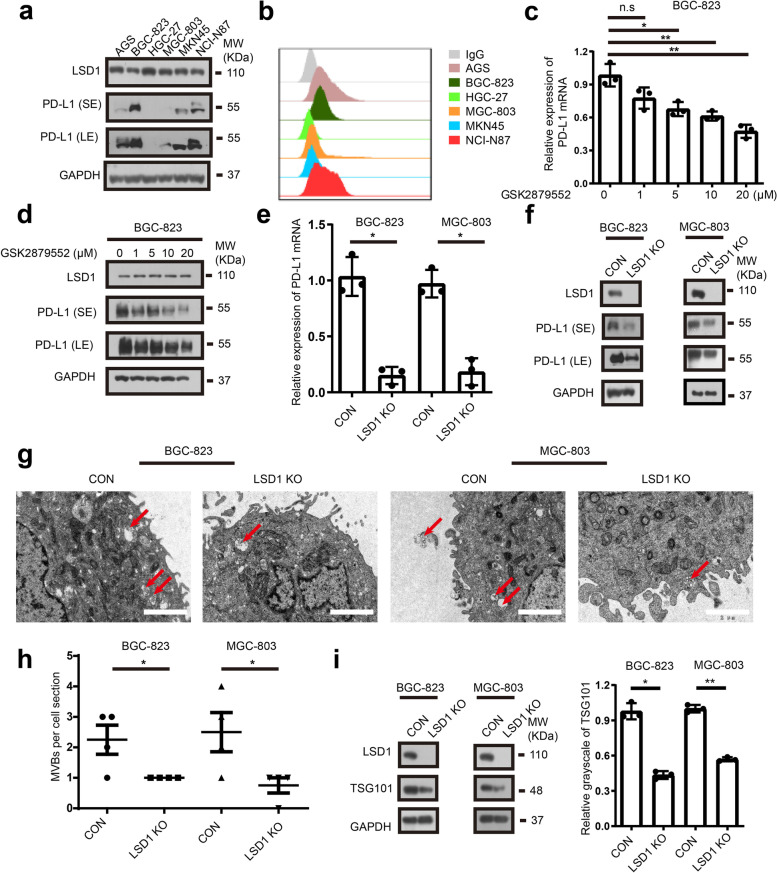
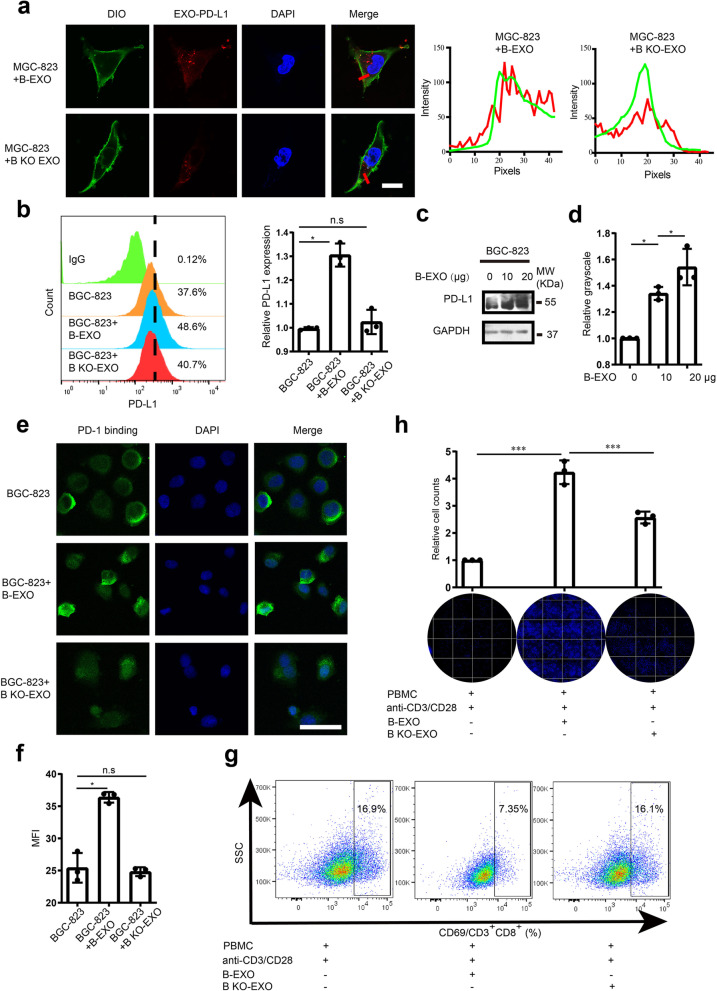
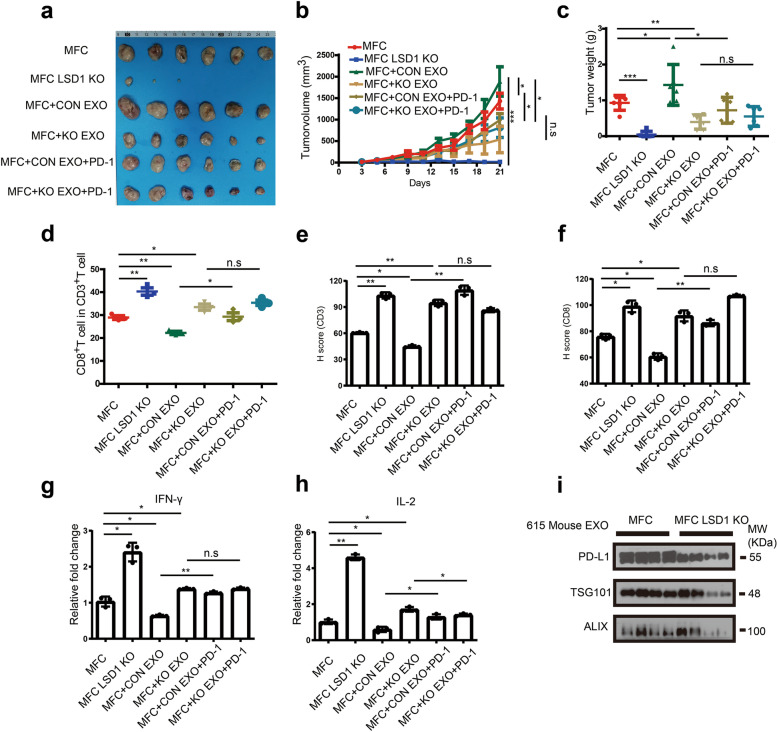
Results: Through in vivo exploration, mouse forestomach carcinoma (MFC) cells with LSD1 knockout (KO) showed significantly slow growth in 615 mice than T-cell-deficient BALB/c nude mice. Meanwhile, in GC specimens, expression of LSD1 was negatively correlated with that of CD8 and positively correlated with that of PD-L1. Further study showed that LSD1 inhibited the response of T cells in the microenvironment of GC by inducing the accumulation of PD-L1 in exosomes, while the membrane PD-L1 stayed constant in GC cells. Using exosomes as vehicles, LSD1 also obstructed T-cell response of other cancer cells while LSD1 deletion rescued T-cell function. It was found that while relying on the existence of LSD1 in donor cells, exosomes can regulate MFC cells proliferation with distinct roles depending on exosomal PD-L1-mediated T-cell immunity in vivo.

Conclusion: LSD1 deletion decreases exosomal PD-L1 and restores T-cell response in GC; this finding indicates a new mechanism with which LSD1 may regulate cancer immunity in GC and provides a new target for immunotherapy against GC.

Keywords: Exosomes; Gastric cancer; LSD1; PD-L1; Tumor immunity.


Conflict of interest statement

The authors declare that they have no conflicts of interest.

Figures

Fig. 1
Fig. 1
LSD1 KO can inhibit tumor growth by promoting T-cell response in GC. a Relationship between LSD1 and CD8 + T-cell infiltration level in GC analyzed by TIMER2.0. b Relationship between LSD1 and CD8 mRNA in GC using data from TCGA database (n = 407). c and d Images of tumors, tumor weight, and tumor volume curves of 615 mice (c) and BALB/c nude mice (d) bearing 2.5 × 105 MFC cells whether LSD1 was abrogated or not (The data are presented as the mean ± SD, n = 6). e Growth curves of BGC-823 and MGC-803 cells in the presence or absence of LSD1. f Cell survival of BGC-823 and MGC-803 cells in the presence or absence of LSD1, treated with anti-CD3/CD28-activated T cells. Scale bar = 200 μm. g Percentage of CD8+ T cells in CD3+ infiltration cells isolated from tumors of 615 mice bearing MFC cells in the presence or absence of LSD1. The data are presented as the mean ± SD; n = 3; n.s, no significance, *P < 0.05; two-tailed unpaired Student’s t-test
Fig. 2
Fig. 2
Positive correlation between expression of LSD1 and immune regulatory genes in GC specimens. a Representative images of LSD1 expression in normal gastric tissues and GC tissues stained by IHC. Scale bar = 50 μm. b Expression analysis of LSD1 in normal and cancer tissues form 145 GC patients. c Relationship between LSD1 and CD8 expression in cancer tissues form 145 GC patients. d Comparison of LSD1 and PD-L1 expression in 36 pairs of GC tissues and their corresponding adjacent normal tissues. y = (Grayscaletumor-Grayscalenormal)/ Grayscale normal. e Expression relationship between LSD1 and PD-L1 in 36 pairs of GC tissues. f Relationship between LSD1 and PD-L1 mRNA in GC using TCGA database
Fig. 3
Fig. 3
Inhibition of LSD1 downregulates PD-L1 gene levels in GC. a and b Expression of total PD-L1 (a) and membrane PD-L1 (b) in a panel of GC cell lines. c and d mRNA (c) and protein (d) expression of PD-L1 when BGC-823 cells were exposed to GSK2879552 for 5 days. e and f mRNA (e) and protein (f) expression of PD-L1 in BGC-823 and MGC-803 cells in the presence or absence of LSD1. g and h Morphology (g) and number (h) of polyvesicular corpuscles in BGC-823, MGC-803 cells in the presence or absence of LSD1. Scale bar = 2 µm (The data are presented as the mean ± SD; n = 4). i Expression of LSD1 and TSG101 in BGC-823, MGC-803 cells in the presence or absence of LSD1. The data are presented as the mean ± SD; n = 3; n.s, no significance, *P < 0.05; two-tailed unpaired Student’s t-test
Fig. 4
Fig. 4
LSD1 deletion downregulates exosomal PD-L1 in GC. a SEM images of purified exosomes from BGC-823 cells in the presence or absence of LSD1 (B-EXO and B KO-EXO, respectively, for short). Scale bar = 100 nm. b Size distribution of the BGC-823 and LSD1 deleted BGC-823 cell-derived exosomes analyzed by NTA. c Analysis of the fractions collected after sucrose gradient centrifugation at 100,000 g; pellets obtained from ultracentrifugation of BGC-823 cells supernatants. d Expression of PD-L1 in a panel of GC cell-derived exosomes. e Expression of PD-L1 in BGC-823 and MGC-803 and their corresponding LSD1-deleted cell-derived exosomes. f Expression of PD-L1 in B-EXO from cells treated with or without GSK2879552 and ORY1001. g Expression of PD-L1 in B-EXO & B KO-EXO conjugated with 5 μm beads analyzed by flow cytometry. h Expression of PD-L1 in exosomes from MGC-803 cells (M-EXO) and MGC-803 LSD1 KO cells (M KO-EXO) conjugated with 5 μm beads analyzed by flow cytometry. i Concentration of B-EXO and B KO-EXO. j Expression of PD-L1 in BGC-823 or BGC-823 LSD1 KO cells treated with or without 10 μM GW4869 for 24 h. The data are presented as the mean ± SD; n = 3; n.s, no significance, *P < 0.05; two-tailed unpaired Student’s t-test
Fig. 5
Fig. 5
LSD1 deletion reverses the direct T-cell response suppression of GC-derived exosomal PD-L1. a Representative confocal images of PKH26 stained B-EXO and B KO-EXO with wells coated with recombinant PD-1. Scale bar = 50 μm. b SEM images of the binding of T cells to B-EXO/M-EXO or B KO-EXO/M KO-EXO. Scale bar = 1 μm. c Expression of CD69 in CD8 + T cells incubated with B-EXO or B KO-EXO, respectively. NT indicates no treatment with anti-CD3/CD28 beads. d T-cell proliferation in anti-CD3/CD28-stimulated PBMC incubated with B-EXO or B KO-EXO. e and f Cell survival of BGC-823 cells co-incubated with anti-CD3/CD28 beads-activated PBMC in the presence of B-EXO or B KO-EXO. Representative images are shown on the left (e), quantification is provided on the right (f). g-i ELISA analysis of IL-2 (g), IFN-γ (h), and TNFα (i) concentration in anti-CD3/CD28-stimulated PBMC in the presence of B-EXO or B KO-EXO. The data are presented as the mean ± SD; n = 3; n.s, no significance, * P < 0.05; ** P < 0.01; *** P < 0.001; two-tailed unpaired Student’s t-test
Fig. 6
Fig. 6
LSD1 deletion reverses the inhibitory effect of GC cell-derived exosomes in T-cell response by influencing the expression of PD-L1 in target cells. a Confocal image of 20 μg/ml B-EXO or B KO-EXO that were co-incubated with MGC-803 cells for 24 h. Exosomes were stained with PKH26, followed by membrane dye DIO and nucleus dye DAPI staining. Representative confocal images are shown on the left, whereas quantification is shown on the right. Scale bar = 20 µm. b-d Membrane (b) and total expression (c and d) of PD-L1 in BGC-823 cell lines when incubated with B-EXO or B KO-EXO. e Confocal images of recombinant PD-1-Fc binding to BGC-823 cell-PD-L1 when cells were incubated with B-EXO or B KO-EXO. Cells were incubated with anti-rabbit Alexa Fluor 488 dye conjugated antibody. Scale bar = 50 μm. f Mean fluorescence intensity (MFI) of PD-1-Fc binding when cells were incubated with B-EXO or B KO-EXO. g Expression of CD69 in CD8+ T-cell when cells were incubated with B-EXO or B KO-EXO. h Cell survival of BGC-823 cells in anti-CD3/CD28-stimulated PBMC when incubated with B-EXO or B KO-EXO. The data are presented as the mean ± SD; n = 3; n.s, no significance, * P < 0.05 *** P < 0.001, two-tailed unpaired Student’s t-test
Fig. 7
Fig. 7
Exosomes from LSD1-abrogated GC cells promoted T-cell mediated tumor immunity through exosomal PD-L1 in vivo. a-c Tumor sizes (a), growth curve (b), tumor weight (c) of MFC cells in 615 mice treated with CON EXO or KO EXO in the presence of PD-1-recombinant or not (The data are presented as the mean ± SD, n = 6). d Tumor-infiltrating CD8 + T cell ratio in CD3 + T cells of MFC cells in 615 mice treated with CON EXO or KO EXO in the presence of PD-1-recombinant or not (The data are presented as the mean ± SD, n = 3). e and f Expression of CD3 and CD8 of MFC cells in 615 mice treated with CON EXO or KO EXO in the presence of PD-1-recombinant or not (The data are presented as the mean ± SD, n = 3). g and h IL-2 (g) and IFN-γ (h) levels in 615 mice tissues in different groups. Scale bar = 600 μm (The data are presented as the mean ± SD, n = 3). i Expression of PD-L1 in plasma exosomes of 615 mice treated with MFC cells in the presence or absence of LSD1. The data are presented as the mean ± SD; n.s, no significance, * P < 0.05; ** P < 0.01; *** P < 0.001, two-tailed unpaired Student’s t-test

References

    1. Shi Y, Lan F, Matson C, Mulligan P, Whetstine JR, Cole PA, Casero RA, Shi Y. Histone demethylation mediated by the nuclear amine oxidase homolog LSD1. Cell. 2004;119:941–953. - PubMed
    1. Shi YJ, Matson C, Lan F, Iwase S, Baba T, Shi Y. Regulation of LSD1 histone demethylase activity by its associated factors. Mol Cell. 2005;19:857–864. - PubMed
    1. Metzger E, Wissmann M, Yin N, Müller JM, Schneider R, Peters AH, Günther T, Buettner R, Schüle R. LSD1 demethylates repressive histone marks to promote androgen-receptor-dependent transcription. Nature. 2005;437:436–439. - PubMed
    1. Wang J, Scully K, Zhu X, Cai L, Zhang J, Prefontaine GG, Krones A, Ohgi KA, Zhu P, Garcia-Bassets I, et al. Opposing LSD1 complexes function in developmental gene activation and repression programmes. Nature. 2007;446:882–887. - PubMed
    1. Pilotto S, Speranzini V, Marabelli C, Rusconi F, Toffolo E, Grillo B, Battaglioli E, Mattevi A. LSD1/KDM1A mutations associated to a newly described form of intellectual disability impair demethylase activity and binding to transcription factors. Hum Mol Genet. 2016;25:2578–2587. - PubMed

Publication types