. 2022 Mar;10(3):e004191.
doi: 10.1136/jitc-2021-004191.

Immune system and intestinal microbiota determine efficacy of androgen deprivation therapy against prostate cancer

Affiliations

Immune system and intestinal microbiota determine efficacy of androgen deprivation therapy against prostate cancer

Safae Terrisse et al. J Immunother Cancer. 2022 Mar.

Abstract

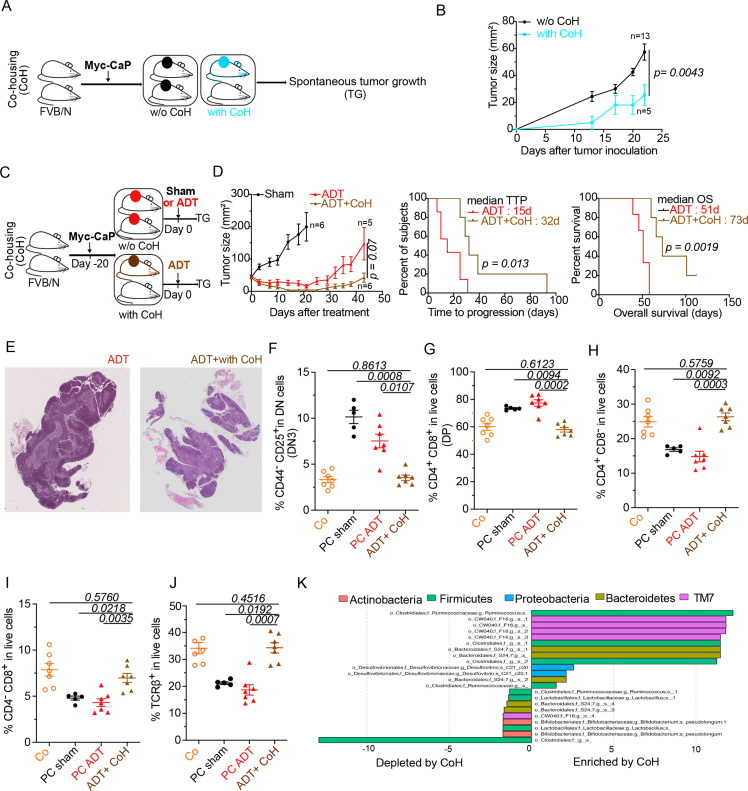
Background: Prostate cancer (PC) responds to androgen deprivation therapy (ADT) usually in a transient fashion, progressing from hormone-sensitive PC (HSPC) to castration-resistant PC (CRPC). We investigated a mouse model of PC as well as specimens from PC patients to unravel an unsuspected contribution of thymus-derived T lymphocytes and the intestinal microbiota in the efficacy of ADT.

Methods: Preclinical experiments were performed in PC-bearing mice, immunocompetent or immunodeficient. In parallel, we prospectively included 65 HSPC and CRPC patients (Oncobiotic trial) to analyze their feces and blood specimens.

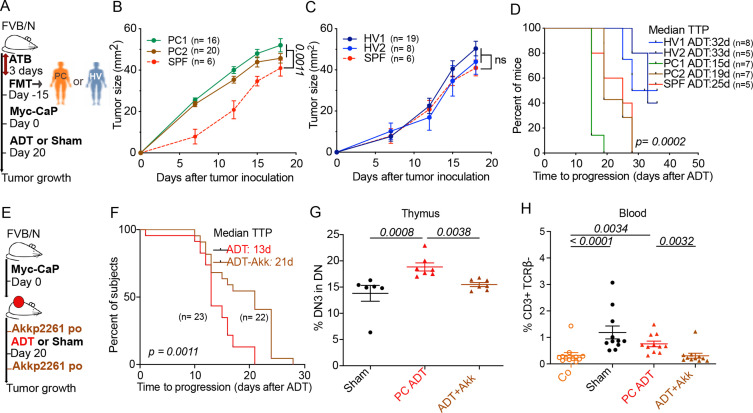
Results: In PC-bearing mice, ADT increased thymic cellularity and output. PC implanted in T lymphocyte-depleted or athymic mice responded less efficiently to ADT than in immunocompetent mice. Moreover, depletion of the intestinal microbiota by oral antibiotics reduced the efficacy of ADT. PC reduced the relative abundance of Akkermansia muciniphila in the gut, and this effect was reversed by ADT. Moreover, cohousing of PC-bearing mice with tumor-free mice or oral gavage with Akkermansia improved the efficacy of ADT. This appears to be applicable to PC patients because long-term ADT resulted in an increase of thymic output, as demonstrated by an increase in circulating recent thymic emigrant cells (sjTRECs). Moreover, as compared with HSPC controls, CRPC patients demonstrated a shift in their intestinal microbiota that significantly correlated with sjTRECs. While feces from healthy volunteers restored ADT efficacy, feces from PC patients failed to do so.

Conclusions: These findings suggest the potential clinical utility of reversing intestinal dysbiosis and repairing acquired immune defects in PC patients.

Keywords: adaptive immunity; immunomodulation; prostatic neoplasms; translational medical research.


Conflict of interest statement

Competing interests: LZ and GK are scientific cofounders of everImmune, a company that develops bacteria for the treatment of cancer. GK is a scientific cofounder of Samsara Therapeutics and Therafast Bio. Acknowledgments: LZ laboratory was supported by the Germano-French ANR Ileobiome—19-CE15-0029-01 and H2020 ONCOBIOME N°825410, RHU Torino Lumière ANR-16-RHUS-0008; Seerave Foundation; SIRIC Stratified Oncology Cell DNA Repair and Tumor Immune Elimination (SOCRATE). GK is supported by Agence Nationale de la Recherche (ANR)—Projets blancs; AMMICa US23/CNRS UMS3655; Association pour la recherche sur le cancer (ARC); Association 'Ruban Rose'; Cancéropôle Ile-de-France; Fondation pour la Recherche Médicale (FRM); a donation by Elior; Equipex Onco-Pheno-Screen; European Joint Programme on Rare Diseases (EJPRD); Gustave Roussy Odyssea, the European Union Horizon 2020 Projects Oncobiome and Crimson; Fondation Carrefour; Institut National du Cancer (INCa); Inserm (HTE); Institut Universitaire de France; LabEx Immuno-Oncology (ANR-18-IDEX-0001); the Leducq Foundation; the and SIRIC Cancer Research and Personalized Medicine (CARPEM). This study contributes to the IdEx Université de Paris ANR-18-IDEX-0001. AMT and EC are supported by the French Government’s Investissement d’Avenir Program, Laboratoire d’Excellence 'Milieu Intérieur' Grant ANR-10-LABX-69-01. INSERM U.1160 is a member of OPALE Carnot Institute, The Organization for Partnerships in Leukemia. MG-H and DGM are supported by the grant funding NIH/NCI P01 CA250927.

Figures

Figure 1
Figure 1
T cell-dependent efficacy of ADT in mice with prostate cancer (PC). (A) Experimental setup to investigate the effect of ADT in Myc-CaP prostate cancer model. (B) Tumor growth curves and representation of TTP defining hormone sensitive (HSPC) and castration resistance (CRPC) intervals. (C) Tumor growth kinetics of Myc-CaP following depletion of T cells using αCD4 and αCD8 monoclonal antibodies, 3 days before systemic therapy (ADT or sham control) and twice a week until sacrifice. (D) Kaplan-Meier curves illustrating TTP. (E, F) Tumor growth kinetics in Myc-CaP bearing nu/nu mice, treated with ADT or sham control (E) and TTP Kaplan-Meier curves (F). (G) experimental setup of thymocytes or vehicle transfer from FVB/N healthy mice to nu/nu by i.v tail injection before Myc-CaP inoculation the next day. (H) Tumor growth kinetics in the nu/nu groups compared with immunocompetent FVB/N mice. ADT, androgen deprivation therapy; TTP, time to progression.
Figure 2
Figure 2
Thymic effect of prostate cancer (PC) and ADT in mice. (A) Micrograph pictures of thymi in naïve and PC tumor- bearing mice treated with ADT. From the left to the right: hematoxylin eosin-stained thymi sections from healthy controls (CO), sham-treated PC bearing mice (PC sham), and ADT -treated PC bearing mice (PC +ADT), sacrificed at D10 post-treatment (scale bars are indicated in the graphs). (B–D). Surface assessment of overall, cortex and medulla areas in the three groups described in (A). Each dot represents one thymus. (E) Flow cytometry determination of thymocyte phenotypes at D10 post -treatment. from left to right: proportion of DN3 thymocytes (CD44-CD25+ in dn), DP thymocytes (CD3+CD4+CD8+), sp CD4+ and CD8+, and TCRβ+in live cells (F). Flow cytometry determination of circulating lymphocytes at D10 post-treatment. From left to right: proportion of dn in CD3+ cells, DP thymocytes (CD3+CD4+CD8+), sp CD4+ and CD8+, and TCRβ+ in CD3+ cells. Means±SEM are depicted for 4–12 mice/group. A representative experiment is depicted for all graphs except (F) where a pool of two experiments is shown. ANOVA statistical analyses (Kruskal-Wallis test) were used for multiple comparisons. ADT, androgen deprivation therapy; ANOVA, analysis of variance.
Figure 3
Figure 3
Relationship between ADT and gut microbiota in mice. (A) Experimental setup of Myc-CaP tumor-bearing mice treated with ADT or sham control in the presence or absence of broad-spectrum antibiotics (ATB). ATB were delivered 3 days before ADT and then, 1 week on/1 week off. (B, C) Tumor growth kinetics and TTP in the French animal facility (B) duplicated in a second independent US animal facility (C). (D) Richness of the microbiota intestinal ecosystem estimated by two different methods monitoring the alpha diversity of stools in a longitudinal and paired mouse follow-up, in samples collected before and after tumor inoculation. (E) Beta-Diversity ordination plot based on principal coordinate analysis of normalized and standardized fecal microbiota composition in paired animals before (red dots) and after (black dots) Myc-CaP inoculation. Bray-Curtis distance and weighted UniFrac distance were used as beta diversity metrics and visualized through NMDS method. (F) Bar plots of fecal species that discriminate taxonomic composition between pretumor and post-tumor inoculation in mice by DESeq2 method. (G) Idem as in (D) before and 7 days after ADT. (H) Idem as in (F) pre-ADT and post-ADT in mice. Results were confirmed in two independent experiments; one representative experiment being shown. Tumor growth curves are depicted by means±SEM of tumor sizes over time and P values were calculated using two-way ANOVA for paired repeated measures. Kaplan-Meier curves were used for TTP. The Mann-Whitney U test and the Wilcoxon signed-rank test were used to determine significant differences among the different groups according to alpha-diversity. ADT, androgen deprivation therapy; ANOVA, analysis of variance; CSS, cumulative sum scaling; NMDS, non-metric multidimensional scaling; TTP, time to progression.
Figure 4
Figure 4
Thymic and microbial effect of ADT in prostate cancer patients. (A) Routine blood monitoring of lymphocyte counts. Absolute blood lymphocyte counts in patients with HSPC at baseline (pre-ADT) and 4–6 months after ADT (post-ADT) as well as in patients with CRPC. (B, C) Flow cytometric determination of blood cell populations. Naïve CD4 +cell proportion (B) and circulating sj TREC cells (C) in patients with (HSPC) pre-ADT and 4–6 months post-ADT and in CRPC patients compared with age-matched and sex-matched healthy controls. (A–C). Each dot represents one patient. The graph depicts means±SEM of lymphocyte counts. ANOVA statistical analyses (Kruskal-Wallis test) were used for multiple comparison. (D–F) Patient fecal microbiota composition and flow cytometry-based blood analysis. Principal coordinate analysis (PcoA) using Bray-Curtis distances calculated using species level relative abundances in CRPC (dark gray dots) and HSPC patients (red dots) (D) prevalence and relative abundances of differentially abundant species between CRPC and HSPC patients (E). Associations between the overall microbial community composition and flow cytometry-based blood analyses (F). Spearman’s correlations between immune cell profiles and species’ abundances controlling for time-point, age and patient (G). ADT, androgen deprivation therapy; ANOVA, analysis of variance; CRPC, castration-resistant prostate cancer; HSPC, hormone-sensitive PC.
Figure 5
Figure 5
Co-housing (CoH) improved ADT-mediated taxonomic composition of the intestinal ecosystem and anticancer effects. (A–C) Experimental setup of cohousing experiments where tumor-bearing mice were housed with naive littermates prior to (A) or after (C) treatment with ADT. (B–D) Spontaneous and ADT-mediated tumor growth kinetics and TTP with and without cohousing and ADT (D). (E) Idem as in figure 2A. Representative animal for each micrograph picture: left and right panel (without and with cohousing) at D10 post-ADT. Bar scale: 200 mm. (F–J) Flow cytometric determination of thymocytes. proportion of DN3 thymocytes (CD44-CD25+ in dn) (F) DP thymocytes (CD3+CD4+CD8+) (G) sp CD4+ thymocytes (H) sp CD8+ thymocytes (I) and TCRβ+in live cells (J). (K) Idem as in figure 3H where metagenomic species discriminating between ADT-treated cohoused and non-cohoused mice. Tumor growth curves are depicted showing means±SEM of tumor sizes over time and p values were calculated using two-way ANOVA for paired repeated measures. Kaplan Meier curves were used for TTP and OS. A typical experiment comprizing at least 5 males/group is depicted, out of 2–3 experiments conducted and yielding similar conclusions. ADT, androgen deprivation therapy; ANOVA, analysis of variance; OS, overall survival; TTP, time to progression.
Figure 6
Figure 6
Improving ADT antitumor effects using FMT or Akkermansiap2261 (Akkp2261) (A) Experimental setup of FMT of stool samples from hormone sensitive patient (PC1) and CRPC patient (PC2) and 2 healthy volunteers (HV1 and HV2). (B) ADT-induced tumor growth after FMT from hormone sensitive patient (PC1) and CRPC patient (PC2) compared with mice without FMT under SPF conditions. (C) Idem as in (B) using FMT from healthy volunteers (HV1 and HV2). (D) TTP Kaplan-Meier curves post-ADT in different FMT arms (PC1, PC2, HV1, HV2, SPF). (E) Experimental setup using oral administration of Akkp2261 or PBS vehicle just before and next after ADT. (F) TTP Kaplan-Meier curves post-ADT with or without Akkp2261. (G–H) Flow cytometric determination of thymic (G) and blood lymphocytes (H) at day 10 post-ADT. Proportion of DN3 thymocytes (CD44-CD25+ in DN) and blood CD3+ TCRβ- δ- in three different groups: sham control, ADT without and with A. muciniphila. Results from one representative experiment out of two or a pool of two experiments are shown. At least five mice per experimental condition. Each dot represents one animal. P values were calculated using two-way ANOVA for paired repeated measures. Kaplan-Meier curves were used for TTP and OS. ADT, androgen deprivation therapy; ANOVA, analysis of variance; CRPC castration-resistant prostate cancer; FMT, fecal microbiota transplantation; OS, overall survival; SPF, specific pathogen-free; PBS, phosphate-buffered saline; TTP, time to progression.

Similar articles

Cited by

References

    1. Beyer K, Moris L, Lardas M, et al. . Diagnostic and prognostic factors in patients with prostate cancer: a systematic review protocol. BMJ Open 2021;11:e040531. 10.1136/bmjopen-2020-040531 - DOI - PMC - PubMed
    1. Tong D. Unravelling the molecular mechanisms of prostate cancer evolution from genotype to phenotype. Crit Rev Oncol Hematol 2021;163:103370. 10.1016/j.critrevonc.2021.103370 - DOI - PubMed
    1. Lokeshwar SD, Klaassen Z, Saad F. Treatment and trials in non-metastatic castration-resistant prostate cancer. Nat Rev Urol 2021;18:433–42. 10.1038/s41585-021-00470-4 - DOI - PubMed
    1. Schmidt KT, Huitema ADR, Chau CH, et al. . Resistance to second-generation androgen receptor antagonists in prostate cancer. Nat Rev Urol 2021;18:209–26. 10.1038/s41585-021-00438-4 - DOI - PubMed
    1. Flammiger A, Bayer F, Cirugeda-Kühnert A, et al. . Intratumoral T but not B lymphocytes are related to clinical outcome in prostate cancer. APMIS 2012;120:901–8. 10.1111/j.1600-0463.2012.02924.x - DOI - PubMed

Publication types

LinkOut - more resources