

Antibody decay, T cell immunity and breakthrough infections following two SARS-CoV-2 vaccine doses in inflammatory bowel disease patients treated with infliximab and vedolizumab
- PMID: 35296643
- PMCID: PMC8927425
- DOI: 10.1038/s41467-022-28517-z
Antibody decay, T cell immunity and breakthrough infections following two SARS-CoV-2 vaccine doses in inflammatory bowel disease patients treated with infliximab and vedolizumab
Abstract
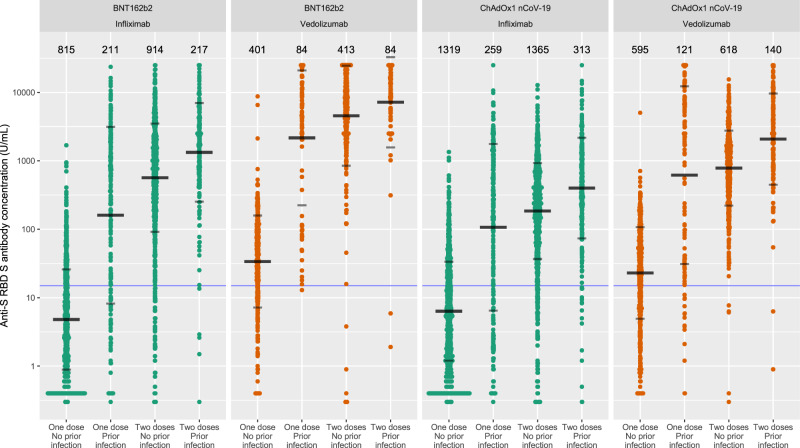
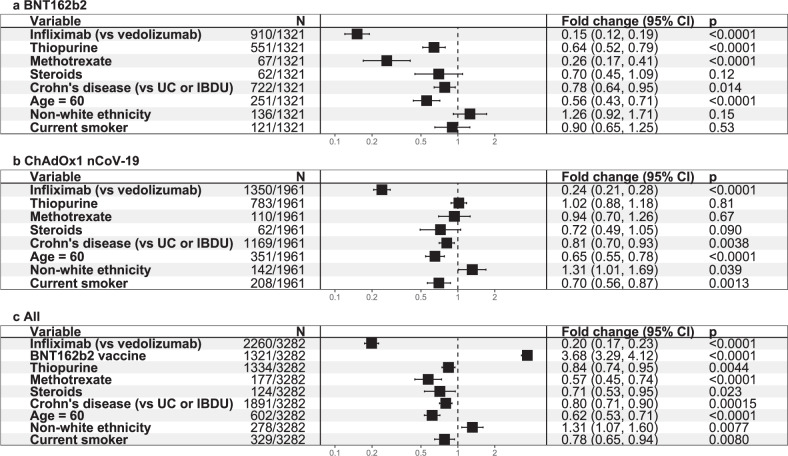
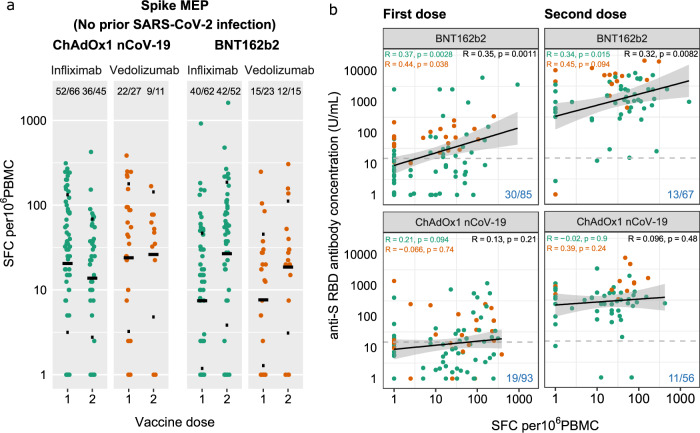
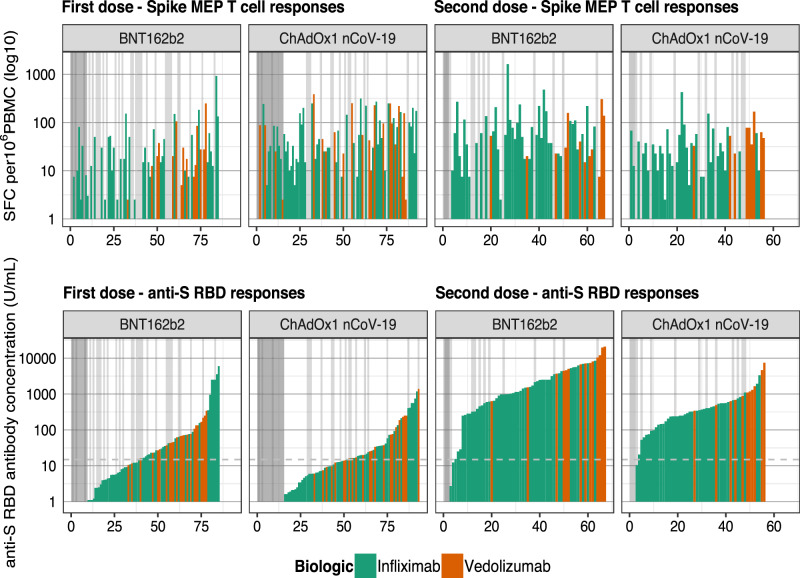
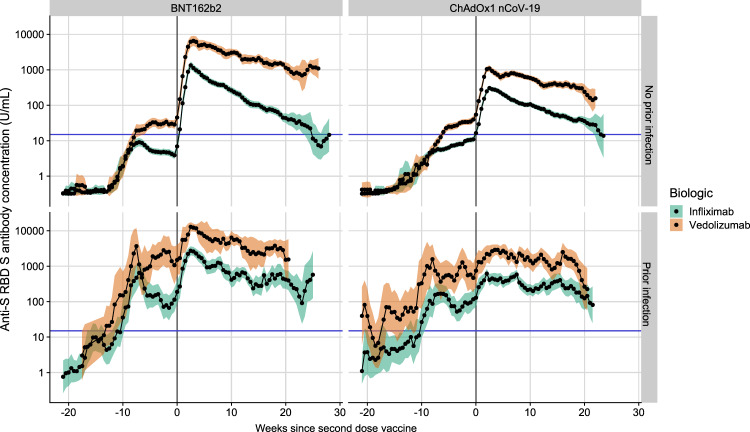
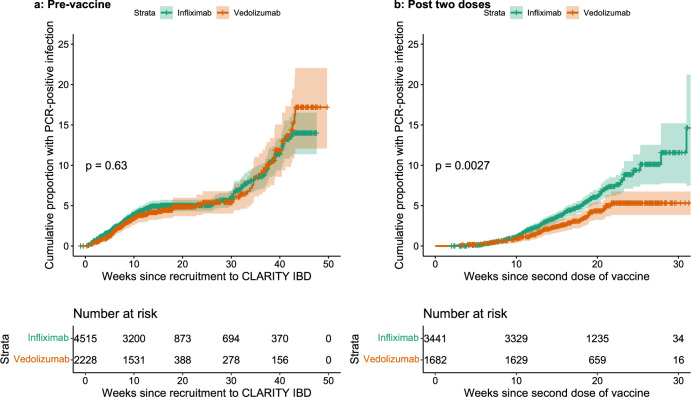
Anti tumour necrosis factor (anti-TNF) drugs increase the risk of serious respiratory infection and impair protective immunity following pneumococcal and influenza vaccination. Here we report SARS-CoV-2 vaccine-induced immune responses and breakthrough infections in patients with inflammatory bowel disease, who are treated either with the anti-TNF antibody, infliximab, or with vedolizumab targeting a gut-specific anti-integrin that does not impair systemic immunity. Geometric mean [SD] anti-S RBD antibody concentrations are lower and half-lives shorter in patients treated with infliximab than vedolizumab, following two doses of BNT162b2 (566.7 U/mL [6.2] vs 4555.3 U/mL [5.4], p <0.0001; 26.8 days [95% CI 26.2 - 27.5] vs 47.6 days [45.5 - 49.8], p <0.0001); similar results are also observed with ChAdOx1 nCoV-19 vaccination (184.7 U/mL [5.0] vs 784.0 U/mL [3.5], p <0.0001; 35.9 days [34.9 - 36.8] vs 58.0 days [55.0 - 61.3], p value < 0.0001). One fifth of patients fail to mount a T cell response in both treatment groups. Breakthrough SARS-CoV-2 infections are more frequent (5.8% (201/3441) vs 3.9% (66/1682), p = 0.0039) in patients treated with infliximab than vedolizumab, and the risk of breakthrough SARS-CoV-2 infection is predicted by peak anti-S RBD antibody concentration after two vaccine doses. Irrespective of the treatments, higher, more sustained antibody levels are observed in patients with a history of SARS-CoV-2 infection prior to vaccination. Our results thus suggest that adapted vaccination schedules may be required to induce immunity in at-risk, anti-TNF-treated patients.
© 2022. The Author(s).
Conflict of interest statement
Dr. S Lin reports non-financial support from Pfizer, non-financial support from Ferring, outside the submitted work. Dr. Kennedy reports grants from F. Hoffmann-La Roche AG, grants from Biogen Inc, grants from Celltrion Healthcare, grants from Galapagos NV, non-financial support from Immundiagnostik, during the conduct of the study; grants and non-financial support from AbbVie, grants and personal fees from Celltrion, personal fees and non-financial support from Janssen, personal fees from Takeda, personal fees and non-financial support from Dr. Falk, outside the submitted work. Dr. Saifuddin has received travel expense support from Dr. Falk Pharma. Dr. Chee reports non-financial support from Ferring, personal fees and non-financial support from Pfizer, outside the submitted work. Prof. Sebastian reports grants from Takeda, Abbvie, AMGEN, Tillots Pharma, personal fees from Jaansen, Takeda, Galapagos, Celltrion, Falk Pharma, Tillots pharma, Cellgene, Pfizer, Pharmacocosmos, outside the submitted work. Dr. Alexander reports sponsorship from Vifor Pharma for accommodation/travel to BSG 2019, outside the submitted work. Dr. Lee reports personal fees from Abbvie, personal fees from C4X Discovery, personal fees from PredictImmune and personal fees from AG pus diagnostics. Dr. Hart reports personal fees from Abbvie, personal fees from Allergan, personal fees from BMS, personal fees from Celltrion, personal fees from Falk, personal fees from GSK, personal fees from Takeda, personal fees from Pfizer, personal fees from Janssen, personal fees from Galapogos, personal fees from AstraZeneca, outside the submitted work. Dr. Irving reports grants and personal fees from Takeda, grants from MSD, grants and personal fees from Pfizer, personal fees from Galapagos, personal fees from Gilead, personal fees from Abbvie, personal fees from Janssen, personal fees from Boehringer Ingelheim, personal fees from Topivert, personal fees from VH2, personal fees from Celgene, personal fees from Arena, personal fees from Samsung Bioepis, personal fees from Sandoz, personal fees from Procise, personal fees from Prometheus, outside the submitted work. Dr. Jones has received speaker fees from Takeda, Ferring and Janssen. Dr. Kok reports personal fees from Janssen, personal fees from Takeda, personal fees from PredictImmune, personal fees from Amgen, outside the submitted work. Dr. Lamb reports grants from Genentech, grants and personal fees from Janssen, grants and personal fees from Takeda, grants from AbbVie, personal fees from Ferring, grants from Eli Lilly, grants from Pfizer, grants from Roche, grants from UCB Biopharma, grants from Sanofi Aventis, grants from Biogen IDEC, grants from Orion OYJ, personal fees from Dr. Falk Pharma, grants from Astra Zeneca, outside the submitted work. Prof. Lees reports personal fees from Abbvie, personal fees from Janssen, personal fees from Pfizer, personal fees from Takeda, grants from Gilead, personal fees from Gilead, personal fees from Galapagos, personal fees from Iterative Scopes, personal fees from Trellus Health, personal fees from Celltion, personal fees from Ferring, personal fees from BMS, during the conduct of the study. Prof Boyton and Prof Altmann are members of the Global T cell Expert Consortium and have consulted for Oxford Immunotec outside the submitted work. Dr. Goodhand reports grants from F. Hoffmann-La Roche AG, grants from Biogen Inc, grants from Celltrion Healthcare, grants from Galapagos NV, non-financial support from Immundiagnostik, during the conduct of the study. Dr. Powell reports personal fees from Takeda, personal fees from Janssen, personal fees from Pfizer, personal fees from Bristol-Myers Squibb, personal fees from Abbvie, personal fees from Roche, personal fees from Lilly, personal fees from Allergan, personal fees from Celgene, outside the submitted work; and Dr. Powell has served as a speaker/advisory board member for Abbvie, Allergan, Bristol-Myers Squibb, Celgene, Falk, Ferring, Janssen, Pfizer, Tillotts, Takeda and Vifor Pharma. Prof. Ahmad reports grants and non-financial support from F. Hoffmann-La Roche AG, grants from Biogen Inc, grants from Celltrion Healthcare, grants from Galapagos NV, non-financial support from Immundiagnostik, during the conduct of the study; personal fees from Biogen inc, grants and personal fees from Celltrion Healthcare, personal fees and non-financial support from Immundiagnostik, personal fees from Takeda, personal fees from ARENA, personal fees from Gilead, personal fees from Adcock Ingram Healthcare, personal fees from Pfizer, personal fees from Genentech, non-financial support from Tillotts, outside the submitted work. The following authors have nothing to declare: Diana Muñoz Sandoval, Catherine Reynolds, Rocio Castro Seoane, Sherine H Kottoor, Franziska Pieper, Kai-Min Lin, David Butler, Neil Chanchlani, Claire Bewshea, Rachel Nice, Laura Constable, Charles D Murray, Timothy J McDonald.
Figures
References
Publication types
MeSH terms
Substances
Grants and funding
LinkOut - more resources
Full Text Sources
Medical
Miscellaneous
