. 2022 Mar 16;13(1):1380.
doi: 10.1038/s41467-022-28907-3.

Indisulam targets RNA splicing and metabolism to serve as a therapeutic strategy for high-risk neuroblastoma

Affiliations

Indisulam targets RNA splicing and metabolism to serve as a therapeutic strategy for high-risk neuroblastoma

Anke Nijhuis et al. Nat Commun. .

Abstract

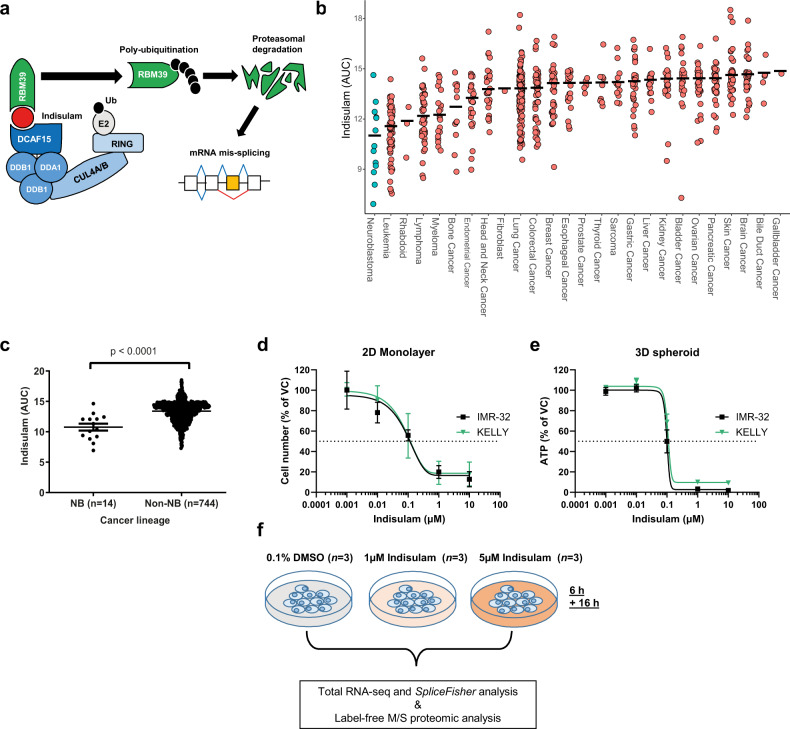
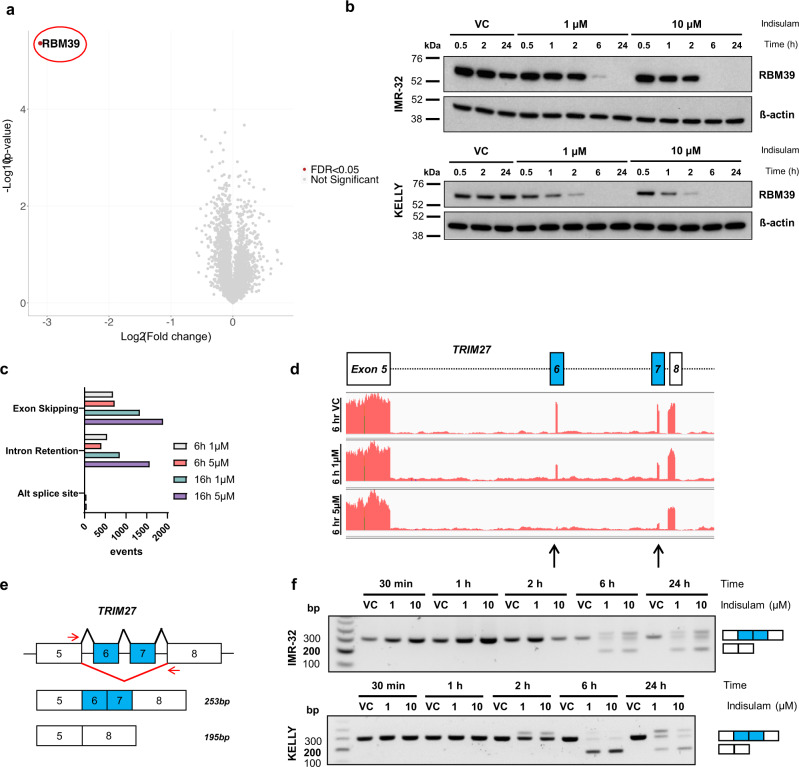
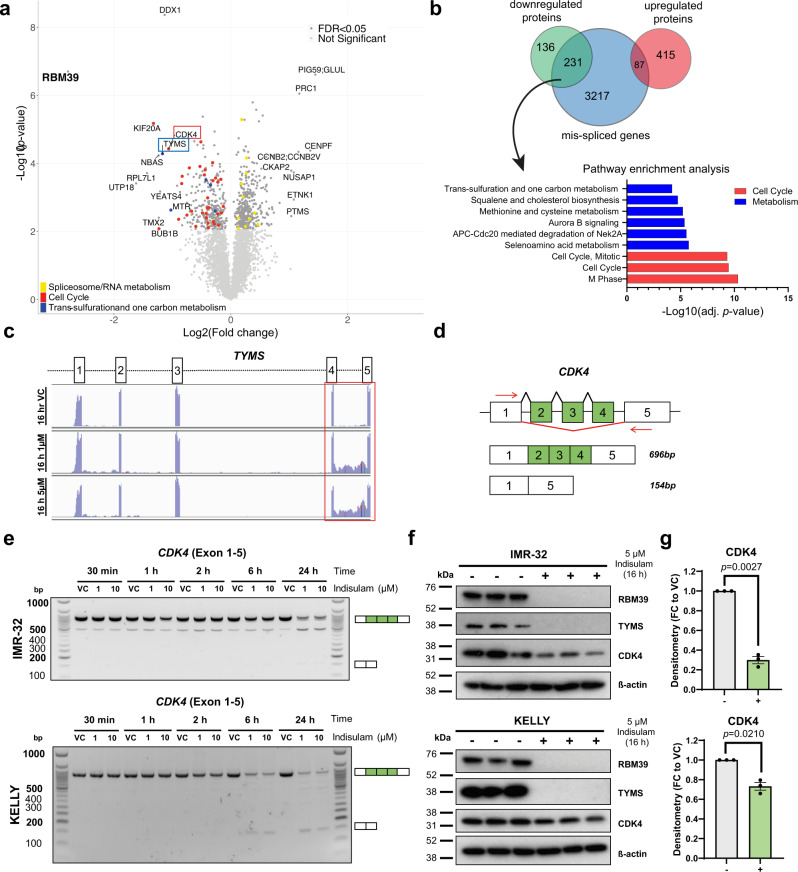
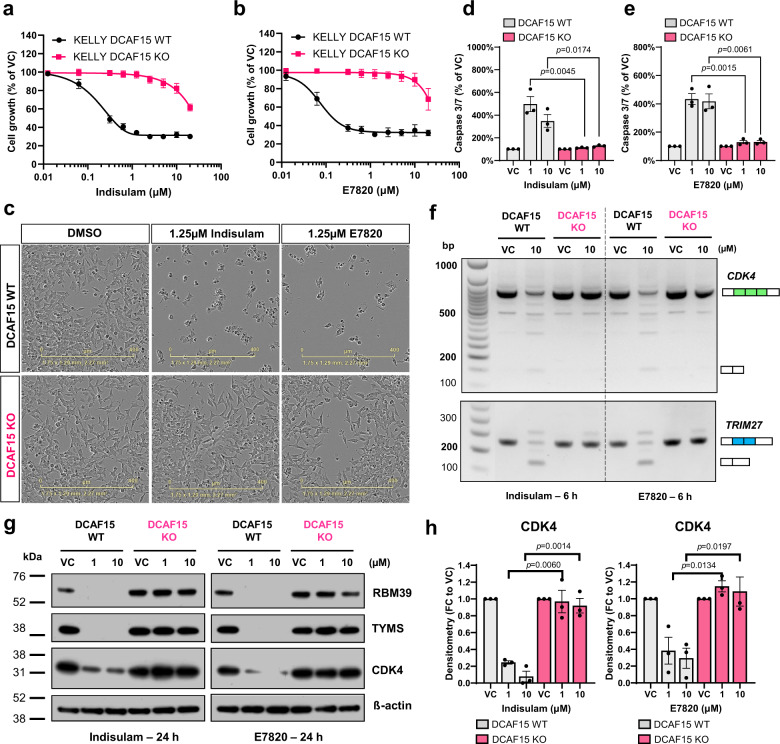
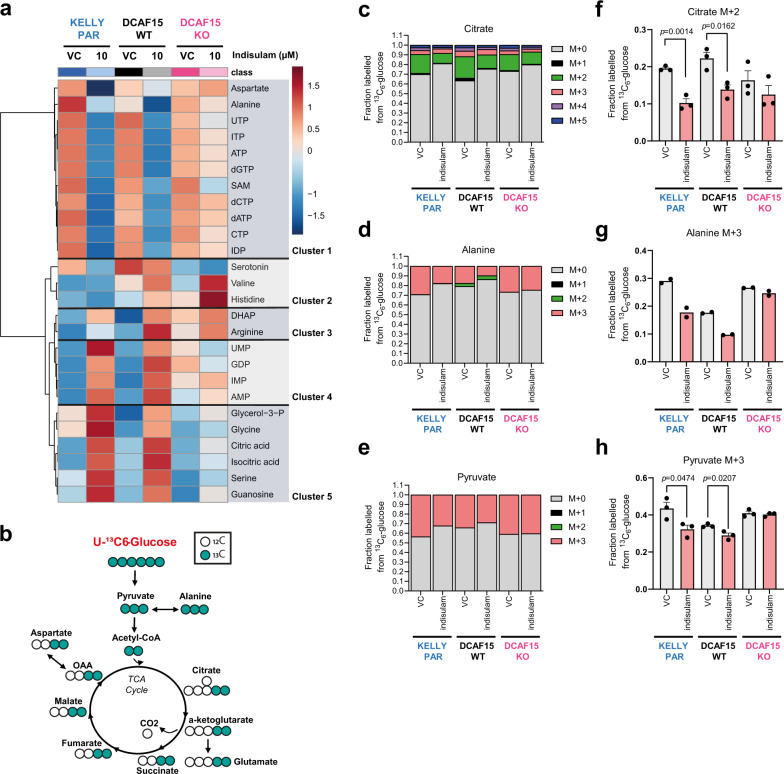
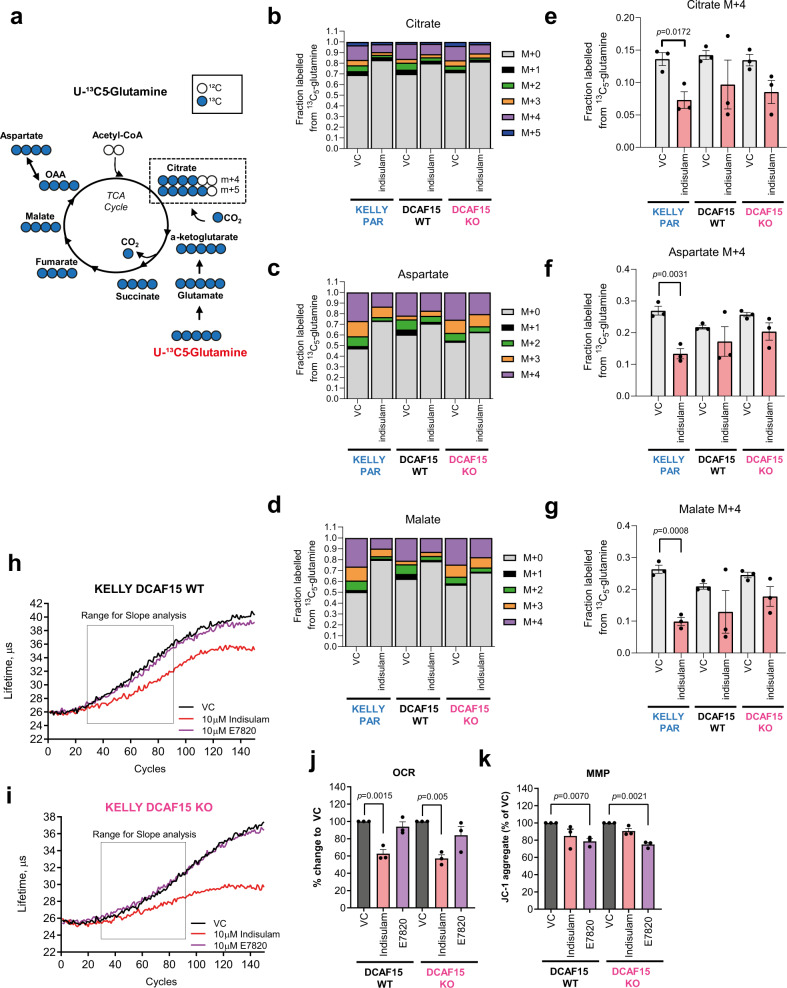
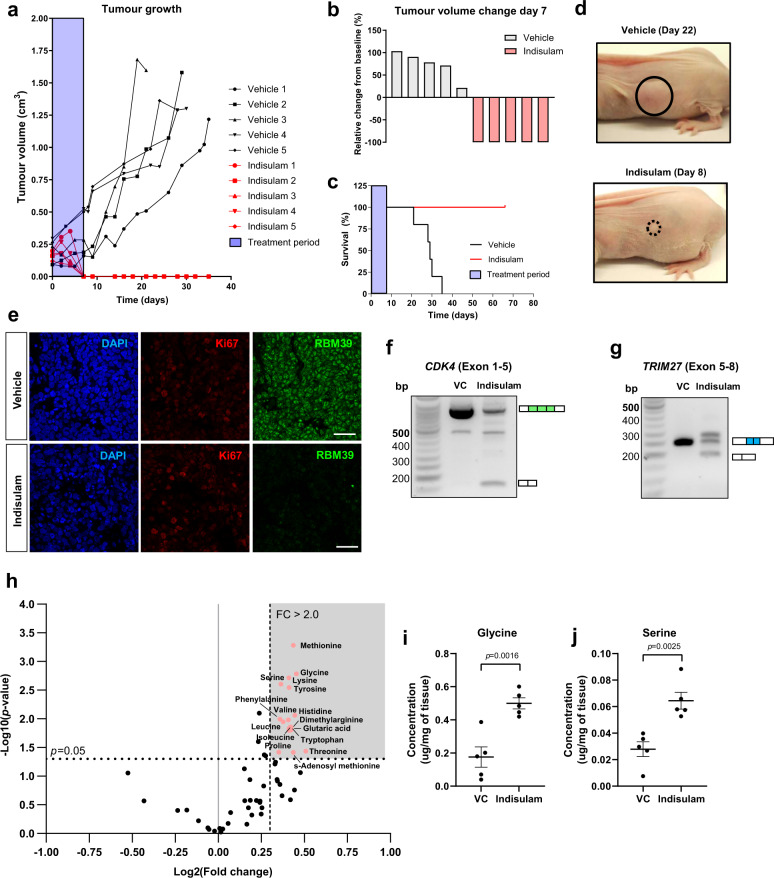
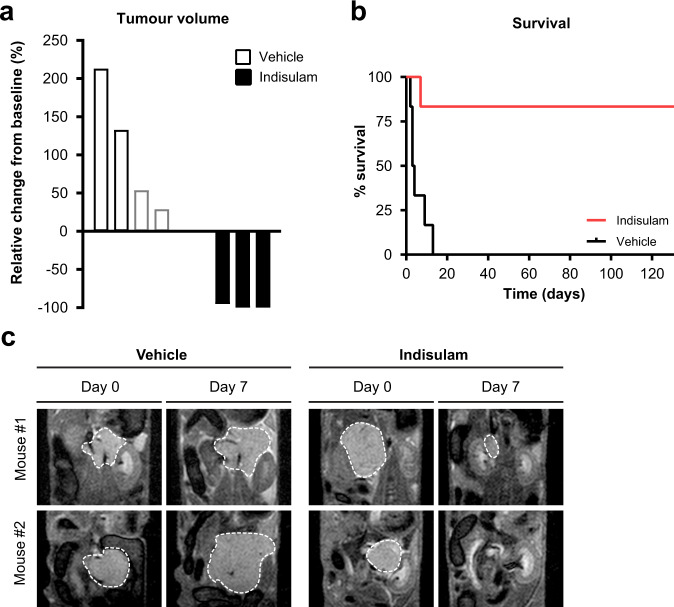
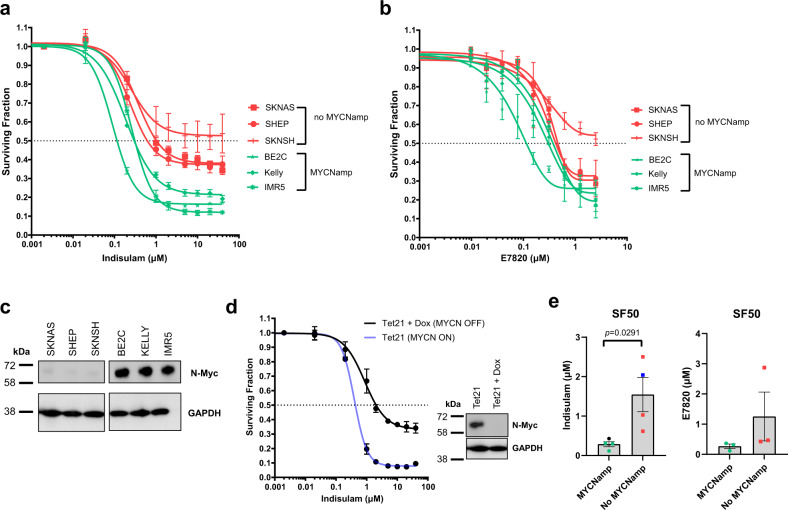
Neuroblastoma is the most common paediatric solid tumour and prognosis remains poor for high-risk cases despite the use of multimodal treatment. Analysis of public drug sensitivity data showed neuroblastoma lines to be sensitive to indisulam, a molecular glue that selectively targets RNA splicing factor RBM39 for proteosomal degradation via DCAF15-E3-ubiquitin ligase. In neuroblastoma models, indisulam induces rapid loss of RBM39, accumulation of splicing errors and growth inhibition in a DCAF15-dependent manner. Integrative analysis of RNAseq and proteomics data highlight a distinct disruption to cell cycle and metabolism. Metabolic profiling demonstrates metabolome perturbations and mitochondrial dysfunction resulting from indisulam. Complete tumour regression without relapse was observed in both xenograft and the Th-MYCN transgenic model of neuroblastoma after indisulam treatment, with RBM39 loss, RNA splicing and metabolic changes confirmed in vivo. Our data show that dual-targeting of metabolism and RNA splicing with anticancer indisulam is a promising therapeutic approach for high-risk neuroblastoma.


Conflict of interest statement

The authors declare no competing interests.

Figures

Fig. 1
Fig. 1. Indisulam is highly efficacious in in vitro models of neuroblastoma.
a Aryl sulfonamides such as indisulam (red) act as a molecular glue bringing together DCAF15 E3 ubiquitin ligase and RNA binding protein RBM39 resulting in poly-ubiquitination and degradation of the protein. Depletion of RBM39 leads to aberrant splicing defects. b. Median indisulam area-under-curve (AUC) in cell lines from 26 tumour origins. Data was acquired from the CTD2 network, each circle represents one cell line. c Indisulam AUC of 14 neural-crest derived neuroblastoma (NB) compared to non-NB cell lines (all other cancer lineages, n = 744 cell lines). Each circle represents one cell line. Data were acquired from the CTD2 network d Neuroblastoma lines IMR-32 and KELLY were treated with a 5-point dose-response of indisulam or vehicle control (VC, 0.1% DMSO) for 72 h. Cell growth determined by SRB assay (n = 3 independent experiments). e IMR-32 and KELLY cells were grown in 3D spheroids and treated with indisulam or VC (0.1% DMSO) for 72 h. ATP was measured with Cell-Titre-Glo 3D. (IMR-32 n = 3 independent experiments, KELLY n = 2 independent experiments). f Overview of workflow of proteomic and RNAseq analysis in IMR-32. Data are represented as mean values ± SD. d, e Statistical significance in c was determined by a Mann Whitney test. Source data is provided as a Source Data File.
Fig. 2
Fig. 2. Indisulam causes selective degradation of RBM39 and subsequent mis-splicing of RNA.
a Volcano plot of proteomic analysis in IMR-32 cells treated with 5 µM indisulam or VC (0.1% DMSO) for 6 h. RBM39 is highlighted in red. b Western blot of IMR-32 and KELLY cells treated with vehicle control (VC), 1 or 10 µM indisulam for 0.5–24 h. Representative blot for n = 2 independent experiments. c Number of RNA splicing events (SpliceFisher analysis, n = 3 independent experiments) in IMR-32 cells following treatment with VC or 5 µM indisulam for 6 or 16 h. d RNA read counts of TRIM27 (exon 5–8) in IMR-32 cells treated with VC (top), 1 µM (middle), or 5 µM (bottom) indisulam for 6 h. Black arrows indicate loss of exons 6 and 7. Plot generated with IGV. e Diagram of custom primers to detect skipping of exon 6 and 7 of TRIM27. f PCR of TRIM27 (exon 5–8) in IMR-32 (top) and KELLY (bottom) cells treated with VC, 1 or 10 µM indisulam for 0.5–24 h. Representative blot for n = 2 independent experiments. Source data is provided as a Source Data File.
Fig. 3
Fig. 3. Indisulam-mediated RBM39 degradation leads to the mis-splicing and depletion of proteins regulating cell cycle and metabolism.
a Volcano plot of proteomic analysis in IMR-32 cells treated with 5 µM indisulam or Vehicle control (VC, 0.1% DMSO) for 16 h. b Overlap of splicing events (exon skipping and intron retention) with up or down-regulated proteins after 16 h of Indisulam. Gene ontology analysis of mis-spliced down-regulated proteins and pathway analysis. c RNA Read counts of TYMS (exon 1–5) in IMR-32 cells treated with VC (top), 1 µM (middle) or 5 µM (bottom) indisulam for 16 h. The red box indicates intron retention between exon 4 and 5. d Diagram of custom primers to detect skipping of exon 2–4 of CDK4. e PCR of CDK4 (exon 1–5) in IMR-32 (top) and KELLY (bottom) cells treated with VC, 1 µM or 10 µM indisulam for 0.5–24 h. Representative blot for n = 2 independent experiments. f Western blot analysis of IMR-32 (top) and KELLY (bottom) following treatment of VC or 5 µM indisulam for 16 h. Membranes probed for RBM39, TYMS, CDK4 and ß-actin (n = 3 independent experiments). g Densitometry analysis of CDK4 in IMR-32 (top) and KELLY (bottom). Data are presented as mean values ± SEM. Statistical significance was determined by a two-tailed one-sample t-test. Source data is provided as a Source Data File.
Fig. 4
Fig. 4. RBM39 degradation and RNA mis-splicing via aryl sulfonamides is DCAF15 dependent.
a, b KELLY DCAF15WT or DCAF15KO cell line treated with aryl sulfonamide indisulam (a) or E7820 (b) for 72 h. Cell growth was measured by SRB assay. n = 3 independent experiments. c Representative images of KELLY DCAF15WT or DCAF15KO cells treated with 1.25 μM indisulam or E7820 (IncuCyte, Sartorius) (n = 3 independent experiments). The scale bar is 400 µm. d, e Caspase 3/7 signal following 48 h treatment of indisulam (d) or E7820 (e). Data normalised to cell mass (SRB) (n = 3 independent experiments). f PCR gel depicting exon skipping of CDK4 (exon 2–4) and TRIM27 (exon 6–7) of KELLY DCAF15WT or DCAF15KO cells treated with indisulam or E7820. Representative image of n = 3 independent experiments. g Western blot analysis of RBM39, TYMS, CDK4 and β-actin following 24 h treatment of indisulam or E7820 (representative blot of n = 3 independent experiments). h Densitometry of CDK4 protein analysis of (g). Data are presented as mean values ± SD (a, b) or SEM (d, e, h). Statistical significance in (d, e, h) was determined by a two-tailed unpaired t-test. Source data are provided as a Source Data File.
Fig. 5
Fig. 5. Indisulam modulates the metabolome and glucose utilisation.
a KELLY Parental (PAR), DCAF15WT or DCAF15KO dosed with vehicle control (VC, 0.1% DMSO) or 10 µM indisulam for 24 h and intracellular metabolites analysed by HILIC LC–MS/MS. Heatmap showing hierarchal clustering of significantly altered metabolites (p-adj < 0.001, Kruskal–Wallis test, MetaboAnalyst). Data are an average of four technical replicates of n = 2 independent experiments. b Schematic representation of enrichment of 13C derived from 13C6-glucose into TCA cycle intermediates detected by GC-MS. ch KELLY PARENTAL (PAR), DCAF15WT or DCAF15KO cells were exposed to indisulam in the presence of 5.6 mM 13C6-glucose for 24 h. Fraction of carbons labelled from 13C6-Glucose in Citrate (c), Alanine (d) and Pyruvate (e). M + n: a metabolite with n carbon atoms labelled with 13C. Data are mean of n = 3 independent experiments, n = 2 for Alanine. Changes in M + 2 labelled Citrate (f), M + 3 labelled Alanine (g) and M + 3 labelled Pyruvate (h) following indisulam exposure. (n = 3 independent experiments, n = 2 for Alanine). Data are presented as mean values ± SEM (fh). Statistical significance in f and h was determined by a two-sided unpaired t-test. Source data is provided as a Source Data File. UTP uridine triphosphate, ITP inosine triphosphate, ATP adenosine triphosphate, dGTP deoxyguanosine triphosphate, SAM S-Adenosyl methionine, dCTP deoxycytidine triphosphate, dATP deoxyadenosine triphosphate, CTP cytidine triphosphate, IDP inosine diphosphate, DHAP dihydroxyacetone phosphate, UMP uridine monophosphate, GDP guanosine diphosphate, IMP inosine monophosphate, AMP adenosine monophosphate.
Fig. 6
Fig. 6. Indisulam modulates glutamine utilisation and mitochondrial oxidation.
a Schematic representation of enrichment of 13C derived from 13C5-glutamine into TCA cycle intermediates detected by GC-MS. bg KELLY PARENTAL (PAR), DCAF15WT or DCAF15KO cells were exposed to 10 µM indisulam in the presence of 2 mM 13C5-glutamine for 24 h. Fraction of carbons labelled from 13C5-glutamine in Citrate (b), Aspartate (c) and Malate (d). M + n: a metabolite with n carbon atoms labelled with 13C. Data are the mean of three independent experiments. Changes in M + 4 labelled Citrate (e), Aspartate (f) and Malate (g) following indisulam exposure (n = 3 independent experiments). hj Lifetime measurements of MX-Xtra probe in KELLY DCAF15WT (h) and DCAF15KO (i) treated with VC (0.1% DMSO), 10 µM indisulam or 10 µM E7820. Representative data for n = 3 independent experiments. j Oxygen Consumption Rate (OCR) measures in a lifetime (µs) per h. Data are normalised to VC treatment (n = 3 independent experiments). k Mitochondrial Membrane Potential (MMP) of KELLY DCAF15WT or DCAF15KO cells treated with VC (0.1% DMSO), 10 µM indisulam or 10 µM E7820. Measured as JC-1 aggregates, normalised to VC. Data are presented as mean values ± SEM. Statistical analysis in eg was determined by a two-sided unpaired t-test, and in j and k by a two-sided one-sample t-test. Source data is provided as a Source Data File.
Fig. 7
Fig. 7. Indisulam is efficacious in IMR-32 neuroblastoma in vivo xenografts.
a Tumour growth in mice bearing IMR-32 xenografts treated with either vehicle (n = 5) or indisulam (n = 5) for 8 days. Tumour volume measured every 2–3 days until the humane end-point was reached. b Waterfall plot showing relative changes in tumour volume of xenografts at Day 7. c Survival plot of mice bearing IMR-32 xenografts. d Representative images of IMR-32 xenografts treated with vehicle (Day 22) or indisulam (Day 8). e Immunofluorescent staining of RBM39 and Ki67 in IMR-32 xenograft bearing mice treated with vehicle or indisulam after 4 days. The scale bar is 20 µm f. PCR of CDK4 in IMR-32 xenograft tumour treated with vehicle or indisulam. g. PCR of TRIM27 in IMR-32 xenograft tumour treated with vehicle or indisulam. h. Volcano plot of metabolites in IMR-32 xenograft tissues detected by LC-MS (HILIC method). i. Glycine and serine changes were detected in xenograft tumours (n = 5 samples per group). Data are presented as mean ± SEM. Statistical analysis in i and j was determined by a two-tailed unpaired t-test. Source data is provided as a Source Data File.
Fig. 8
Fig. 8. Indisulam is efficacious in the Th-MYCN transgenic mouse model of neuroblastoma.
a Waterfall plot showing the relative changes in tumour volume in the Th-MYCN transgenic mice treated for 7 days with indisulam (n = 3 mice) or vehicle control (n = 4 mice) measured by MRI. Note that the mice represented by the grey bars reached the tumour size study endpoint (palpation) before their Day 7 MRI scan and the data shown for these two mice are the relative changes in volume following day 3 of treatment with indisulam. b Survival of mice treated with vehicle (n = 6 mice) or indisulam (n = 6 mice). One mouse in indisulam treated group died on day 7. The autopsy revealed no presence of tumour but evidence of bowel obstruction. c Representative anatomical coronal T2-weighted MRI of the abdomen of Th-MYCN mice prior (day 0) and following seven days of treatment with indisulam or vehicle control. A dashed white line indicates the tumour circumference. Source data is provided as a Source Data File.
Fig. 9
Fig. 9. MYCN expression is a determinant of indisulam sensitivity in neuroblastoma.
a, b Dose–response curve in six neuroblastoma lines, three without and three with MYCN amplification of indisulam (a) or E7820 (b). Cell survival was determined after 72 h with Cell-Titre Glo (n = 3 independent experiments). c Western blot for N-Myc and GAPDH on six neuroblastoma lines. d Dose–response curve in Tet21 MYCN ON or MYCN OFF (treated with 1 µg ml−1 doxycycline) of indisulam. Cell survival was determined after 72 h with Cell-Titre Glo (n = 3 independent experiments). Western blot of n-Myc and GAPDH. Blot is representative of n = 3 independent experiments. e 50% Surviving Fraction (SF50) of neuroblastoma cells (dots represent mean SF50 of n = 3 independent experiments) treated with indisulam (n = 8 cell lines, 3 MYCNamp, 3 no MYCNamp, 2 Tet21) or E7820 (n = 6 cell lines, 3 MYCNamp, 3 no MYCNamp). Data are presented as mean ± SD (a, b, d) or SEM (e). Statistical analysis in e was determined by a two-tailed unpaired t-test. Source data is provided as a Source Data File.

References

    1. London WB, et al. Clinical and biologic features predictive of survival after relapse of neuroblastoma: a report from the International Neuroblastoma Risk Group project. J. Clin. Oncol. 2011;29:3286–3292. - PMC - PubMed
    1. Colon NC, Chung DH. Neuroblastoma. Adv. Pediatr. 2011;58:297–311. - PMC - PubMed
    1. Owa T, et al. Discovery of novel antitumor sulfonamides targeting G1 phase of the cell cycle. J. Med. Chem. 1999;42:3789–3799. - PubMed
    1. Yoshino H, et al. Novel sulfonamides as potential, systemically active antitumor agents. J. Med. Chem. 1992;35:2496–2497. - PubMed
    1. Fukuoka K, et al. Mechanisms of action of the novel sulfonamide anticancer agent E7070 on cell cycle progression in human non-small cell lung cancer cells. Invest. N. Drugs. 2001;19:219–227. - PubMed

Publication types

Substances