. 2022 Mar 16;10(1):29.
doi: 10.1038/s41413-022-00197-x.

LncRNA GACAT2 binds with protein PKM1/2 to regulate cell mitochondrial function and cementogenesis in an inflammatory environment

Affiliations

LncRNA GACAT2 binds with protein PKM1/2 to regulate cell mitochondrial function and cementogenesis in an inflammatory environment

Xuan Li et al. Bone Res. .

Abstract

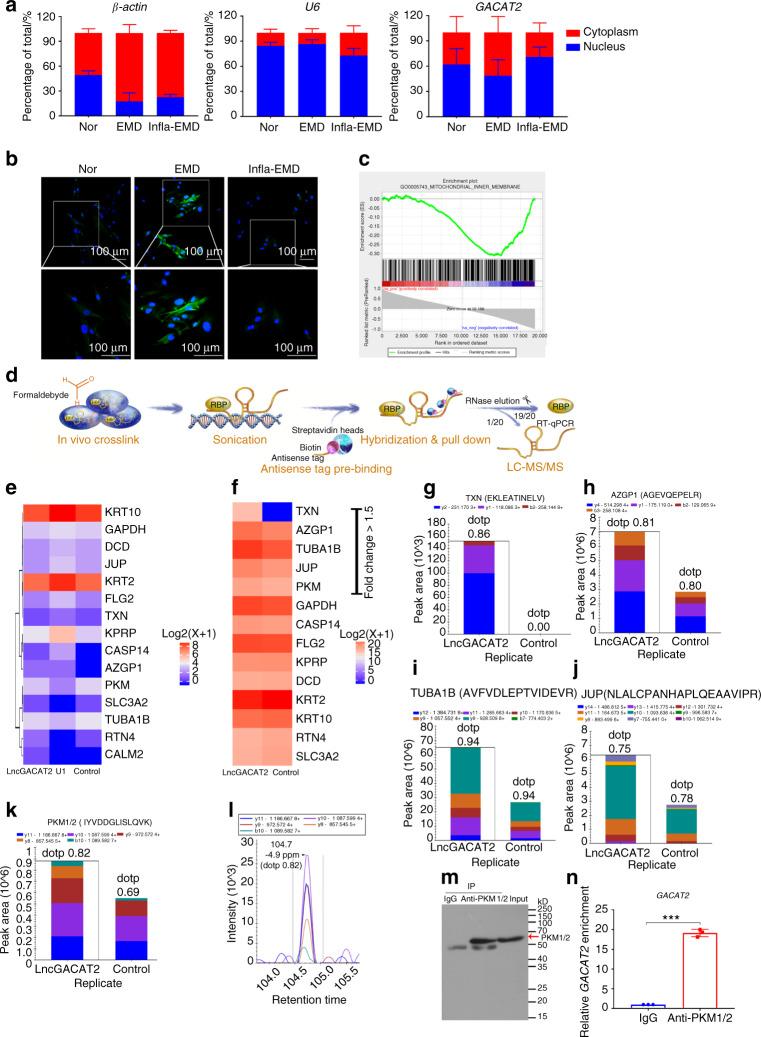
Periodontal ligament stem cells (PDLSCs) are a key cell type for restoring/regenerating lost/damaged periodontal tissues, including alveolar bone, periodontal ligament and root cementum, the latter of which is important for regaining tooth function. However, PDLSCs residing in an inflammatory environment generally exhibit compromised functions, as demonstrated by an impaired ability to differentiate into cementoblasts, which are responsible for regrowing the cementum. This study investigated the role of mitochondrial function and downstream long noncoding RNAs (lncRNAs) in regulating inflammation-induced changes in the cementogenesis of PDLSCs. We found that the inflammatory cytokine-induced impairment of the cementogenesis of PDLSCs was closely correlated with their mitochondrial function, and lncRNA microarray analysis and gain/loss-of-function studies identified GACAT2 as a regulator of the cellular events involved in inflammation-mediated mitochondrial function and cementogenesis. Subsequently, a comprehensive identification of RNA-binding proteins by mass spectrometry (ChIRP-MS) and parallel reaction monitoring (PRM) assays revealed that GACAT2 could directly bind to pyruvate kinase M1/2 (PKM1/2), a protein correlated with mitochondrial function. Further functional studies demonstrated that GACAT2 overexpression increased the cellular protein expression of PKM1/2, the PKM2 tetramer and phosphorylated PKM2, which led to enhanced pyruvate kinase (PK) activity and increased translocation of PKM2 into mitochondria. We then found that GACAT2 overexpression could reverse the damage to mitochondrial function and cementoblastic differentiation of PDLSCs induced by inflammation and that this effect could be abolished by PKM1/2 knockdown. Our data indicated that by binding to PKM1/2 proteins, the lncRNA GACAT2 plays a critical role in regulating mitochondrial function and cementogenesis in an inflammatory environment.


Conflict of interest statement

The authors declare no competing interests.

Figures

Fig. 1
Fig. 1
Inflammatory cytokines compromise the cementogenesis of PDLSCs. The cells were incubated in normal α-MEM (Nor), medium with the inflammatory cytokines TNF-α and IL-1β (Infla), medium with the cementoblastic inducer EMD (EMD), or medium with both inflammatory cytokines and EMD (Infla-EMD). a Relative cementoblastic differentiation-related gene expression levels of BSP, CAP and CEMP-1 determined by qRT-PCR. b Relative cementoblastic differentiation-related protein expression of BSP, CAP and CEMP-1 determined by Western blots. c Semiquantitative analysis of protein expression levels (normalized to β-actin) in terms of relative gray density. d ALP staining (scale bar: 500 μm) of PDLSCs. e Quantification of ALP activity. The data are shown as the mean ± SD for n from 4 to 9; *P < 0.05, **P < 0.01 and ***P < 0.001 indicate significant differences between the indicated columns
Fig. 2
Fig. 2
Inflammatory cytokines cause mitochondrial dysfunction in PDLSCs during cementoblastic differentiation. The cells were incubated in normal α-MEM (Nor), medium with the inflammatory cytokines TNF-α and IL-1β (Infla), medium with the cementoblastic inducer EMD (EMD), or medium with both inflammatory cytokines and EMD (Infla-EMD). a The MMP was determined using a JC-1 probe (immunofluorescence staining; scale bar: 200 μm). b Quantification of the MMP (reflected by the relative ratio of red/green fluorescence intensity of JC-1). c Intracellular ATP contents determined by ATP assays. d mtDNA content determined by qRT-PCR. e Morphometric analysis of mitochondria by transmission electron microscopy (yellow arrows indicate healthy mitochondria, red arrows indicate swollen mitochondria; scale bar: 500 nm). f The OCR of PDLSCs determined using a Seahorse Bioscience XF Analyzer; arrows indicate the sequential injection of the ATPase inhibitor Oligo (1 μmol·L−1), the uncoupling reagent carbonyl cyanide-p-trifluoromethoxyphenylhydrazone (FCCP, 1 μmol·L−1) and inhibitors of the electron transport chain rotenone/antimycin (R/A, 2 μmol·L−1). g Quantification of maximal respiration (differences between the maximum rate measurement after FCCP injection and the minimum rate measurement after R/A injection). h Quantification of cellular respiration (basic OCR value prior to Oligo injection). i Quantification of ATP production (difference between final rate measurement prior to Oligo injection and minimum rate measurement after Oligo injection). The data are shown as the mean ± SD for n from 3 to 8; *P < 0.05, **P < 0.01 and ***P < 0.001 indicate significant differences between the indicated columns
Fig. 3
Fig. 3
Mitochondrial function is required for the cementoblastic differentiation of PDLSCs in either noninflammatory or inflammatory environments. ac Mitochondrial dysfunction impairs the cementoblastic differentiation of PDLSCs. The cells were incubated in medium with EMD (noninflammatory environment). a Relative cementoblastic differentiation-related gene expression levels of BSP, CAP and CEMP-1 in the PDLSCs without (control) or with pretreatment with 10 μmol·L−1 H2O2 (H2O2) or 10 μg·mL−1 Oligo (Oligo) for 24 h (qRT-PCR). b Relative cementoblastic differentiation-related protein expression of BSP, CAP and CEMP-1 in the PDLSCs without (control) or with pretreatment with 10 μmol·L−1 H2O2 (H2O2) or 10 μg·mL−1 Oligo (Oligo) for 24 h (Western blot). c Semiquantitative analysis of the protein expression levels (normalized to β-actin) in terms of relative gray density. df Reversing inflammation-induced mitochondrial dysfunction rescued the cementoblastic differentiation of PDLSCs. The cells were incubated in medium with both inflammatory cytokines and EMD (inflammatory environment). d Relative cementoblastic differentiation-related gene expression levels of BSP, CAP and CEMP-1 in the PDLSCs without (control) or with pretreatment with 1 mmol·L−1 NAC (NAC) or 20 nmol·L−1 Visomitin (Visomitin) for 2 h (qRT-PCR). e Relative cementoblastic differentiation-related protein expression of BSP, CAP and CEMP-1 in the PDLSCs without (control) or with pretreatment with 1 mmol·L−1 NAC (NAC) or 20 nmol·L−1 Visomitin (Visomitin) for 2 h (Western blot). f Semiquantitative analysis of protein expression levels (normalized to β-actin) in terms of relative gray density. The data are shown as the mean ± SD for n from 6 to 9; *P < 0.05, **P < 0.01 and ***P < 0.001 indicate significant differences between the indicated columns
Fig. 4
Fig. 4
Identification and validation of GACAT2 as a key lncRNA associated with the cementoblastic differentiation of PDLSCs. a–h Identification of differentially expressed lncRNAs between the PDLSCs incubated in noninflammatory environments and the PDLSCs incubated in inflammatory environments. The cells were incubated in medium with the cementoblastic inducer EMD alone (EMD) or EMD plus inflammatory cytokines (Infla-EMD). a Volcano plots of the differentially expressed (fold change >1.5 and adjusted P < 0.05) lncRNAs in the PDLSCs between the EMD and Infla-EMD groups. b Heatmap of the top 8 lncRNAs with upregulated expression and the top 8 lncRNAs with downregulated expression in the PDLSCs of the EMD group compared with those in the Infla-EMD group. Six lncRNAs, AL390957.1 (c), LINC01638 (d), AC010247.2 (e), AC096773.1 (f), LINC01133 (g), and GACAT2 (h), were selected for qRT-PCR verification according to their RNA length (<2 000 nt), intensity (>100), relation (without overlapping with coding transcripts) and database source (in the GENCODE or RefSeq public databases), and 10 other lncRNAs were excluded. c and d No significant changes in AL390957.1 and LINC01638 expression were observed in the cells incubated in the noninflammatory or inflammatory environments. e and f AC010247.2 and AC096773.1 expression was significantly increased in an inflammatory environment. g and h LINC01133 and GACAT2 expression was significantly decreased in an inflammatory environment. i The inhibition of AC096773.1 (si-AC096773.1), but not AC010247.2 (si-AC010247.2), increased the relative cementoblastic differentiation-related gene expression levels of BSP, CAP and CEMP-1 in the PDLSCs incubated in an inflammatory environment (qRT-PCR). j The inhibition of LINC01133 (si-LINC01133) or GACAT2 (si-GACAT2) decreased the relative cementoblastic differentiation-related gene expression levels of BSP, CAP and CEMP-1 in the PDLSCs incubated in a noninflammatory environment (qRT-PCR); the most significant change was observed in response to GACAT2 inhibition. The data are shown as the mean ± SD for n from 3 to 6; *P < 0.05, **P < 0.01 and ***P < 0.001 indicate significant differences between the indicated columns
Fig. 5
Fig. 5
Overexpression of GACAT2 (ov-GACAT2) reverses the inflammation-compromised cementoblastic differentiation and mitochondrial function of PDLSCs. The cells were incubated in medium with both inflammatory cytokines and EMD (inflammatory environment). a Overexpression efficiency of GACAT2 in PDLSCs validated by qRT-PCR. b Relative cementoblastic differentiation-related gene expression levels of BSP, CAP and CEMP-1 determined by qRT-PCR. c Relative cementoblastic differentiation-related protein expression of BSP, CAP and CEMP-1 determined by Western blots. d Semiquantitative analysis of protein expression levels (normalized to β-actin) in terms of relative gray density. e mtROS levels in PDLSCs determined with the aid of a MitoSOX probe (flow cytometric analysis). f Quantification of mtROS levels (reflected by the relative fluorescence intensity of MitoSOX). g Intracellular ATP contents (ATP assay). h The MMP was determined with a JC-1 probe (immunofluorescence staining; scale bar: 50 μm). i Quantification of MMP levels (reflected by the relative ratio of red/green fluorescence intensity of JC-1). j mtDNA content determined by qRT-PCR. k Relative mitochondrial complex-related protein expression of NDUFB8 (subunit of complex I), SDHA (subunit of complex II), UQCRC1 (subunit of complex III), COXIV (subunit of complex IV) and ATP5A (subunit of complex V) determined by Western blots. l Semiquantitative analysis of protein expression levels (normalized to β-actin) in terms of relative gray density. m OCR of PDLSCs determined by a Seahorse Bioscience XF Analyzer; arrows indicate the sequential injection of 1 μmol·L−1 Oligo, 1 μmol·L−1 FCCP and 2 μmol·L−1 R/A. n Quantification of cellular respiration (basic OCR value prior to Oligo injection). o Quantification of maximal respiration (differences between the maximum rate measurement after FCCP injection and the minimum rate measurement after R/A injection). p Quantification of ATP production (difference between the final rate measurement prior to Oligo injection and the minimum rate measurement after Oligo injection). The data are shown as the mean ± SD for n from 3 to 8; *P < 0.05, **P < 0.01 and ***P < 0.001 indicate significant differences between the indicated columns
Fig. 6
Fig. 6
Identification and validation of PKM1/2 as a direct binding protein of GACAT2 that influences mitochondrial function. a and b Determination of GACAT2 localization in both the cytoplasm and nucleus of PDLSCs. The cells were incubated in normal α-MEM (Nor), medium with the cementoblastic inducer EMD (EMD), or medium with both inflammatory cytokines and EMD (Infla-EMD). a Percentages of nuclear and cytoplasmic GACAT2 determined by qRT-PCR (U6 and β-actin served as the nuclear and cytoplasmic controls, respectively). b Subcellular localization of GACAT2 determined by the RNA SCOPE assay (scale bar: 100 μm). c GACAT2 expression was negatively correlated with mitochondrial inner membrane-associated gene signatures (GSEA). d The ChIRP method was applied to screen the potential proteins binding to GACAT2. e Heatmap of 15 GACAT2-binding proteins screened by ChIRP-MS assays (unique peptide ≥2, fold change >1.2); U1 probes were used as the positive control (U1), and nontargeting probes (control) were used as the negative control. f Quantification of labeled reference peptides for GACAT2-binding proteins (PRM assay, nontargeting probes were used as the negative control). gk Product ion pattern of the selected proteins (fold change >1.5), i.e., TXN (g), AZGP1 (h), TUBA1B (i), JUP (j) and PKM1/2 (k) (PRM assay; EKLEATINELV for the TXN protein, AGEVQEPELR for the AZGP1 protein, AVFVDLEPTVIDEVR for the TUBA1B protein, NLALCPANHAPLQEAAVIPR for the JUP protein, and IYVDDGLISLQVK for the PKM1/2 protein); nontargeting probes were used as controls; different colors indicate different fragment ions from the same polypeptide, and each peptide was quantified using fragment ions. l Chromatograph of a labeled peptide (IYVDDGLISLQVK) for the PKM1/2 protein; PKM1/2 was selected for further verification because it is more closely related to mitochondrial function than AZGP1, TUBA1B and JUP (based on information arising from the UniProt Database), and TXN was excluded from further investigation due to its inappropriate chromatography (Fig. S15). m and n Confirmation of the interaction between PKM1/2 and GACAT2 by RIP assays. The PKM1/2 protein immunoprecipitated by the anti-PKM1/2 antibody was verified by immunoblotting analysis (m), and the enrichment of GACAT2 immunoprecipitated by anti-PKM1/2 antibodies was determined by RIP assays (n) (IgG antibodies were used as the control). The data are shown as the mean ± SD for n = 3; ***P < 0.001 indicate significant differences between the indicated columns
Fig. 7
Fig. 7
Overexpression/inhibition of GACAT2 affects the expression, activity, allosteric regulation, post-translational modification and translocation of PKM1/2. ad Relative protein expression levels of PKM1/2, PKM1 and PKM2 in PDLSCs (with overexpression or inhibition of GACAT2) determined by Western blots and semiquantitative analysis of their expression levels (normalized to β-actin) in terms of relative gray density. The cells were transfected with ov-NC or ov-GACAT2 and incubated in medium with both inflammatory cytokines and EMD (inflammatory environment) (a and b) or were transfected with si-NC or si-GACAT2 and incubated in medium with the cementoblastic inducer EMD (noninflammatory environment) (c and d). eh PK activity and production of pyruvate in PDLSCs (with the overexpression or inhibition of GACAT2). The cells were transfected with ov-NC or ov-GACAT2 and incubated in an inflammatory environment (e and f) or were transfected with si-NC or si-GACAT2 and incubated in a noninflammatory environment (g and h). il Tetramer, dimer and monomer levels of PKM2 in PDLSCs (with overexpression or inhibition of GACAT2) determined by western blots (i and k) and semiquantitative analysis of their expression levels (normalized to β-actin) in terms of relative gray density (j and l). The cells were transfected with ov-NC or ov-GACAT2 and incubated in an inflammatory environment (i and j) or were transfected with si-NC or si-GACAT2 and incubated in a noninflammatory environment (k and l). mp p-PKM2 in PDLSCs (with overexpression or inhibition of GACAT2) was determined by western blots and semiquantitative analysis of their expression levels (normalized to β-actin) in terms of relative gray density. The cells were transfected with ov-NC or ov-GACAT2 and incubated in an inflammatory environment (m and n) or were transfected with si-NC or si-GACAT2 and incubated in a noninflammatory environment (o and p). q Immunofluorescence staining for mitochondria (MitoTracker, red), PKM2 (green) and DAPI (blue) in the PDLSCs transfected with ov-NC or ov-GACAT2 and incubated in an inflammatory environment (scale bar: 50 μm). r and s Relative protein expression levels of mitochondrial PKM2 in PDLSCs (with overexpression of GACAT2) determined by Western blots (r) and semiquantitative analysis of their expression levels (normalized to COXIV) in terms of relative gray density (s). The data are shown as the mean ± SD for n from 3 to 6; *P < 0.05, **P < 0.01 and ***P < 0.001 indicate significant differences between the indicated columns
Fig. 8
Fig. 8
Inhibition of PKM1/2 impairs GACAT2 overexpression-rescued mitochondrial function and cementoblastic differentiation of PDLSCs. The cells were transfected with ov-NC or ov-GACAT2 and incubated in medium with both inflammatory cytokines and EMD (inflammatory environment), and both ov-NC- and GACAT2-transfected cells were then further transfected with si-NC or si-PKM1/2. a OCR of PDLSCs determined by a Seahorse Bioscience XF Analyzer; arrows indicate the sequential injection of 1 μmol·L−1 Oligo, 1 μmol·L−1 FCCP and 2 μmol·L−1 R/A. b Quantification of cellular respiration (basic OCR value prior to Oligo injection), maximal respiration (differences between the maximum rate measurement after FCCP injection and the minimum rate measurement after R/A injection) and ATP production (difference between the final rate measurement prior to Oligo injection and the minimum rate measurement after Oligo injection) of PDLSCs. c mtROS levels in PDLSCs determined with the aid of a MitoSOX probe (flow cytometric analysis). d Quantification of mtROS levels (reflected by the relative fluorescence intensity of MitoSOX). e Intracellular ATP contents (ATP assay). f Relative cementoblastic differentiation-related gene expression levels of BSP, CAP and CEMP-1 determined by qRT-PCR. g Relative cementoblastic differentiation-related protein expression of BSP, CAP and CEMP-1 determined by western blots. h Semiquantitative analysis of protein expression levels (normalized to β-actin) in terms of the relative gray density. i The diagram shows that the lncRNA GACAT2 plays a central role in regulating mitochondrial function and cementoblastic differentiation of PDLSCs in an inflammatory environment. Mechanistically, it functions by binding to PKM1/2 proteins to modulate cell mitochondrial bioenergetics and/or metabolism. The data are shown as the mean ± SD for n from 3 to 8; *P < 0.05, **P < 0.01 and ***P < 0.001 indicate significant differences between the indicated columns

References

    1. Hajishengallis G, Chavakis T. Local and systemic mechanisms linking periodontal disease and inflammatory comorbidities. Nat. Rev. Immunol. 2021;21:426–440. - PMC - PubMed
    1. Kinane DF, Stathopoulou PG, Papapanou PN. Periodontal diseases. Nat. Rev. Dis. Prim. 2017;3:17038. - PubMed
    1. Bartold PM, Gronthos S, Ivanovski S, Fisher A, Hutmacher DW. Tissue engineered periodontal products. J. Periodontal Res. 2016;51:1–15. - PubMed
    1. Xu XY, et al. Concise review: periodontal tissue regeneration using stem cells: strategies and translational considerations. Stem Cells Transl. Med. 2019;8:392–403. - PMC - PubMed
    1. Chen FM, Jin Y. Periodontal tissue engineering and regeneration: current approaches and expanding opportunities. Tissue Eng. Part B Rev. 2010;16:219–255. - PubMed