. 2022 Mar 16;13(1):1372.
doi: 10.1038/s41467-022-29012-1.

Characterisation and induction of tissue-resident gamma delta T-cells to target hepatocellular carcinoma

Affiliations

Characterisation and induction of tissue-resident gamma delta T-cells to target hepatocellular carcinoma

Nekisa Zakeri et al. Nat Commun. .

Abstract

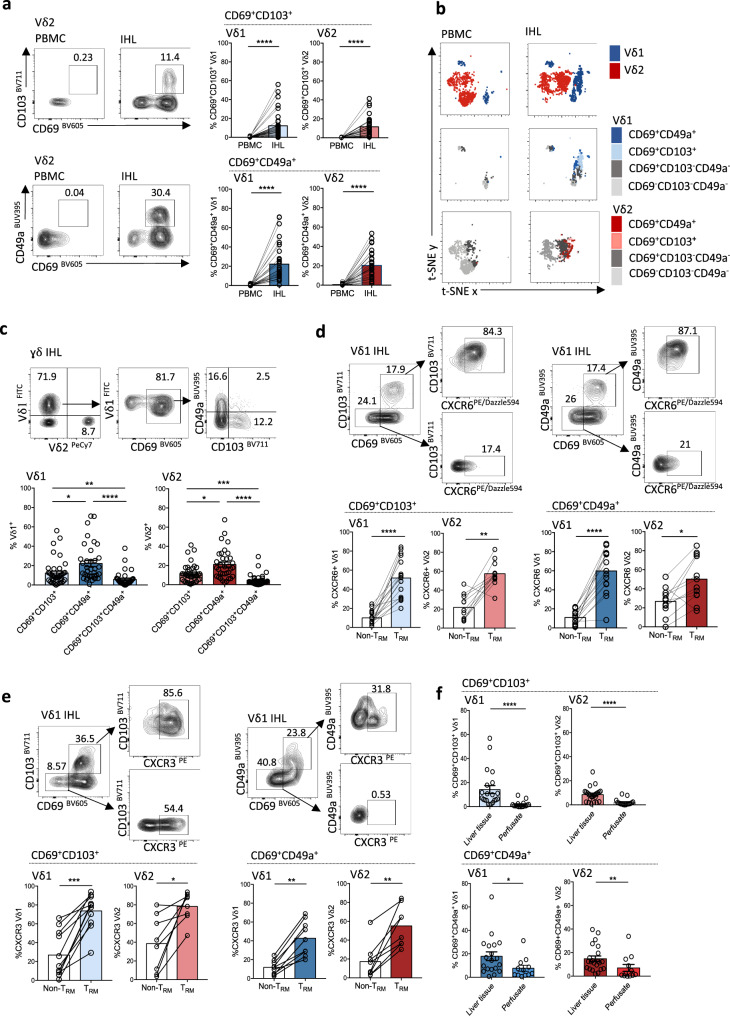
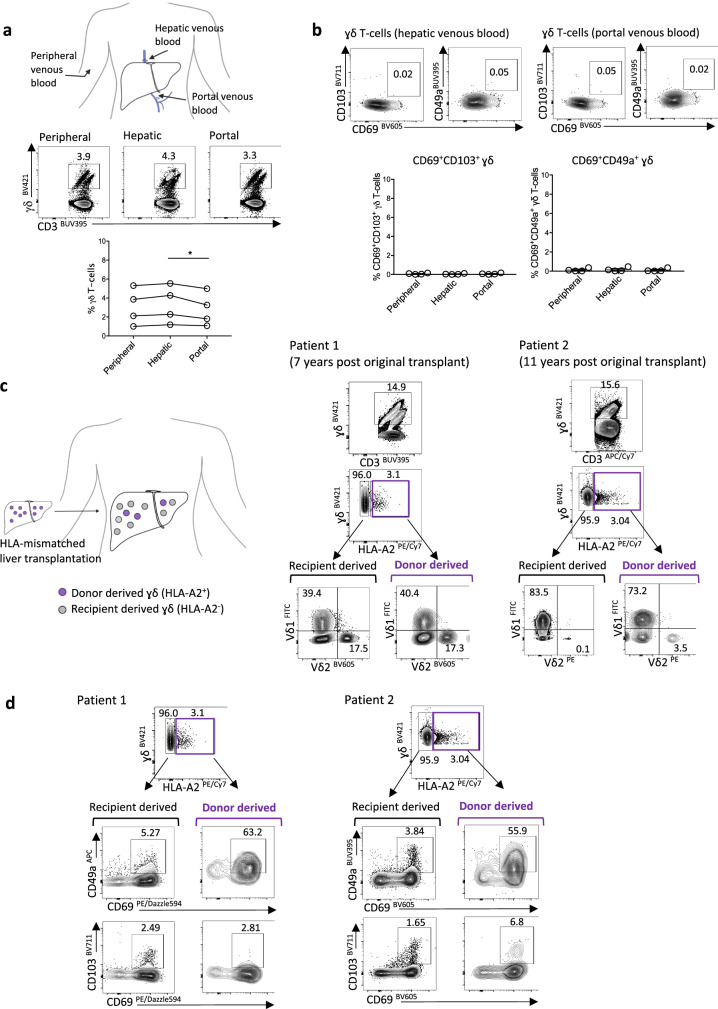
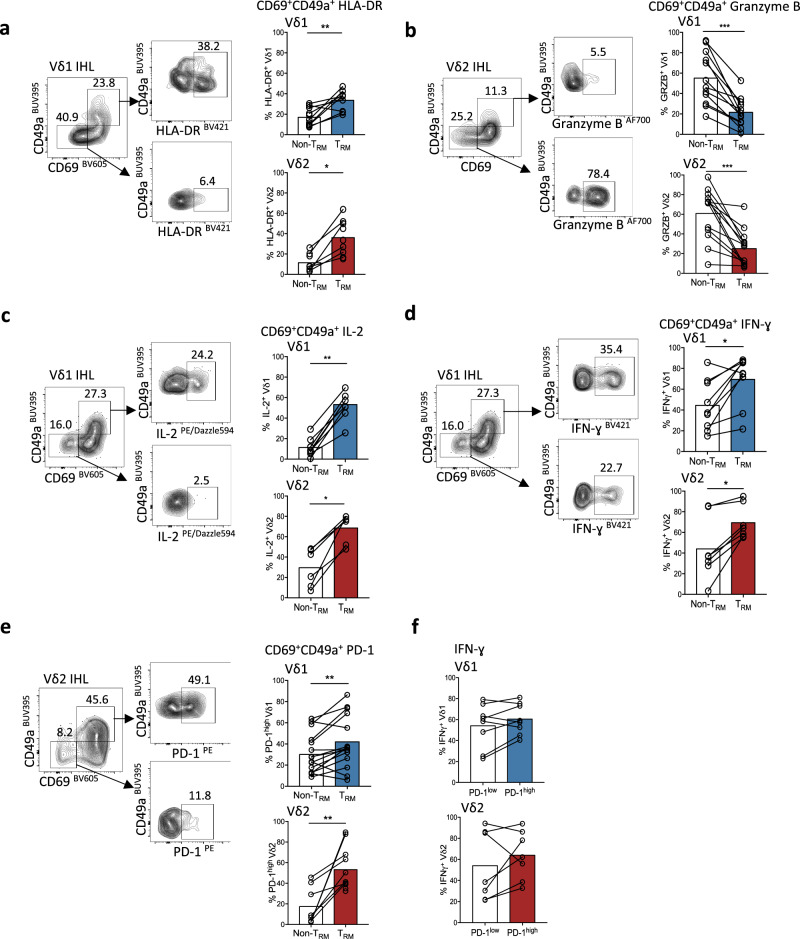
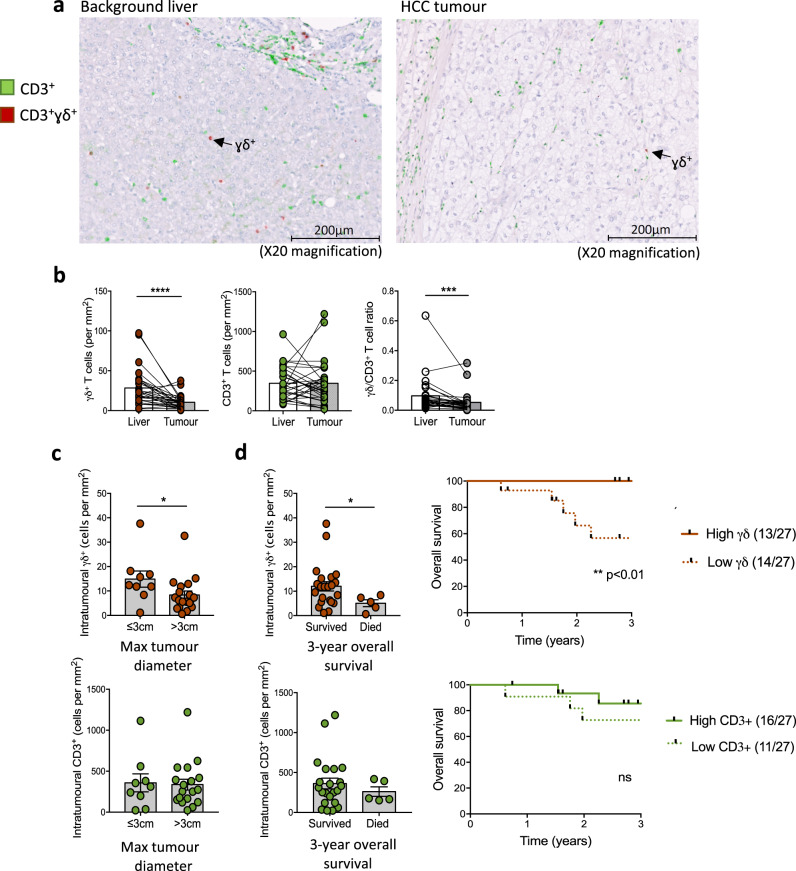
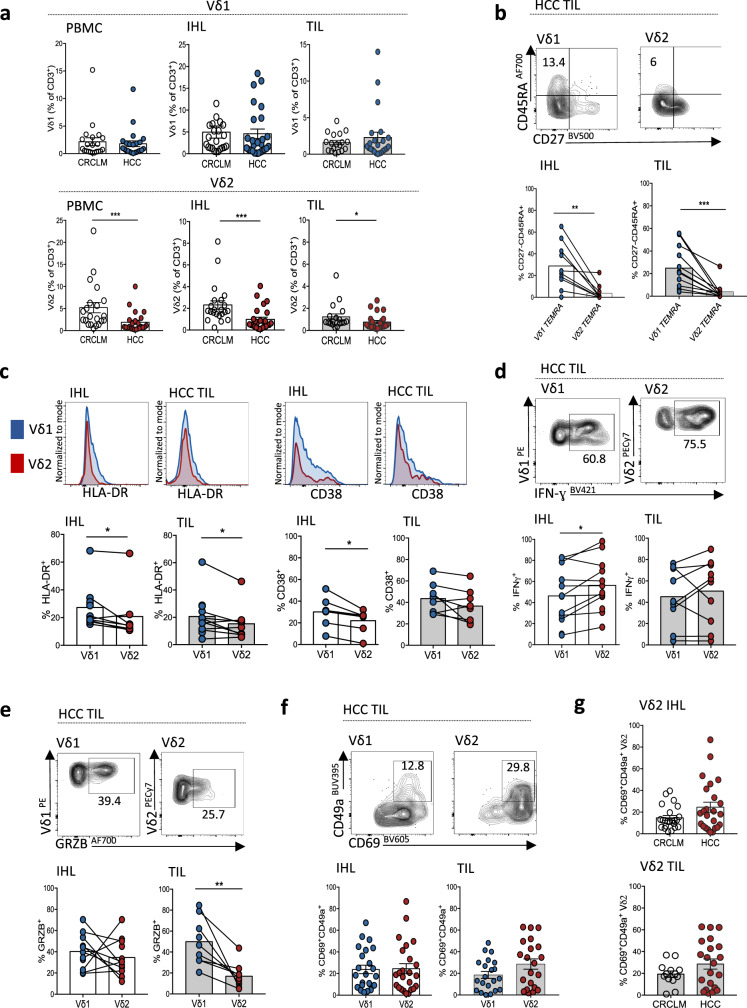
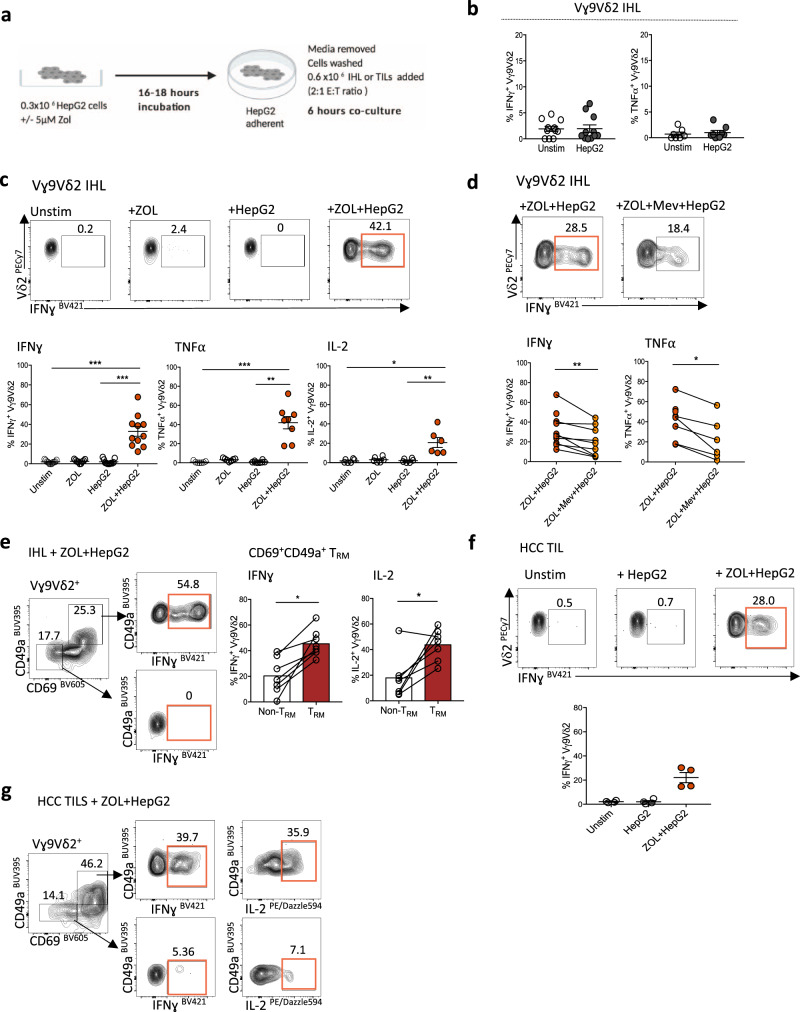
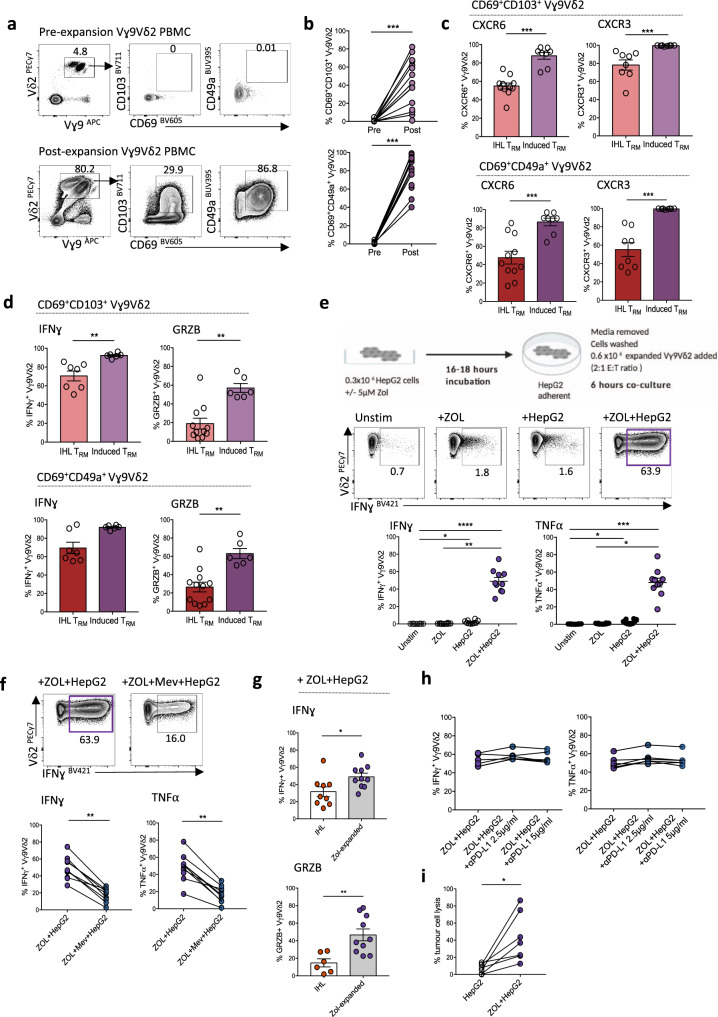
Immunotherapy is now the standard of care for advanced hepatocellular carcinoma (HCC), yet many patients fail to respond. A major unmet goal is the boosting of T-cells with both strong HCC reactivity and the protective advantages of tissue-resident memory T-cells (TRM). Here, we show that higher intratumoural frequencies of γδ T-cells, which have potential for HLA-unrestricted tumour reactivity, associate with enhanced HCC patient survival. We demonstrate that γδ T-cells exhibit bona fide tissue-residency in human liver and HCC, with γδTRM showing no egress from hepatic vasculature, persistence for >10 years and superior anti-tumour cytokine production. The Vγ9Vδ2 T-cell subset is selectively depleted in HCC but can efficiently target HCC cell lines sensitised to accumulate isopentenyl-pyrophosphate by the aminobisphosphonate Zoledronic acid. Aminobisphosphonate-based expansion of peripheral Vγ9Vδ2 T-cells recapitulates a TRM phenotype and boosts cytotoxic potential. Thus, our data suggest more universally effective HCC immunotherapy may be achieved by combining aminobisphosphonates to induce Vγ9Vδ2TRM capable of replenishing the depleted pool, with additional intratumoural delivery to sensitise HCC to Vγ9Vδ2TRM-based targeting.


Conflict of interest statement

Unrelated to the content of this manuscript, authors M.K.M. and N.M.S. have an international patent application No.1917498.6 entitled Treatment of Hepatitis B Virus (HBV) Infection filed by applicant UCL Business Ltd. MP is co-founder and director of Engitix Therapeutics Ltd, UK. The Maini lab has received unrestricted funding from Gilead, Roche and Immunocore. The remaining authors declare no competing interests.

Figures

Fig. 1
Fig. 1. Compartmentalisation of Vδ1 and Vɣ9Vδ2 T-cells with a tissue-resident phenotype in human liver.
a Representative flow cytometry plots and summary data of CD69+CD103+ or CD69+CD49a+ co-expression on Vδ1 and Vɣ9Vδ2 T-cells from intrahepatic lymphocytes (IHL) of tumour-free liver tissue compared to paired peripheral blood mononuclear cells (PBMC) (n = 35–44; p < 0.0001). b t-distributed stochastic neighbour embedding (t-SNE) was applied to flow cytometry expression data (concatenated PBMC n = 3 and IHL n = 5) of Vδ1 (blue) and Vɣ9Vδ2 (red) T cells (top row); plots coloured by CD69, CD49a and CD103 expression on Vδ1 T-cells (middle row) and Vɣ9Vδ2 T-cells (bottom row). c Frequencies of CD69+CD103+, CD69+CD49a+ and CD69+CD49a+CD103+ intrahepatic Vδ1 and Vɣ9Vδ2 T-cells (n = 40; Vδ1 p = 0.02, p = 0.004, p < 0.0001; Vɣ9Vδ2 p = 0.02, p = 0.0008; p < 0.0001). d Frequencies of CXCR6-expressing CD69+CD103+ or CD69+CD49a+ Vδ1 and Vɣ9Vδ2 TRM (n = 17; Vδ1 p < 0.0001; Vɣ9Vδ2 p = 0.002, p = 0.02). e Frequencies of CXCR3-expressing CD69+CD103+ (n = 14) or CD69+CD49a+ (n = 9–11) Vδ1 and Vɣ9 Vδ2 TRM (Vδ1 p = 0.001, p = 0.004; Vɣ9Vδ2 p = 0.008, p = 0.02). f Frequencies of Vδ1 and Vɣ9Vδ2 TRM in IHL from healthy liver tissue (disease-free margins of CRCLM) (n = 24) compared to healthy donor liver transplant perfusates (n = 17, Vδ1 p < 0.0001, p = 0.03; Vɣ9Vδ2 p < 0.001, p = 0.0096). Each symbol represents a study participant, with error bars showing the mean ± SEM (a, cf); two-tailed p-values were determined using Wilcoxon matched-pairs signed rank test (a, d, e), Kruskal–Wallis test (ANOVA) followed by Dunn’s post-hoc multiple comparisons test (c), Mann–Whitney test (f). *p < 0.05; **p < 0.01; ***p < 0.001, ****p < 0.0001.
Fig. 2
Fig. 2. Long-lived hepatic retention and replenishment of Vδ1 and Vɣ9Vδ2-TRM.
a Representative flow cytometry plot and summary data of total γδ T-cells (as percentage of total CD3+ T-cells) in peripheral, hepatic and portal venous blood obtained from cirrhotic patients undergoing transjugular intrahepatic portosystemic shunt procedures (n = 4, p = 0.04). b Representative flow cytometry plot and summary data demonstrating absence of CD69+CD49a+ or CD69+CD103+ γδTRM in peripheral, hepatic, portal venous blood (n = 4 matched samples). c Flow cytometry plot for the identification of donor human leukocyte antigen (HLA) A2+ and recipient HLA A2 derived γδ T-cells from two explants obtained 7 years or 11 years following HLA-mismatched liver transplantation. Vδ1 and Vɣ9Vδ2 T-cell frequencies within recipient-derived and donor-derived γδ T-cell subsets. d CD69+CD49a+ and CD69+CD103+ expression on donor-derived (HLA A2+) and recipient-derived (HLA A2) γδ T-cell subsets (n = 2). Error bars, mean ± SEM (b). Two-tailed p-values were determined by Friedman test with Dunn’s post-hoc test for multiple comparisons (a, b).
Fig. 3
Fig. 3. Distinct functional profile of hepatic γδTRM.
a–e Representative flow cytometry plots and summary data of ex vivo functional profile of intrahepatic CD69+CD49a+ Vδ1 and Vγ9Vδ2 TRM compared to non-TRM (CD69CD49a) counterparts. a HLA-DR expression (n = 13; Vδ1 p = 0.008; Vγ9Vδ2 p = 0.03). b unstimulated Granzyme B expression (n = 17; Vδ1 p = 0.0005; Vγ9Vδ2 p = 0.0002). c IL-2 expression following 4 h PMA and Ionomycin stimulation (n = 10; Vδ1 p = 0.004; Vγ9Vδ2 p = 0.03). d IFN-γ expression after 4 h PMA and Ionomycin stimulation (n = 10; Vδ1 p = 0.01; Vγ9Vδ2 p = 0.02). e unstimulated programmed death-1 (PD-1) expression (n = 11; Vδ1 p = 0.007; Vγ9Vδ2 p = 0.008). f IFN-γ expression by PD-1high and PD-1low intrahepatic Vδ1 and Vγ9Vδ2 T-cells after 4 h PMA and Ionomycin stimulation (n = 8; p value non-significant). Each symbol represents a study participant, with bars showing the mean (af); two-tailed p-values were determined using Wilcoxon matched-pairs signed rank test (af). *p < 0.05; **p < 0.01; ***p < 0.001.
Fig. 4
Fig. 4. γδ T-cell counts in HCC are associated with tumour size and patient survival.
(ad) Immunohistochemistry staining of paired background liver and tumour tissue obtained from patients with hepatocellular carcinoma (HCC) undergoing surgical resection. Cell counts performed from five randomly selected high-power fields (x20 objective magnification) per sample (n = 28 paired samples). a Representative multispectral analysis with non-γδ CD3+ (green) and γδ+ (red) T-cells as pseudo-colourised images in liver and HCC tumoural tissue, replicated across five high-power (x20) fields per sample. b Absolute γδ T-cell and non-γδ CD3+ T-cell numbers (calculated per mm2) and γδ/CD3+ T-cell ratio in paired liver and HCC tumours (n = 28 paired samples; p < 0.0001, p = 0.0006). c Intratumoural γδ T-cell counts and non-γδ CD3+ T-cell counts (per mm2) in small HCC tumours with a maximum diameter of ≤3 cm compared to HCC tumours >3 cm in diameter (n = 28; p = 0.03). d HCC intratumoural γδ T-cell counts and non-γδ CD3+ T-cell counts (per mm2) according to 3-year patient survival outcomes (overall survival data available n = 27, 22/27 survived, 5/27 died; p = 0.048). Kaplan Meier graphs of overall survival (years post resection) split on the median intratumoural γδ T-cell (p = 0.009) or non-γδ CD3+ T-cell count from 27 HCC tumours. Two-tailed p-values were determined using Wilcoxon matched-pairs signed rank test test (b) or Mann–Whitney test (c, d), Kaplan Meier graphs with Log-rank test (d). Error bars represent mean ± SEM. ns Not significant; *p < 0.05; **p < 0.01; ***p < 0.001, ****p < 0.0001.
Fig. 5
Fig. 5. Vγ9Vδ2 T-cells are selectively depleted, but can acquire tissue-residence, within HCC TILs.
(ag) Flow cytometry analysis of paired peripheral blood mononuclear cells (PBMC), intrahepatic lymphocytes (IHL) from tumour-free liver tissue, and tumour-infiltrating lymphocytes (TIL) from patients undergoing surgical resection or liver transplantation for hepatocellular carcinoma (HCC) compared to patients undergoing surgical resection for colorectal cancer liver metastases (CRCLM). a Total frequencies of Vδ1 (above) and Vγ9Vδ2 (below) T-cells in PBMC, IHL and TILs of CRCLM (n = 23) compared to HCC (n = 26) (expressed as a percentage of total CD3+ T-cells; Vγ9Vδ2 PBMC p = 0.0007, IHL p = 0.0002, TIL p = 0.02). b Representative flow cytometry plot and summary data of CD27-CD45RA + terminally differentiated effector memory (TEMRA) Vδ1 and Vγ9Vδ2 T-cells in paired liver and HCC TILs (n = 10; IHL p = 0.002, TIL p = 0.001). c ex vivo HLA-DR (n = 12; IHL p = 0.02, TIL p = 0.05) and CD38 expression (n = 8; IHL p = 0.02) by Vδ1 and Vγ9Vδ2 T-cells within HCC IHL and TILs. d IFN-γ expression by Vδ1 and Vγ9Vδ2 T-cells within HCC IHL (n = 12) and TILs (n = 10) after 4 h PMA and Ionomycin stimulation (IHL p = 0.03). e Unstimulated Granzyme B expression by Vγ9Vδ2 T-cells in HCC IHL and TILs (n = 11; TIL p = 0.008). f CD69+CD49a+ expression on Vδ1 and Vγ9Vδ2 T-cells in HCC IHL (n = 23) and TILs (n = 21). g CD69+CD49a+ expression on Vγ9Vδ2 T-cells in HCC compared to CRCLM IHL (n = 22) and TILs (n = 13). Each symbol represents a study participant, error bars indicate mean ± SEM; two-tailed p-values were determined using Mann–Whitney test (a, g), or Wilcoxon paired test (bf). *p ≤ 0.05; **p < 0.01; ***p < 0.001.
Fig. 6
Fig. 6. Anti-tumour potential of Vγ9Vδ2 TRM against ZOL-sensitised HCC cell lines.
a Schema of untreated or Zoledronic acid (ZOL) pre-treated (5μM, 16–18 h) adherent HepG2 cells co-cultured with intrahepatic lymphocytes (IHL) (n = 11) or HCC tumour-infiltrating lymphocytes (TIL) (n = 4) (E:T 2:1 ratio; 0.6 × 106 IHL or TILs to 0.3 × 106 HepG2 cells, 6 h co-culture, all conditions performed in duplicate or triplicate). b IFN-γ, TNFα expression by Vγ9Vδ2 T-cells in IHL unstimulated or after co-culture with untreated HepG2 cells (n = 11 IFN-γ, n = 8 TNF-α). c IFN-γ, TNFα, IL-2 expression by Vγ9Vδ2 T-cells in IHL: unstimulated, directly treated with 5 μM ZOL, or after co-culture with untreated or ZOL pre-treated HepG2 cells (n = 11 IFN-γ p = 0.0004, p = 0.0008; n = 8 TNFα p = 0.0006, p = 0.004; n = 7 IL-2 p = 0.007, p = 0.02). d IFN-γ (n = 11), TNF-α (n = 8) expression by Vγ9Vδ2 T-cells in IHL after co-culture with ZOL pre-treated HepG2 cells with or without 100 µM Mevastatin (Mev) treatment (IFN-γ p = 0.008, TNF-α p = 0.03). e Representative flow cytometry plot of IFNγ expression and summary data of IFNγ and IL-2 expression by CD69+CD49a+ Vγ9Vδ2 TRM compared to CD69CD49a Vγ9Vδ2 non-TRM, following co-culture of IHL with ZOL pre-treated HepG2 cells (g = 8, IFNγ p = 0.02, IL-2 p = 0.03). f IFN-γ expression by Vγ9Vδ2 T-cells in HCC TILs unstimulated, or after co-culture with untreated or ZOL pre-treated HepG2 cells (n = 4). g Representative flow cytometry plot of IFN-γ expression by CD69+CD49a+ Vγ9Vδ2 TRM and CD69CD49a Vγ9Vδ2 non-TRM in HCC TILs after co-culture with ZOL pre-treated HepG2 cells. Each symbol represents a study participant; error bars represent the mean ± SEM. Two-tailed p-values were determined using Wilcoxon paired test (b, d, e), or Friedman test with Dunn’s post-hoc multiple comparisons test (c, f). *p < 0.05; **p < 0.01; ***p < 0.001.
Fig. 7
Fig. 7. ZOL expands de novo Vγ9Vδ2 TRM from blood, targeting ZOL-sensitised HCC cell lines.
a Representative flow cytometry plots of CD69+CD103+ and CD69+CD49a+ expression on Vγ9Vδ2 T-cells pre- and post-Zoledronic acid (ZOL) and IL-2 based expansion. b Summary data of CD69+CD103+ and CD69+CD49a+ expression on Vγ9Vδ2 T-cells pre- and post-ZOL and IL-2 based expansion (n = 15, p = 0.001). c % CXCR6 (left) and % CXCR3 (right) expression on ex vivo intrahepatic Vγ9Vδ2 TRM (n = 11), compared to de novo blood CD69+CD103+ or CD69+CD49a+ Vγ9Vδ2 TRM (induced TRM, n = 8) following ZOL/IL-2 expansion (CXCR6 p = 0.0001, p = 0.0008; CXCR3 p = 0.0002, p = 0.0002). d IFN-γ expression (left) by ex vivo intrahepatic Vγ9Vδ2 TRM compared to induced blood Vγ9Vδ2 TRM after 4 h PMA and Ionomycin stimulation (n = 7, p = 0.001); unstimulated Granzyme B expression (right) by intrahepatic Vγ9Vδ2 TRM (n = 11) compared to induced blood Vγ9Vδ2 TRM (n = 6, p = 0.002, p = 0.001). e Schema demonstrating expanded blood Vγ9Vδ2 T-cells co-culture with untreated or ZOL pre-treated (5 μM, 16–18 h) HepG2 cells (E:T 2:1 ratio; 0.6 × 106 expanded Vγ9Vδ2 T-cells to 0.3 × 106 HepG2 cells, 6 h co-culture, all conditions performed in triplicate). Representative flow cytometry plot and summary data of IFN-γ and TNF-α expression by ZOL/IL-2 expanded Vγ9Vδ2 T-cells: unstimulated, directly treated with ZOL 5 μM, or after co-culture with untreated or ZOL pre-treated HepG2 cells (n = 10; IFN-γ p < 0.0001, p = 0.03, p = 0.01; TNF-α p < 0.001, p = 0.03, p = 0.01). f IFN-γ and TNF-α expression by ZOL/IL-2 expanded Vγ9Vδ2 T-cells after co-culture with ZOL pre-treated HepG2 cells, with or without the addition of 100 µM Mevastatin (Mev) (n = 10; IFN-γ p = 0.004, TNF-α p = 0.004). g IFN-γ and Granzyme B expression by expanded blood Vγ9Vδ2 TRM (n = 9) compared to ex vivo intrahepatic Vγ9Vδ2 TRM (n = 10) after co-culture with ZOL pre-treated HepG2 cells (IFN-γ p = 0.03, GRZB p = 0.005). h IFN-γ and TNF-α expression by ZOL/IL-2 expanded Vγ9Vδ2 T-cells after co-culture with ZOL pre-treated HepG2 cells, with or without the addition of anti-programmed death-ligand 1 (PDL-1) blockade (n = 6). i Lysis of HepG2 cells and ZOL pre-treated HepG2 cells after co-culture with PBMCs containing ZOL-expanded Vγ9Vδ2 T-cells (n = 7, p = 0.02), measured using ToxilightTM cytotoxicity assay. Each symbol represents a study participant; error bars show mean ± SEM. Two-tailed p-values determined using Wilcoxon paired test (b, f, i), Mann–Whitney test (c, d, g), or Friedman test with Dunn’s post-hoc test for multiple comparisons (e, h). *p < 0.05; **p < 0.01; ***p < 0.001; ****p < 0.0001.

References

    1. Sung H, et al. Global cancer statistics 2020: GLOBOCAN estimates of incidence and mortality Worldwide for 36 cancers in 185 countries. CA Cancer J. Clin. 2021;71:209–249. - PubMed
    1. Pinato DJ, et al. Immune-based therapies for hepatocellular carcinoma. Oncogene. 2020;39:3620–3637. - PMC - PubMed
    1. Finn RS, et al. Atezolizumab plus bevacizumab in unresectable hepatocellular carcinoma. N. Engl. J. Med. 2020;382:1894–1905. - PubMed
    1. Llovet JM, et al. Hepatocellular carcinoma. Nat. Rev. Dis. Prim. 2021;7:6. - PubMed
    1. Prieto J, Melero I, Sangro B. Immunological landscape and immunotherapy of hepatocellular carcinoma. Nat. Rev. Gastroenterol. Hepatol. 2015;12:681–700. - PubMed

Publication types

MeSH terms

Substances