. 2022 Mar 16;13(1):1394.
doi: 10.1038/s41467-022-29020-1.

Impaired bidirectional communication between interneurons and oligodendrocyte precursor cells affects social cognitive behavior

Affiliations

Impaired bidirectional communication between interneurons and oligodendrocyte precursor cells affects social cognitive behavior

Li-Pao Fang et al. Nat Commun. .

Abstract

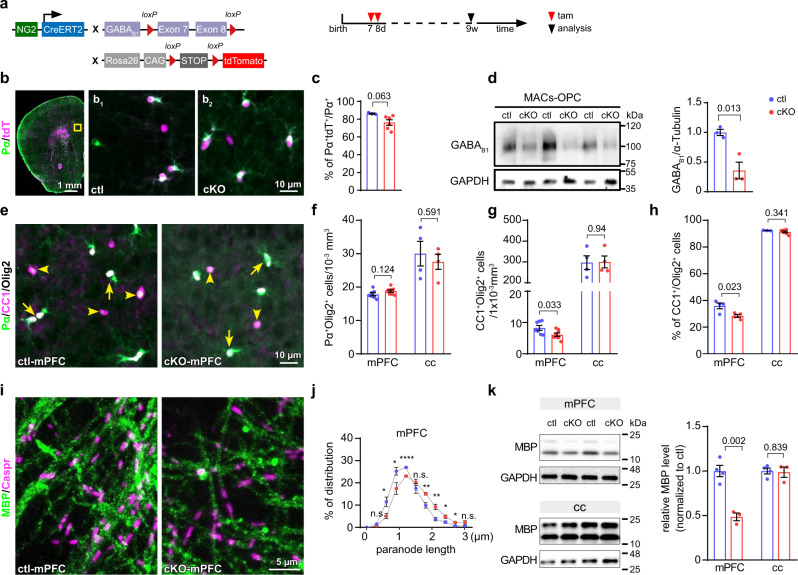
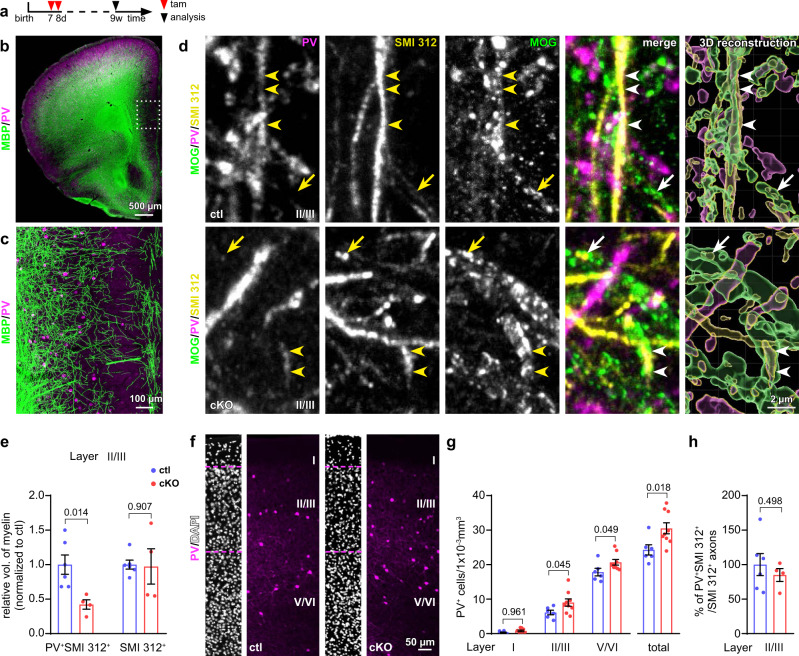
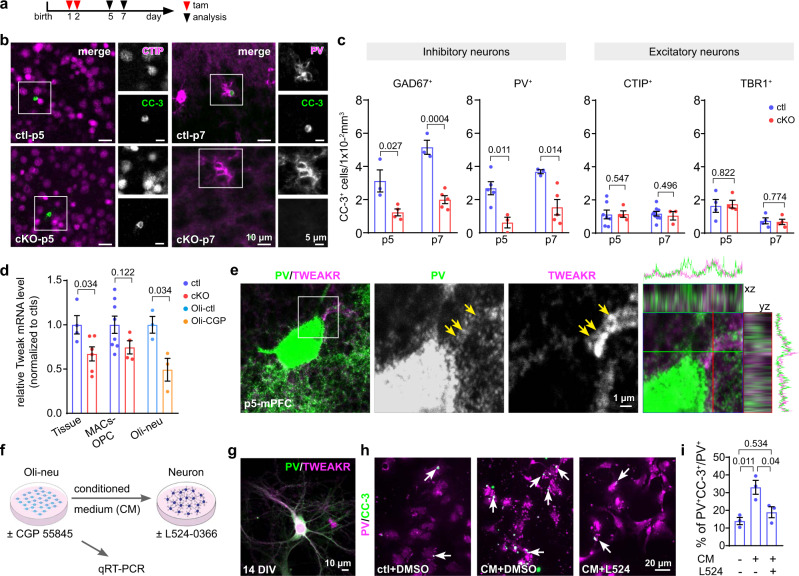
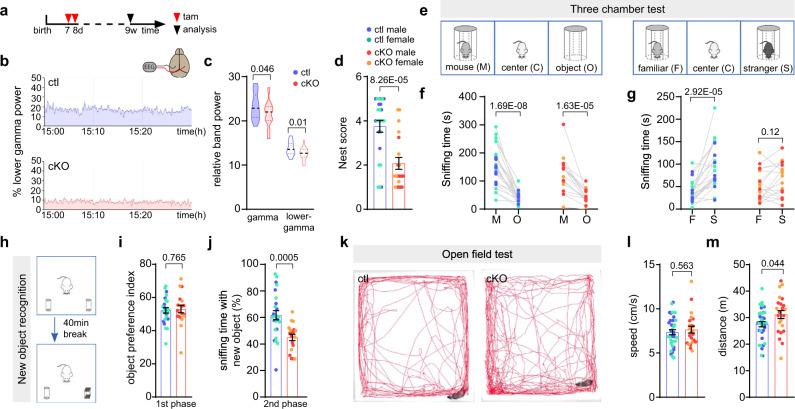
Cortical neural circuits are complex but very precise networks of balanced excitation and inhibition. Yet, the molecular and cellular mechanisms that form the balance are just beginning to emerge. Here, using conditional γ-aminobutyric acid receptor B1- deficient mice we identify a γ-aminobutyric acid/tumor necrosis factor superfamily member 12-mediated bidirectional communication pathway between parvalbumin-positive fast spiking interneurons and oligodendrocyte precursor cells that determines the density and function of interneurons in the developing medial prefrontal cortex. Interruption of the GABAergic signaling to oligodendrocyte precursor cells results in reduced myelination and hypoactivity of interneurons, strong changes of cortical network activities and impaired social cognitive behavior. In conclusion, glial transmitter receptors are pivotal elements in finetuning distinct brain functions.


Conflict of interest statement

The authors declare no competing interests.

Figures

Fig. 1
Fig. 1. Ablation of GABABRs in OPCs attenuates oligodendrocyte differentiation and alters myelination in the medial prefrontal cortex.
a Mouse line and experimental schedule for OPC-specific and temporal control of GABABR deletion. b Coronal section of the prefrontal cortex immune-stained for PDGFRα (Pα, green). Expression of tdTomato+ (tdT+, magenta) indicates recombined cells. b1, b2 Magnified micrographs of medial prefrontal cortex (mPFC, highlighted in b) of control (ctl) and conditional knockout (cKO) mice. c Recombination efficiency of OPCs in ctl and cKO mPFC. (ctl = 3 mice, cKO = 6 mice, two-sided unpaired t-test). d Western blot analysis of GABABR subunit 1 in magnetic-activated cell sorted (MACs) OPCs from cortex. (ctl = 3 mice, cKO = 3 mice, two-sided unpaired t-test). e Olig2 (white), Pα (green) and CC1 (magenta) immunostaining in adult ctl and cKO mPFC. f, g Quantification of OPC and oligodendrocyte (OL) densities in mPFC and corpus callosum (cc). (mPFC: ctl = 7 mice, cKO = 8 mice; cc: ctl = 4 mice, cKO = 4 mice, two-sided unpaired t-tests). h Quantification of the OL proportion among the total lineage (mPFC: ctl = 4 mice, cKO = 4 mice; cc: ctl = 3 mice, cKO = 6 mice, two-sided unpaired t-tests). i Immunostaining of Caspr (magenta) and MBP (green) in ctl and cKO mPFC. j Quantitative analysis of paranode length in mPFC (ctl = 4 mice, cKO = 4 mice, two-sided unpaired t-tests: p = 0.193 (n.s.), 0.038 (*), 0 048 (*), 7.67E-05 (****), 0.34 (n.s.), 0.009 (**), 0.008 (**), 0.044 (*), 0.03 (*), 0.092 (n.s.), respectively). k Western blot analysis of MBP expression in mPFC and cc. (ctl = 4 mice, cKO = 3 mice, two-sided unpaired t-tests). Data are shown as mean ± SEM in c, d, fh, j and k. Source data are provided as a Source Data file.
Fig. 2
Fig. 2. Reduced myelination and increased cell density of interneurons in OPC-GABABR cKO mice.
a Experimental schedule. b, c Overview of coronal brain slices immunostained for parvalbumin (PV, magenta) and MBP (green). PV+ neurons are abundantly myelinated in the mPFC. d Magnified micrographs of myelinated PV axons immunostained for PV (magenta), neurofilament (with SMI 312 antibody, yellow) and myelin-oligodendrocyte glycoprotein (MOG, green) in layers II/III (II/III) ctl and cKO. The 3D reconstruction was performed using Imaris. Arrows: myelinated PV-SMI 312+ axons; arrowheads: myelinated PV+SMI 312+ axons. e Relative volume of MOG immunolabel around PV+ axons (PV+SMI 312+) and total axons (SMI 312+) (normalized to ctl) (ctl = 6 mice, cKO = 4 mice, two-sided unpaired t-tests). Immunostaining (f) and quantification (g) of PV+ interneurons in different layers of mPFC at the age of 9 weeks (ctl = 6 mice, cKO = 9 mice; two-way Anova, Sidak’s multiple comparison for different layers; two-sided unpaired t-tests for total). h Ratio of PV+ interneuron axons to all axons. (ctl = 6 mice, cKO = 4 mice, two-sided unpaired t-test). Data are shown as mean ± SEM in e, g and h. Source data are provided as a Source Data file.
Fig. 3
Fig. 3. Interneuron activity is impaired in the mPFC of OPC-GABABR cKO mice.
a Experimental schedule for bf and the scheme of analyzed brain region (orange). b Patch-clamp recordings of sIPSCs and sEPSCs in pyramidal neurons of layer V of medial prefrontal cortex (mPFC). cf Quantification of frequencies and amplitudes of spontaneous inhibitory and excitatory postsynaptic currents (sIPSC and sEPSC, respectively) (sIPSC: ctl = 15 cells from 4 mice, cKO = 15 cells from 5 mice; sEPSC: ctl = 26 cells from 4 mice, cKO = 21 cells from 5 mice; sIPSC frequency was analyzed with two-sided unpaired t-test, df: two-sided unpaired Mann–Whitney test). g Experimental schedule for hn. h Surface renderings of OPCs and inhibitory presynapses based on PDGFRα (Pα, green) and vGAT (vesicular GABA transporter, white and magenta) immunostaining in ctl and cKO mPFC at p10 using Imaris software. vGAT was classified into two subgroups: on putative OPC synapses (pOPC, magenta vGATs with less than 200 nm distance from the OPC surface) and other synapses (other, gray vGATs more than 200 nm). Density (i) and volume (j) of vGAT in ctl and cKO mPFC. (ctl = 4 mice, cKO = 4 mice; two-sided unpaired t-tests). k Quantification of synaptic vGAT (<200 nm) density per µm2 of OPC surface. (ctl = 4 mice, cKO = 4 mice, two-sided unpaired t-tests). l Patch-clamp recordings of spontaneous postsynaptic currents (sPSCs) of OPCs at the layer of V of mPFC at p11-14. m, n Quantification of sPSC frequency and amplitude of OPCs before and after addition of carbachol. (ctl = 11 cells from 3 mice, cKO = 7 cells from 3 mice, two-sided unpaired t-tests). Data are shown as mean ± SEM in cf, i, j, m and n. In k, data are shown with indications of median and quartiles in thick and thin dashed lines, respectively. Source data are provided as a Source Data file.
Fig. 4
Fig. 4. Reduced oligodendrocyte differentiation and myelin gene expression at the onset of myelination in the mutant mPFC.
a Experimental plan. b Immunostaining of OPCs and oligodendrocytes (OLs) for PDGFRα (Pα, green), Olig2 (white) and CC1 (magenta) in p14 medial prefrontal cortex (mPFC). c Density of OPCs and OLs in ctl and cKO mPFC at p10 and p14. (OPC: p10: ctl =4  mice, cKO = 4 mice; p14: ctl = 10 mice, cKO = 9 mice; OL: p10: ctl = 5 mice, cKO = 4 mice; p14: ctl = 5 mice, cKO = 4 mice, two-sided unpaired t-tests). d Percentage of OLs of the complete lineage at p14 (ctl = 5 mice, cKO = 4 mice, two-sided unpaired t-tests). e Quantitative analysis of MBP mRNA level in ctl and cKO mPFC at p14. (ctl = 4 mice, cKO = 4 mice, two-sided unpaired t-test). Immunostaining (f, g) and quantification (h) of OPCs (Pα+, green in f) and OLs (CC1+, green in g) incorporated with BrdU (magenta). (OPC: ctl = 5 mice, cKO = 5 mice, two-sided unpaired t-test; OL: ctl = 4 mice, cKO = 5 mice, two-sided unpaired t-test). i Experimental design of jl. j Immunostaining of OLs (CC1+, green) combined with tdTomato (tdT, magenta) expression in the mPFC at 2w. k Recombination efficiency of OLs. (2w: ctl = 3 mice, cKO = 4 mice, two-sided unpaired t-test; 9w: ctl = 4 mice, cKO = 5 mice, two-sided unpaired t-test). l Comparison of recombined and non-recombined OL densities (with or without tdT expression). (2w: ctl = 3 mice, cKO = 4 mice, two-sided unpaired t-tests; 9w: ctl = 4 mice, cKO = 5 mice, two-sided unpaired t-tests). Data are shown as mean ± SEM in ce, h, k and l. Source data are provided as a Source Data file.
Fig. 5
Fig. 5. During early CNS development impaired release of TWEAK from GABABR-deficient OPCs mitigated programmed cell death of interneurons.
a Experimental schedule. b Fluorescent micrographs of excitatory (CtBP-interacting protein (CTIP)+, magenta) and inhibitory (parvalbumin (pv)+, magenta) interneurons co-stained with the apoptotic marker cleaved caspase 3 (CC-3, green) in p5 and p7 mPFC. c Quantification of apoptotic neurons (CC-3+) co-expressing the interneuron marker glutamate decarboxylase 67 (GAD67) and PV or CTIP and T-box brain transcription factor 1 (TBR1) as markers for excitatory neurons. (GAD67: p5-ctl = 3 mice, p5-cKO = 4 mice; p7-ctl = 3 mice, p7-cKO = 5 mice) (PV: p5-ctl = 5 mice, p5-cKO = 3 mice; p7-ctl = 3 mice, p7-cKO = 5 mice) (CTIP: p5-ctl = 7 mice, p5-cKO = 4 mice; p7-ctl = 9 mice, p7-cKO = 3 mice) (TBR1: p5-ctl = 4, p5-cKO = 4; p7-ctl = 4, p7-cKO = 4 mice) (two-sided unpaired t-tests). d Relative mRNA level of TNF like weak inducer of apoptosis (TWEAK) in the medial prefrontal cortex (mPFC), magnetic-activated cell sorted (MACs)-OPCs from ctl and cKO mice as well as Oli-neu cells treated with or without 20 µM CGP 55845 (tissue-ctl = 4 mice, tissue-cKO = 6 mice; MACs-ctl = 8 mice, MACs-cKO = 4 mice; Oli-neu: n = 3 independent experiments; two-sided unpaired t-tests). e Double-immunostaining of TWEAK receptor (TWEAKR, magenta) and PV (green) in the control mPFC at p5. Arrows indicate co-expression of TWEAKR and PV. f Experimental design for in vitro studies. g Immunolabeling of TWEAKR (magenta) on 14 days in vitro (DIV) PV+ interneurons (green). h Immunostaining of apoptotic primary PV+ neurons with CC-3 (green) and PV (magenta) after being treated with conditional medium (CM) of Oli-neu cells co-treated with or without TWEAKR antagonist L524-0366 (L524, 20 µM). White arrows indicate PV+ cells co-expressing CC-3. i Percentage of apoptotic PV+ interneurons of all PV+ interneurons in conditioned medium and treated with a competitive TWEAKR inhibitor (n = 3 independent experiments from distinct samples, one-way ANOVA, Turkey’s multiple comparison). Data are shown as mean ± SEM in c, d, and i. Source data are provided as a Source Data file.
Fig. 6
Fig. 6. In OPC-GABABR cKO mice a perturbed neuronal firing translates into deficits of social behavior.
a Experimental schedule. b Lower gamma band acquired by electroencephalogram recordings. c Violin plot shows decreased gamma oscillation in the cKO mouse brain. (ctl = 24 h from 4 mice, cKO = 24 h from 4 mice, two-sided unpaired t-tests). d Impaired nest building ability of mutant mice. (male: ctl = 10 mice, cKO = 10 mice; female: ctl = 15 mice, cKO = 10 mice, two-sided unpaired t-test). e Scheme of the three-chamber behavior test. f Quantification of the sniffing time with mouse (M) and object (O) (male: ctl = 9 mice, cKO = 9 mice, two-sided paired t-tests; female: ctl = 15 mice, cKO = 9 mice, two-sided paired t-tests). g Quantification of the sniffing time with familiar (F) and stranger (S) mouse (male: ctl = 9 mice, cKO = 9 mice, two-sided paired Wilcoxon test; female: ctl = 15 mice, cKO = 9 mice, two-sided paired t-test). h Scheme of new object recognition test. i Assessment of object preference (male: ctl = 10 mice, cKO = 10 mice; female: ctl = 15 mice, cKO = 9 mice, two-sided unpaired t-test). j Percentage of sniffing time with new object among total sniffing time. (male: ctl = 10 mice, cKO = 10 mice; female: ctl = 15 mice, cKO = 9 mice, two-sided unpaired t-test). k Representative trajectory charts of the animals during the open field test. l, m Both ctl and cKO mice exhibited similar motor activities shown by the speed and distance analysis. (male: ctl = 17 mice, cKO = 14 mice; female: ctl = 18 mice, cKO = 9 mice, two-sided unpaired t-test). Data are shown as mean ± SEM in d, i, j, l and m. In c, data are shown with indications of median and quartiles in thick and thin dashed lines, respectively. Source data are provided as a Source Data file.

References

    1. Douglas RJ, Martin KA. Inhibition in cortical circuits. Curr. Biol. 2009;19:R398–R402. - PubMed
    1. Bai X, Kirchhoff F, Scheller A. Oligodendroglial GABAergic signaling: more than inhibition! Neurosci. Bull. 2021;7:1039–1050. - PMC - PubMed
    1. Marín O. Interneuron dysfunction in psychiatric disorders. Nat. Rev. Neurosci. 2012;13:107–120. - PubMed
    1. Benamer N, Vidal M, Balia M, Angulo MC. Myelination of parvalbumin interneurons shapes the function of cortical sensory inhibitory circuits. Nat. Commun. 2020;11:5151. - PMC - PubMed
    1. Ferguson BR, Gao WJ. PV interneurons: critical regulators of E/I balance for prefrontal cortex-dependent behavior and psychiatric disorders. Front Neural Circuits. 2018;12:37. - PMC - PubMed

Publication types