

EEG theta and N400 responses to congruent versus incongruent brand logos
- PMID: 35296710
- PMCID: PMC8927156
- DOI: 10.1038/s41598-022-08363-1
EEG theta and N400 responses to congruent versus incongruent brand logos
Abstract
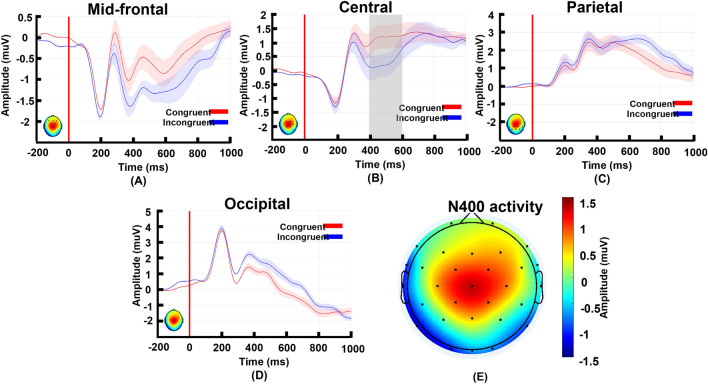
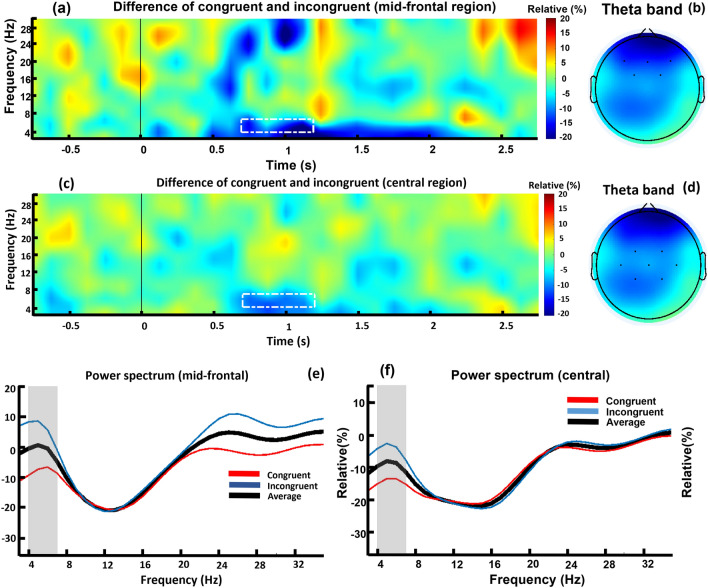
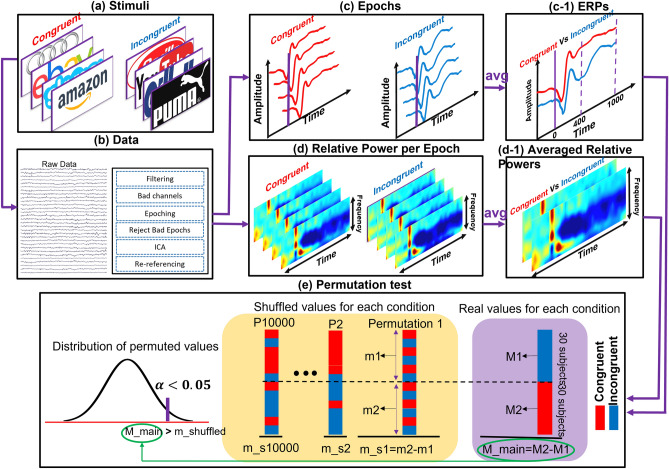
Neuroimaging and behavioral studies have shown that brands convey meaning to consumers. To investigate the immediate reactions of the brain to brand logos, followed either by congruent or incongruent pictorial brand-related cues, can deepen understanding of the semantic processing of brands, and perhaps how consolidated the logo is in consumers' minds. Participants were exposed to different brand-related image sets, that were either congruent (a match between brand-related images and brand logo) or incongruent (a mismatch between brand-related images and brand logo) while having their brain signals recorded. Event-related potential and EEG time-frequency domain features were extracted from the signals of the target image (brand logo). The results showed significantly larger N400 peak and relative theta power increase for incongruent compared to congruent logos, which could be attributed to an error-monitoring process. Thus, we argue that brands are encoded deeply in consumers' minds, and cognitive processing of mismatched (vs matched) brand logos is more difficult, leading to greater error monitoring. The results were mostly consistent with previous studies investigating semantic incongruences in the linguistic field. Therefore, the error-monitoring process could be extended beyond linguistic forms, for example to images and brands.
© 2022. The Author(s).
Conflict of interest statement
The authors declare no competing interests.
Figures


Similar articles
-
Consumers' Implicit Motivation Of Purchasing Luxury Brands: An EEG Study.Psychol Res Behav Manag. 2019 Sep 25;12:913-929. doi: 10.2147/PRBM.S215751. eCollection 2019. Psychol Res Behav Manag. 2019. PMID: 31576184 Free PMC article.
-
Measuring brand association strength with EEG: A single-trial N400 ERP study.PLoS One. 2019 Jun 10;14(6):e0217125. doi: 10.1371/journal.pone.0217125. eCollection 2019. PLoS One. 2019. PMID: 31181083 Free PMC article.
-
Framed or Unframed? An empirical study of the impact of food brand logo frame on consumers' food preferences.Food Res Int. 2023 Apr;166:112602. doi: 10.1016/j.foodres.2023.112602. Epub 2023 Feb 17. Food Res Int. 2023. PMID: 36914326
-
Does the cowl make the monk? Detecting counterfeits in brand names versus logos.Psychon Bull Rev. 2021 Jun;28(3):969-977. doi: 10.3758/s13423-020-01863-z. Epub 2021 Feb 9. Psychon Bull Rev. 2021. PMID: 33565044 Free PMC article.
-
Aesthetic evaluation underpinning brand love relationship development: an activation likelihood estimation meta-analysis and multivariate analysis.Front Neurosci. 2025 Jan 3;18:1443578. doi: 10.3389/fnins.2024.1443578. eCollection 2024. Front Neurosci. 2025. PMID: 39830591 Free PMC article.
Cited by
-
Higher levels of narrativity lead to similar patterns of posterior EEG activity across individuals.Front Hum Neurosci. 2023 May 10;17:1160981. doi: 10.3389/fnhum.2023.1160981. eCollection 2023. Front Hum Neurosci. 2023. PMID: 37234601 Free PMC article.
-
Effects of color-flavor association on visual search process for reference pictures on beverage packaging: behavioral, electrophysiological, and causal mechanisms.Front Psychol. 2024 Sep 9;15:1433277. doi: 10.3389/fpsyg.2024.1433277. eCollection 2024. Front Psychol. 2024. PMID: 39315035 Free PMC article.
-
The influence of message frame and product type on green consumer purchase decisions : an ERPs study.Sci Rep. 2024 Oct 5;14(1):23232. doi: 10.1038/s41598-024-75056-2. Sci Rep. 2024. PMID: 39369070 Free PMC article.
-
Age and vocabulary knowledge differentially influence the N400 and theta responses during semantic retrieval.Dev Cogn Neurosci. 2023 Jun;61:101251. doi: 10.1016/j.dcn.2023.101251. Epub 2023 May 2. Dev Cogn Neurosci. 2023. PMID: 37141791 Free PMC article.
-
Motivation in the metaverse: A dual-process approach to consumer choices in a virtual reality supermarket.Front Neurosci. 2023 Feb 16;17:1062980. doi: 10.3389/fnins.2023.1062980. eCollection 2023. Front Neurosci. 2023. PMID: 36875641 Free PMC article.
References
-
- Statista Research Department. Brand value—statistics & facts. Advertising & Marketing, Brands & Leadershttps://www.statista.com/topics/1664/brand-value/ (2021). Accessed 14 Sep 2021.
-
- Cobb-Walgren CJ, Ruble CA, Donthu N. Brand equity, brand preference, and purchase intent. J. Advert. 1995;24:25–40.
-
- Laroche M, Kim C, Zhou L. Brand familiarity and confidence as determinants of purchase intention: An empirical test in a multiple brand context. J. Bus. Res. 1996;37:115–120.
-
- McClure SM, et al. Neural correlates of behavioral preference for culturally familiar drinks. Neuron. 2004;44:379–387. - PubMed
-
- Reimann M, Castaño R, Zaichkowsky J, Bechara A. How we relate to brands: Psychological and neurophysiological insights into consumer–brand relationships. J. Consum. Psychol. 2012;22:128–142.
Publication types
MeSH terms
LinkOut - more resources
Full Text Sources
