. 2022 Mar 16;12(1):4527.
doi: 10.1038/s41598-022-08619-w.

Integrative analysis reveals the functional implications and clinical relevance of pyroptosis in low-grade glioma

Affiliations

Integrative analysis reveals the functional implications and clinical relevance of pyroptosis in low-grade glioma

Lin Shen et al. Sci Rep. .

Abstract

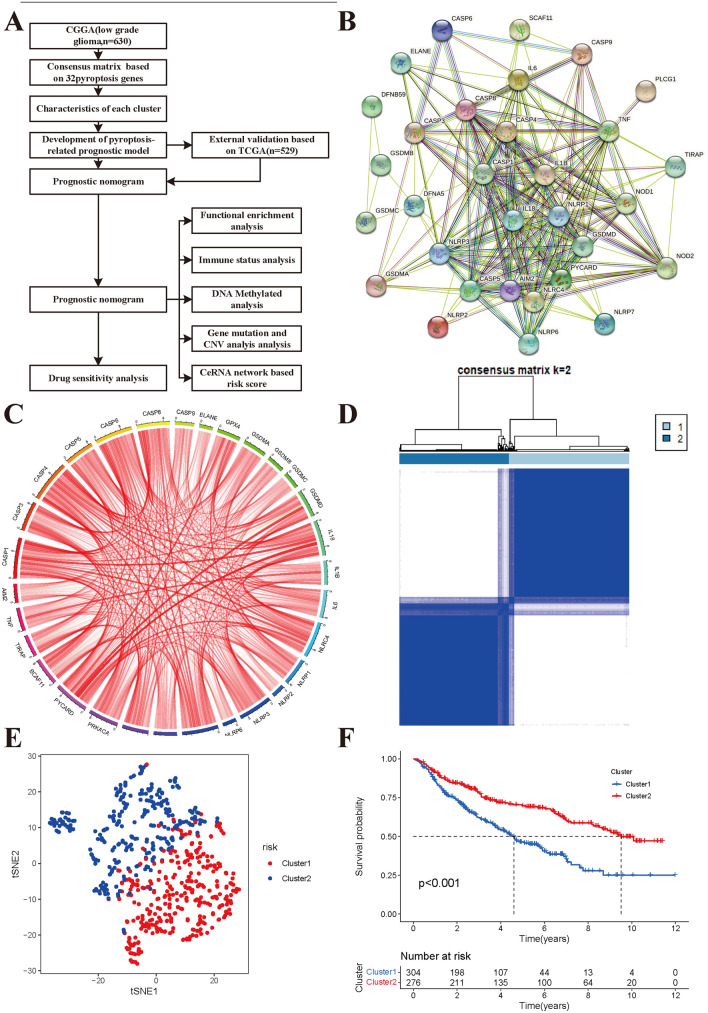
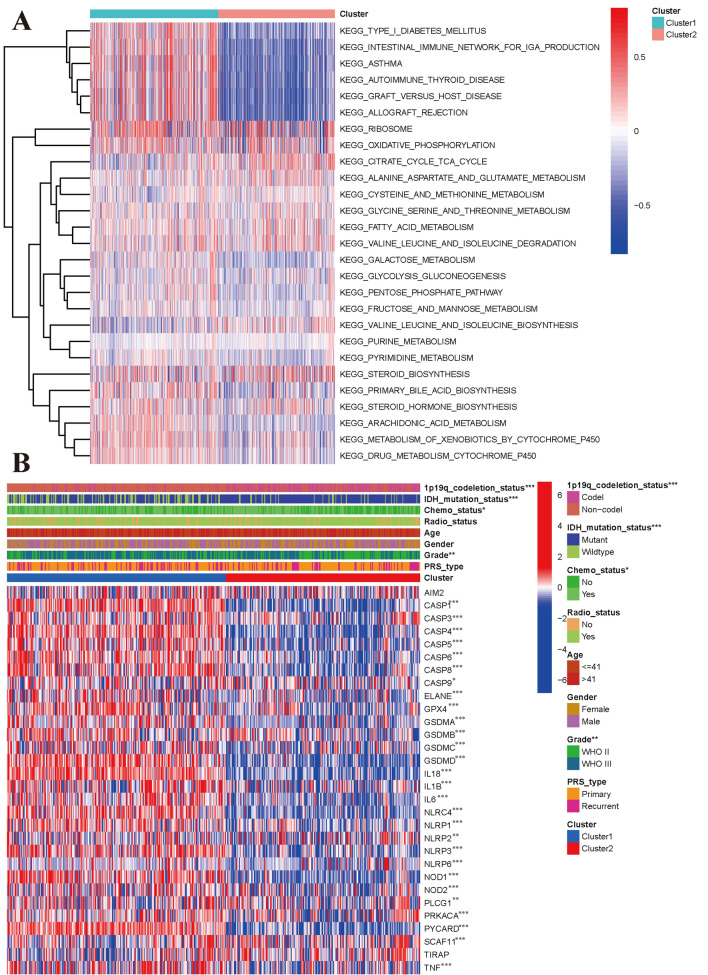
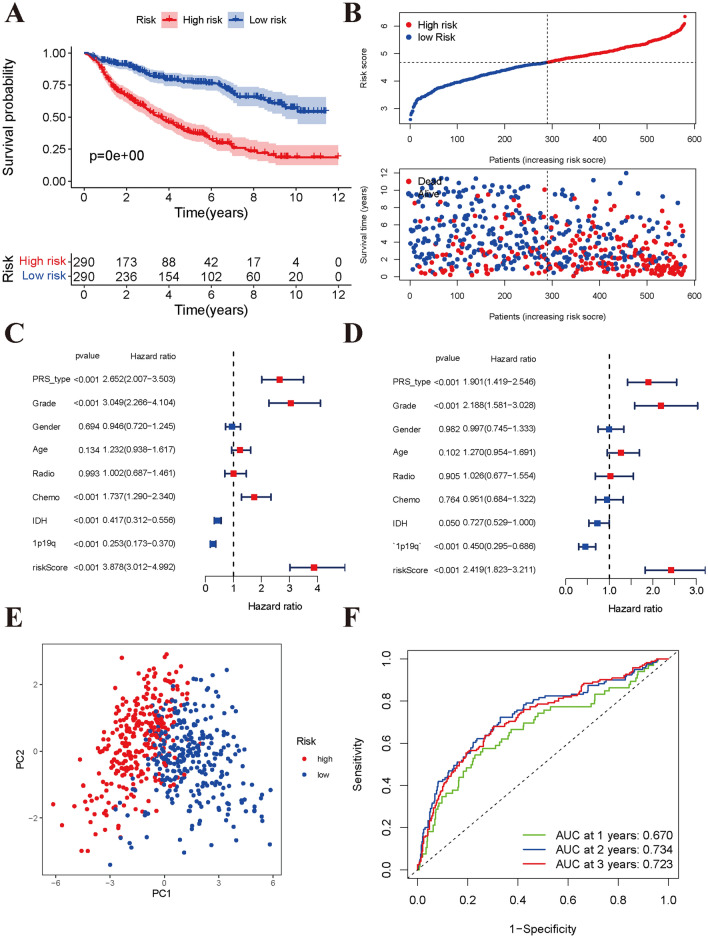
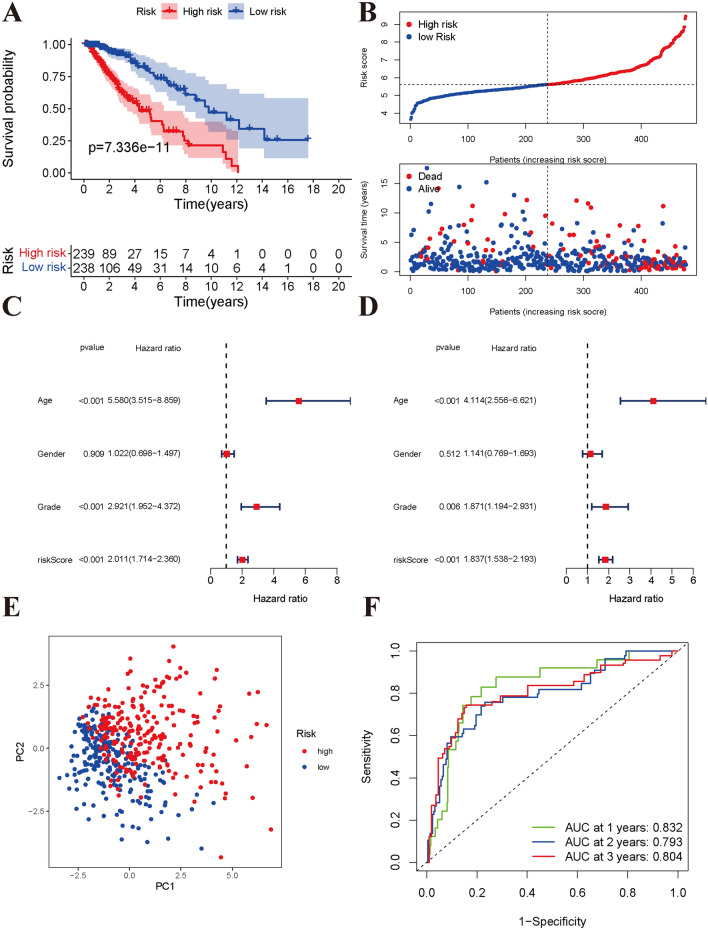
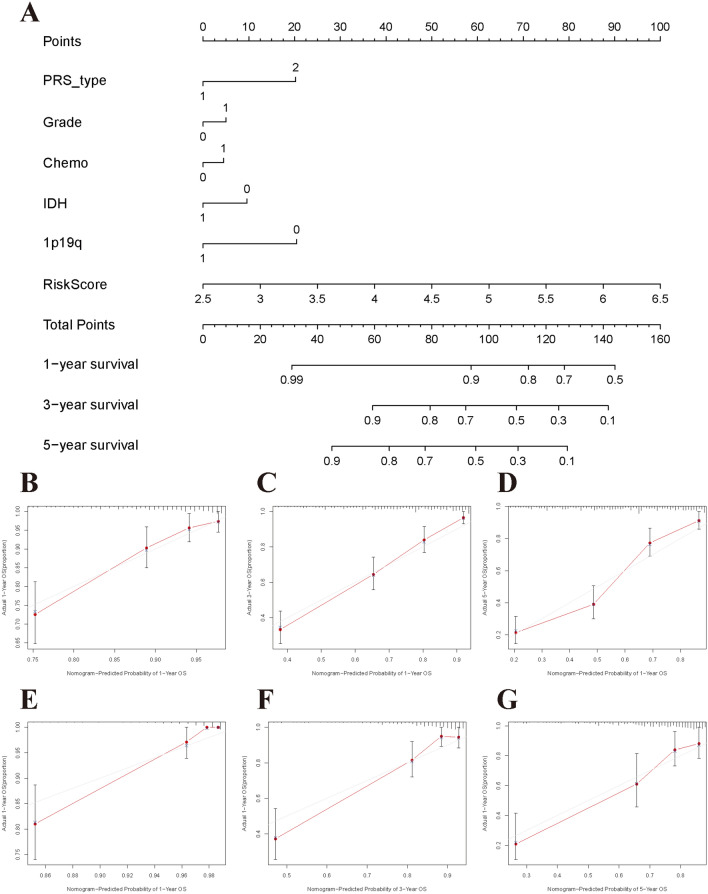
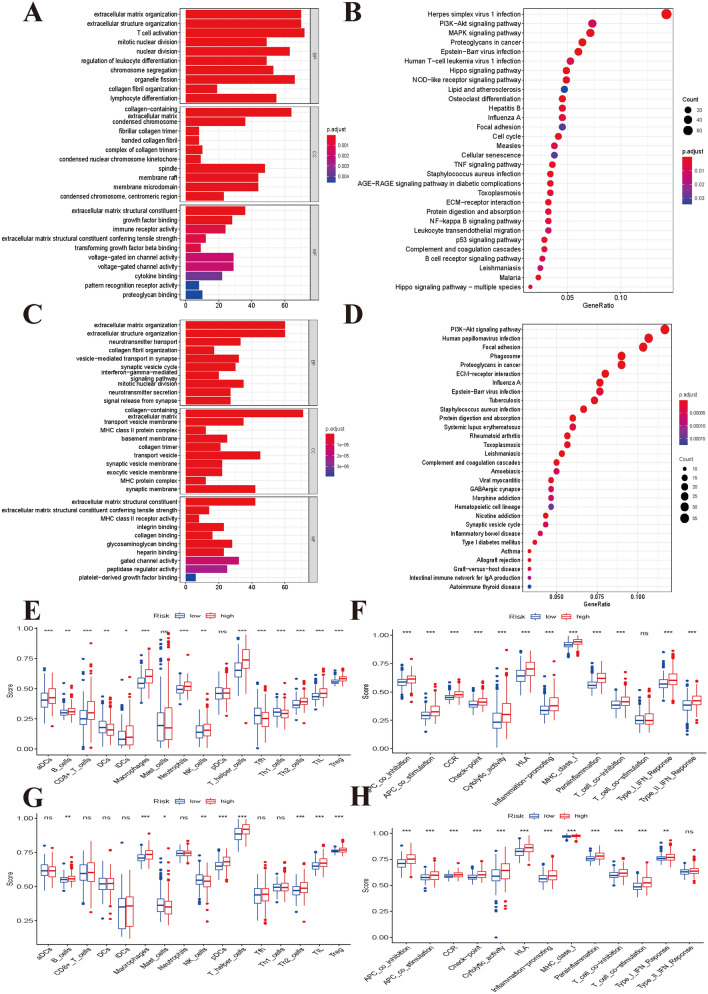
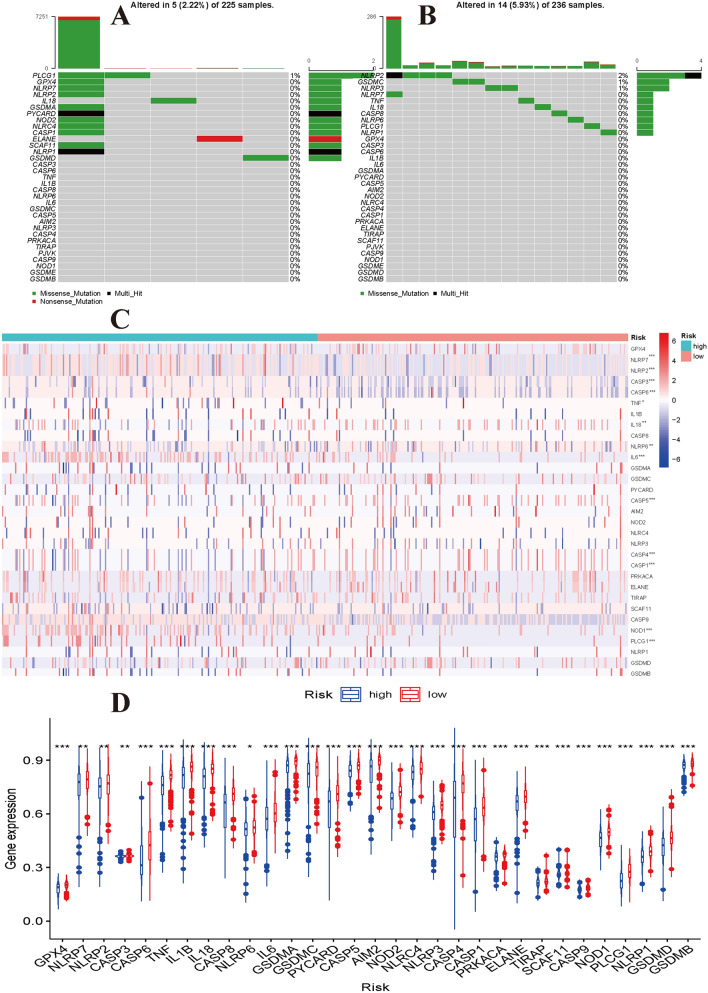
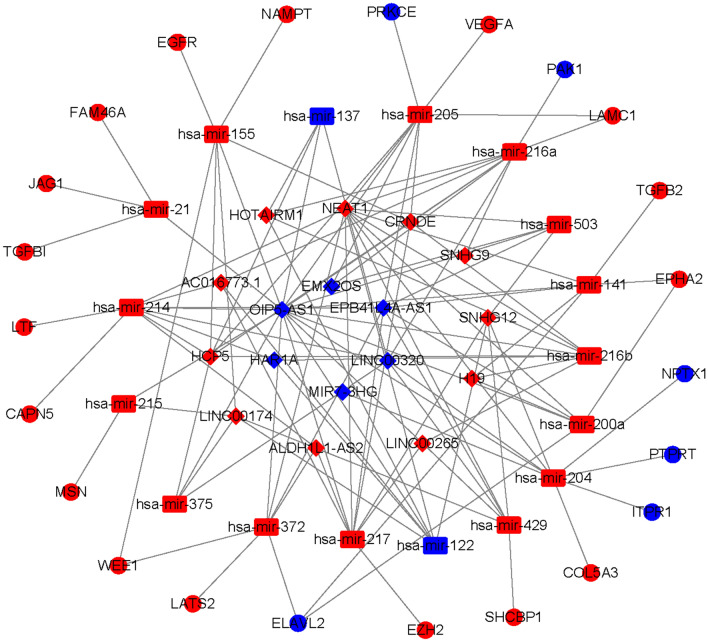
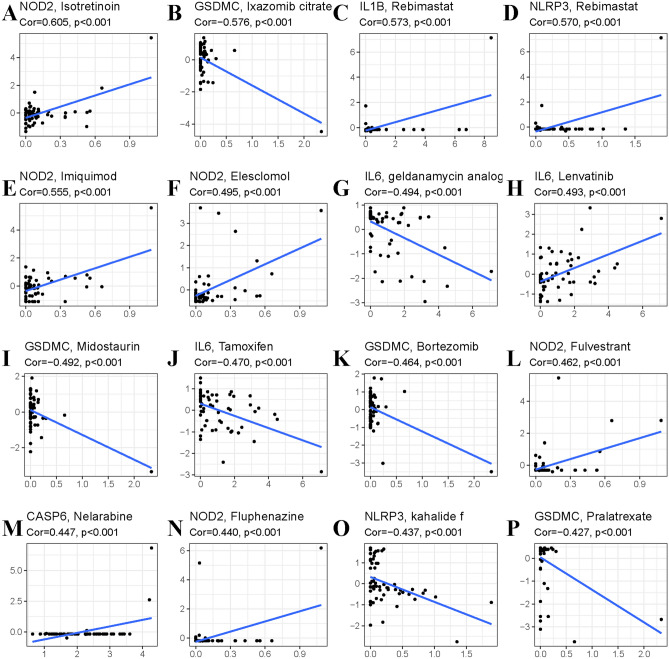
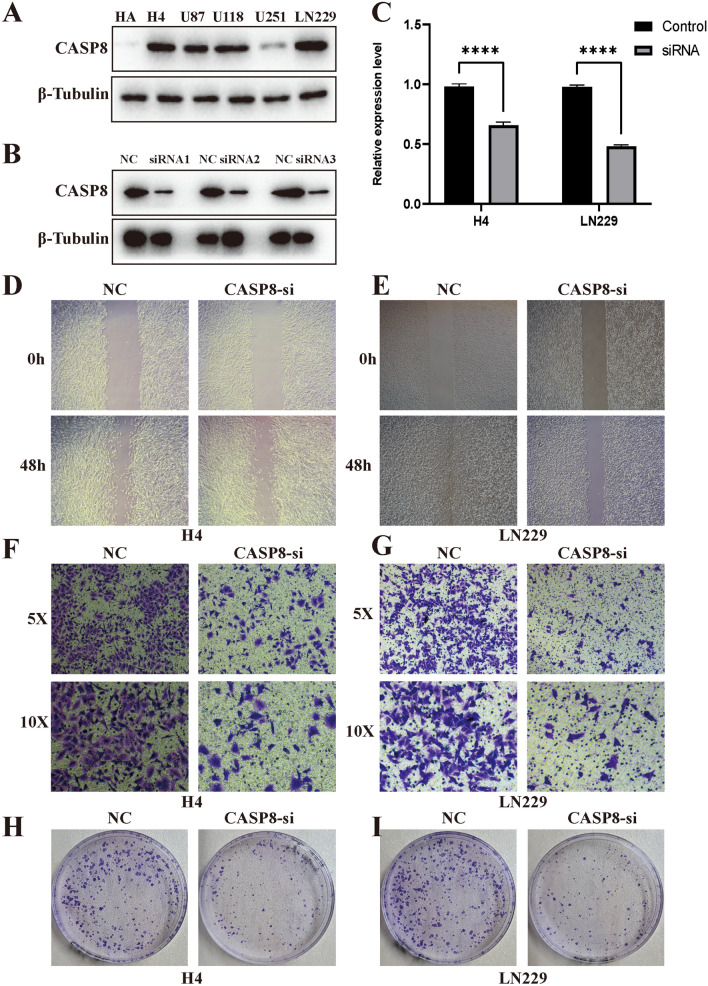
Using the Chinese Glioma Genome Atlas (training dataset) and The Cancer Genome Atlas (validation dataset), we found that low-grade gliomas can be divided into two molecular subclasses based on 30 pyroptosis genes. Cluster 1 presented higher immune cell and immune function scores and poorer prognosis than Cluster 2. We established a prognostic model based on 10 pyroptosis genes; the model could predict overall survival in glioma and was well validated in an independent dataset. The high-risk group had relatively higher immune cell and immune function scores and lower DNA methylation levels in pyroptosis genes than the low-risk group. There were no marked differences in pyroptosis gene alterations between the high- and low-risk groups. The competing endogenous RNA (ceRNA) regulatory network uncovered the lncRNA-miRNA-mRNA regulation patterns of the different risk groups in low-grade glioma. Five pairs of target genes and drugs were identified. In vitro, CASP8 silencing inhibited the migration and invasion of glioma cells. The expression of pyroptosis genes can reflect the molecular biological and clinical features of low-grade glioma subclasses. The developed prognostic model can predict overall survival and distinguish molecular alterations in patients. Our integrated analyses could provide valuable guidelines for improving risk management and therapy for low-grade glioma patients.


Conflict of interest statement

The authors declare no competing interests.

Figures

Figure 1
Figure 1
Consensus clustering identifies the molecular subtype of low-grade glioma using CGGA dataset. (A) Flow diagram of integrated analysis in the study. (B) Protein–protein interaction network of identified pyroptosis in the STRING. (C) The positive (red) and negative (green) correlations of pyroptosis genes using Spearman method. (D) Consensus clustering identified optimal number of molecular subtypes for low-grade glioma (k = 2). (E) The tSEN2 analysis revealed the marked two subclasses in low-grade glioma. (F) Kaplan–Meier survival curves of two subclasses (blue: cluster 1; red: cluster 2).
Figure 2
Figure 2
Different pathway enrichment and clinical relevance of two subclasses based on CGGA dataset. (A) Gene set variation analysis of two subclasses. (B) Expression levels of pyroptosis genes between two subclasses and its correlations with clinical parameters.
Figure 3
Figure 3
Developing a pyroptosis genes signature can predict overall survival in CGGA cohort. (A) Kaplan–Meier survival curves of high- and low-risk groups divided by risk score. (B) Distributions of risk score and survival time in different risk groups. (C) Univariate cox analysis identified the correlation of risk score and overall survival in low-grade glioma. (D) Multivariate cox analysis identified the correlation of risk score and overall survival in low-grade glioma. (E) Principal component analysis showed two markedly distributions for high- and low-risk groups. (F) The predict ability of risk score for 1-year, 2-year, and 3-year overall survival.
Figure 4
Figure 4
Validation of prognostic model based pyroptosis genes in TCGA cohort. (A) Kaplan–Meier survival curves of high- and low-risk groups divided by risk score. (B) Distributions of risk score and survival time in different risk groups. (C) Univariate cox analysis identified the correlation of risk score and overall survival in low-grade glioma. (D) Multivariate cox analysis identified the correlation of risk score and overall survival in low-grade glioma. (E) Principal component analysis showed two markedly distributions for high- and low-risk groups. (F) The predict ability of risk score for 1-year, 2-year, and 3-year overall survival.
Figure 5
Figure 5
Clinical application and assessment of nomogram model based on pyroptosis genes signature. (A) Nomogram plot using CGGA dataset. (BD) The 1-year, 3-year, and 5-year calibration curves in the CGGA cohort. (EG) The 1-year, 3-year, and 5-year calibration curves in the TCGA cohort.
Figure 6
Figure 6
Function enrichment and immune status analyses between high- and low-risk groups (Permission for KEGG has been obtained from Kanehisa laboratories). (A) GO enrichment and (B) KEGG pathway analyses based on differentially expressed genes between high- and low- risk groups in CGGA cohort. (C) GO enrichment and (D) KEGG pathway analyses based on differentially expressed genes between high- and low- risk groups in TCGA cohort. (E) Comparisons of immune cells and (F) immune-related pathways between high- and low-risk groups in CGGA cohort. (G) Comparisons of immune cells and (H) immune-related pathways between high- and low-risk groups in TCGA cohort.
Figure 7
Figure 7
Molecular alterations of pyroptosis genes in TCGA dataset. (A) The mutations frequencies in low-risk group and (B) in high-risk group. (C) Somatic copy number differences between high- and low-risk groups. (D) The differential expression levels of DNA methylation between high- and low-risk groups.
Figure 8
Figure 8
The ceRNA regulation network based on differentially expressed mRNA, lncRNA, and miRNA between high- and low-risk groups in TCGA dataset (red: up-regulation. blue: down-regulation; circle: mRNA, rhombus: lncRNA, rectangle: mirRNA).
Figure 9
Figure 9
Top 16 potential compounds related with pyroptosis genes. (A) NOD2 and isotretinoin. (B) GSDMC and Ixazomib. (C) IL1B and Rebimastat. (D) NLRP3 and Rebimastat. (E) NOD2 and Imuiquimod. (F) NOD2 and Elesclomol. (G) IL6 and Geldanamycin analog. (H) IL6 and Lenvatinib. (I) GSDMC and Midostaurin. (J) IL6 and Tamoxifen. (K) GSDMC and Bortezomib. (L) NOD2 and Fulvestrant. (M) CASP6 and Nelarabine. (N) NOD2 and Fulvestrant. (O) NLRP3 and Kahalide. (P) GSDMC and Pralatrexate.
Figure 10
Figure 10
CASP8 promotes progression of glioma cells. (A) Expression levels of CASP8 in glioma cell lines. (B) The western blot of CASP2 in U87, LN229, H4 cell lines after siRNA. (C) The mRNA expression level of CSAP8 in H4 and LN229 after siRNA. (D,E) CASP8 silencing inhibited migration of glioma cells. (F,G) CASP8 silencing inhibited invasion of glioma cells. (H,I) CASP8 silencing inhibited growth of glioma cells.

Similar articles

Cited by

References

    1. Weller M, et al. Glioma. Nat. Rev. Dis. Primers. 2015;1:15017. doi: 10.1038/nrdp.2015.17. - DOI - PubMed
    1. Chen R, Smith-Cohn M, Cohen AL, Colman H. Glioma subclassifications and their clinical significance. Neurotherapeutics. 2017;14:284–297. doi: 10.1007/s13311-017-0519-x. - DOI - PMC - PubMed
    1. Wang T, Mehta MP. Low-grade glioma radiotherapy treatment and trials. Neurosurg. Clin. N. Am. 2019;30:111–118. doi: 10.1016/j.nec.2018.08.008. - DOI - PubMed
    1. de Blank P, Bandopadhayay P, Haas-Kogan D, Fouladi M, Fangusaro J. Management of pediatric low-grade glioma. Curr. Opin. Pediatr. 2019;31:21–27. doi: 10.1097/MOP.0000000000000717. - DOI - PMC - PubMed
    1. de Blank P, Fouladi M, Huse JT. Molecular markers and targeted therapy in pediatric low-grade glioma. J. Neurooncol. 2020;150:5–15. doi: 10.1007/s11060-020-03529-1. - DOI - PubMed

Publication types

Substances