

Development of spray-drying-based surface-enhanced Raman spectroscopy
- PMID: 35296775
- PMCID: PMC8927375
- DOI: 10.1038/s41598-022-08598-y
Development of spray-drying-based surface-enhanced Raman spectroscopy
Abstract
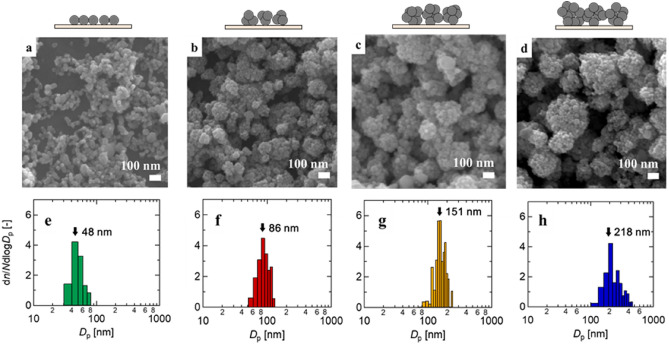
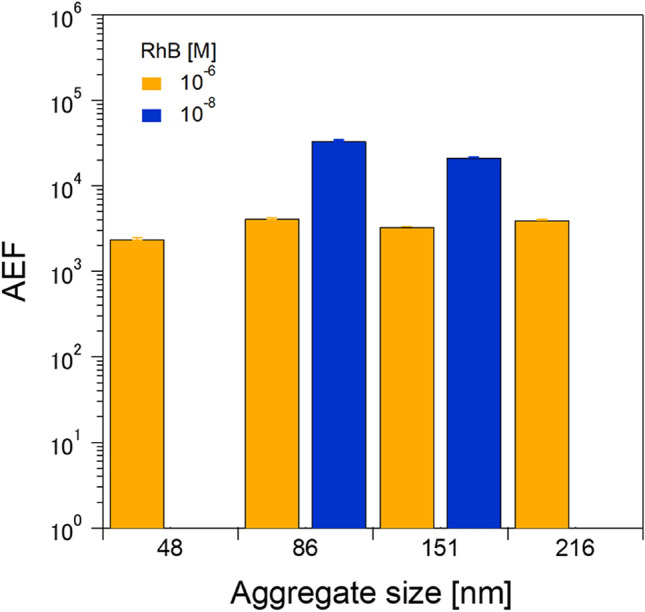
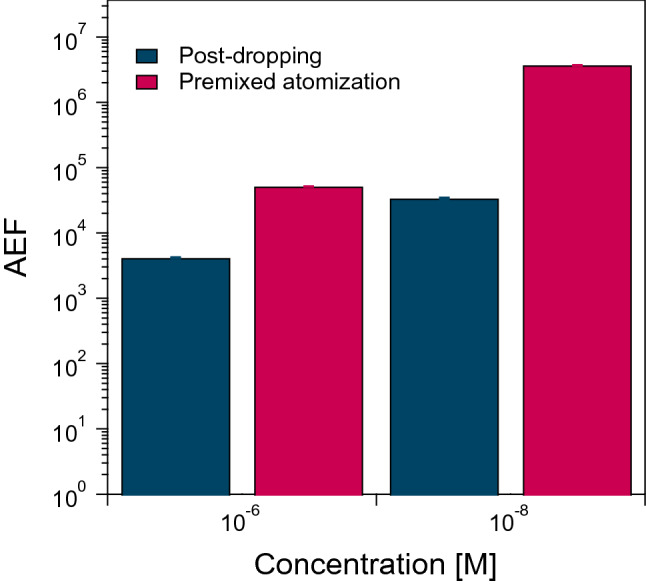
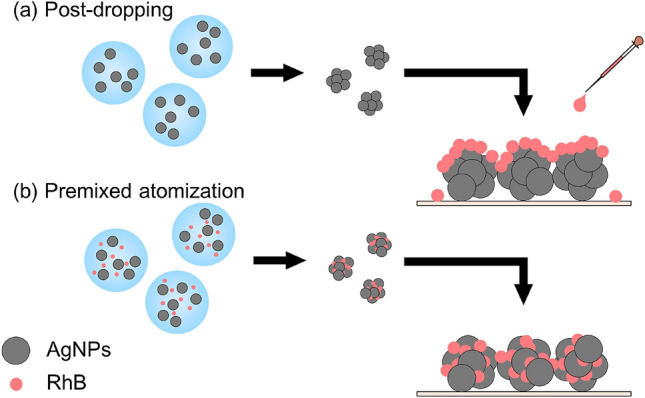
We report a spray-drying method to fabricate silver nanoparticle (AgNP) aggregates for application in surface-enhanced Raman spectroscopy (SERS). A custom-built system was used to fabricate AgNP aggregates of four sizes, 48, 86, 151, and 218 nm, from drying droplets containing AgNPs atomized from an AgNP suspension. Sample solutions of Rhodamine B (RhB) at 10-6, 10-8, and 10-10 M concentrations were dropped onto the AgNP aggregates as probe molecules to examine the enhancement of the Raman signals of the RhB. The ordering of the analytical enhancement factors (AEFs) by aggregate size at a 10-6 M RhB was 86 nm > 218 nm > 151 nm > 48 nm. When RhB concentrations are below 10-8 M, the 86 and 151 nm AgNP aggregates show clear RhB peaks. The AEFs of the 86 nm AgNP aggregates were the highest in all four aggregates and higher than those of the 218-nm aggregates, although the 218-nm aggregates had more hot spots where Raman enhancement occurred. This finding was attributable to the deformation and damping of the electron cloud in the highly aggregated AgNPs, reducing the sensitivity for Raman enhancement. When RhB was premixed with the AgNP suspension prior to atomization, the AEFs at 10-8 M RhB rose ~ 100-fold compared to those in the earlier experiments (the post-dropping route). This significant enhancement was probably caused by the increased opportunity for the trapping of the probe molecules in the hot spots.
© 2022. The Author(s).
Conflict of interest statement
The authors declare no competing interests.
Figures


Similar articles
-
Aggregation of Ag nanoparticle based on surface acoustic wave for surface-enhanced Raman spectroscopy detection of dopamine.Anal Chim Acta. 2024 Jan 2;1285:342036. doi: 10.1016/j.aca.2023.342036. Epub 2023 Nov 19. Anal Chim Acta. 2024. PMID: 38057052
-
Annealing Temperature-Dependent Surface-Enhanced Raman spectroscopy on MoS2-Covered silver nanoparticle array.Spectrochim Acta A Mol Biomol Spectrosc. 2022 Jul 5;275:121159. doi: 10.1016/j.saa.2022.121159. Epub 2022 Mar 15. Spectrochim Acta A Mol Biomol Spectrosc. 2022. PMID: 35306305
-
Fabrication of surface-enhanced Raman spectroscopy substrates using silver nanoparticles produced by laser ablation in liquids.Spectrochim Acta A Mol Biomol Spectrosc. 2023 Aug 5;296:122694. doi: 10.1016/j.saa.2023.122694. Epub 2023 Apr 5. Spectrochim Acta A Mol Biomol Spectrosc. 2023. PMID: 37030254 Review.
-
Silver nanoparticle-based SERS sensors for sensitive detection of amyloid-β aggregates in biological fluids.Talanta. 2024 Jan 1;266(Pt 1):124970. doi: 10.1016/j.talanta.2023.124970. Epub 2023 Jul 20. Talanta. 2024. PMID: 37536108
-
Surface-enhanced Raman scattering: realization of localized surface plasmon resonance using unique substrates and methods.Anal Bioanal Chem. 2009 Aug;394(7):1747-60. doi: 10.1007/s00216-009-2762-4. Epub 2009 Apr 22. Anal Bioanal Chem. 2009. PMID: 19384546 Review.
Cited by
-
Surface-Enhanced Raman Scattering on Size-Classified Silver Nanoparticles Generated by Laser Ablation.ACS Omega. 2024 Aug 25;9(36):37716-37723. doi: 10.1021/acsomega.4c03046. eCollection 2024 Sep 10. ACS Omega. 2024. PMID: 39281954 Free PMC article.
-
Functionalized silver nanoparticles for SERS amplification with enhanced reproducibility and for ultrasensitive optical fiber sensing in environmental and biochemical assays.RSC Adv. 2022 Nov 1;12(48):31352-31362. doi: 10.1039/d2ra06074d. eCollection 2022 Oct 27. RSC Adv. 2022. PMID: 36348993 Free PMC article.
References
-
- Albanese S, Taiani MVE, De Vivo B, Lima A. An environmental epidemiological study based on the stream sediment geochemistry of the Salerno province (Campania region, Southern Italy) J. Geochem. Explor. 2013;131:59–66.
-
- Li Z, Ma Z, van der Kuijp TJ, Yuan Z, Huang L. A review of soil heavy metal pollution from mines in China: Pollution and health risk assessment. Sci. Total Environ. 2014;468–469:843–853. - PubMed
-
- Mazumdar K, Das S. Phytoremediation of pb, zn, fe, and mg with 25 wetland plant species from a paper mill contaminated site in north east India. Environ. Sci. Pollut. Res. 2015;22:701–710. - PubMed
-
- Kumar V, et al. Assessment of heavy-metal pollution in three different Indian water bodies by combination of multivariate analysis and water pollution indices. Hum. Ecol. Risk Assess. 2020;26:1–16.
-
- Soliman Sabra F, El-Deeb Mehana E-S. Pesticides toxicity in fish with particular reference to insecticides. Asian J. Agric. Food Sci. 2015;3:2321–1571.
Publication types
MeSH terms
Substances
LinkOut - more resources
Full Text Sources
Miscellaneous
