. 2022 Mar;603(7903):907-912.
doi: 10.1038/s41586-022-04480-z. Epub 2022 Mar 16.

Human gut bacteria produce ΤΗ17-modulating bile acid metabolites

Affiliations

Human gut bacteria produce ΤΗ17-modulating bile acid metabolites

Donggi Paik et al. Nature. 2022 Mar.

Abstract

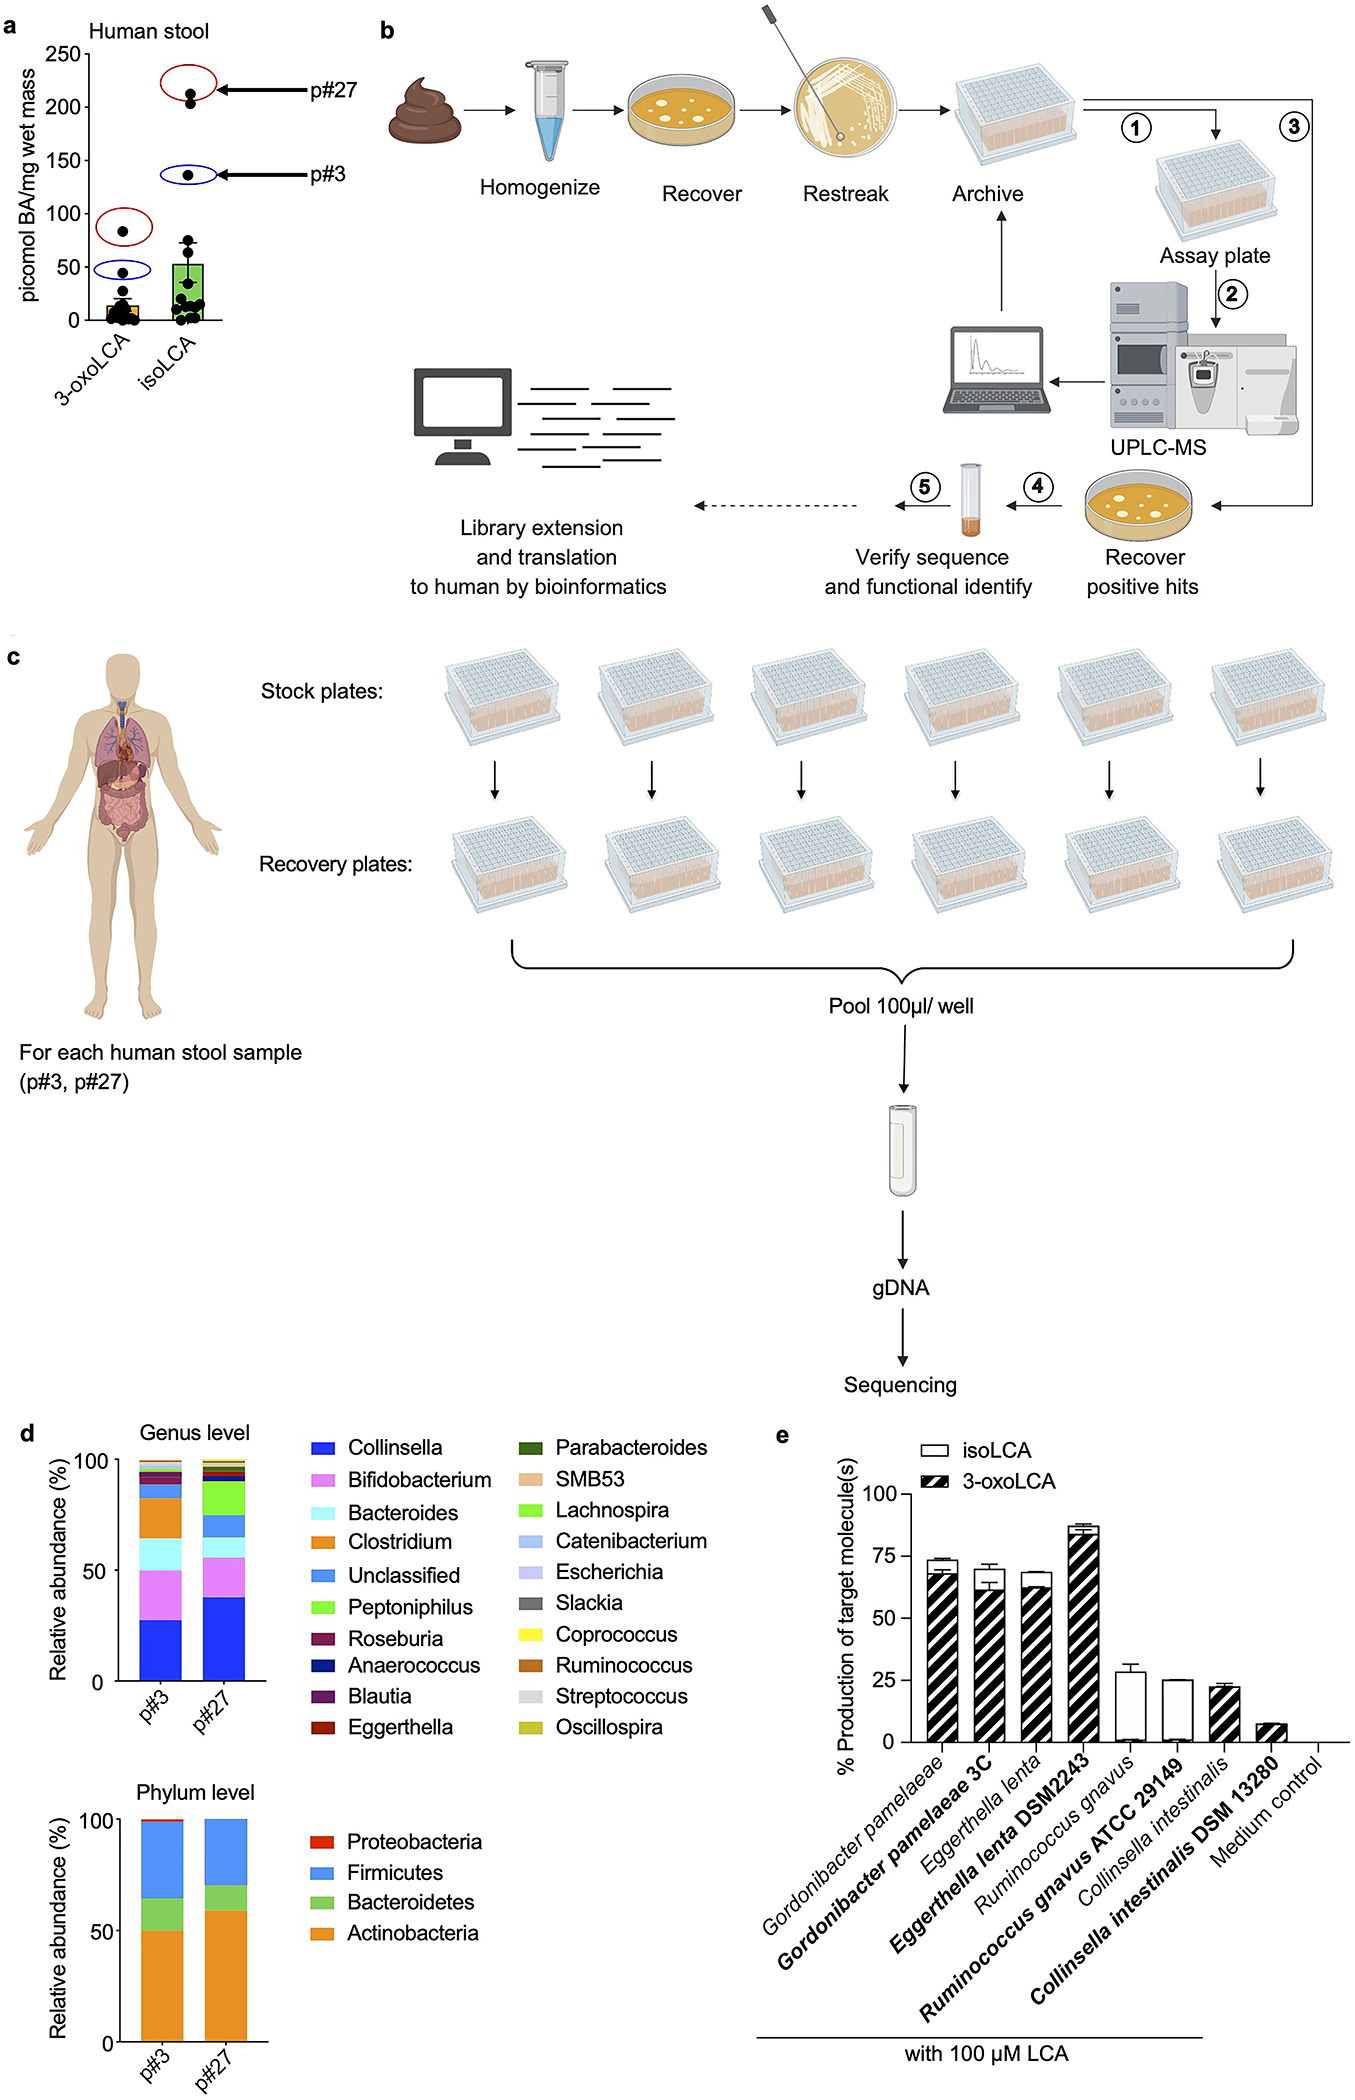
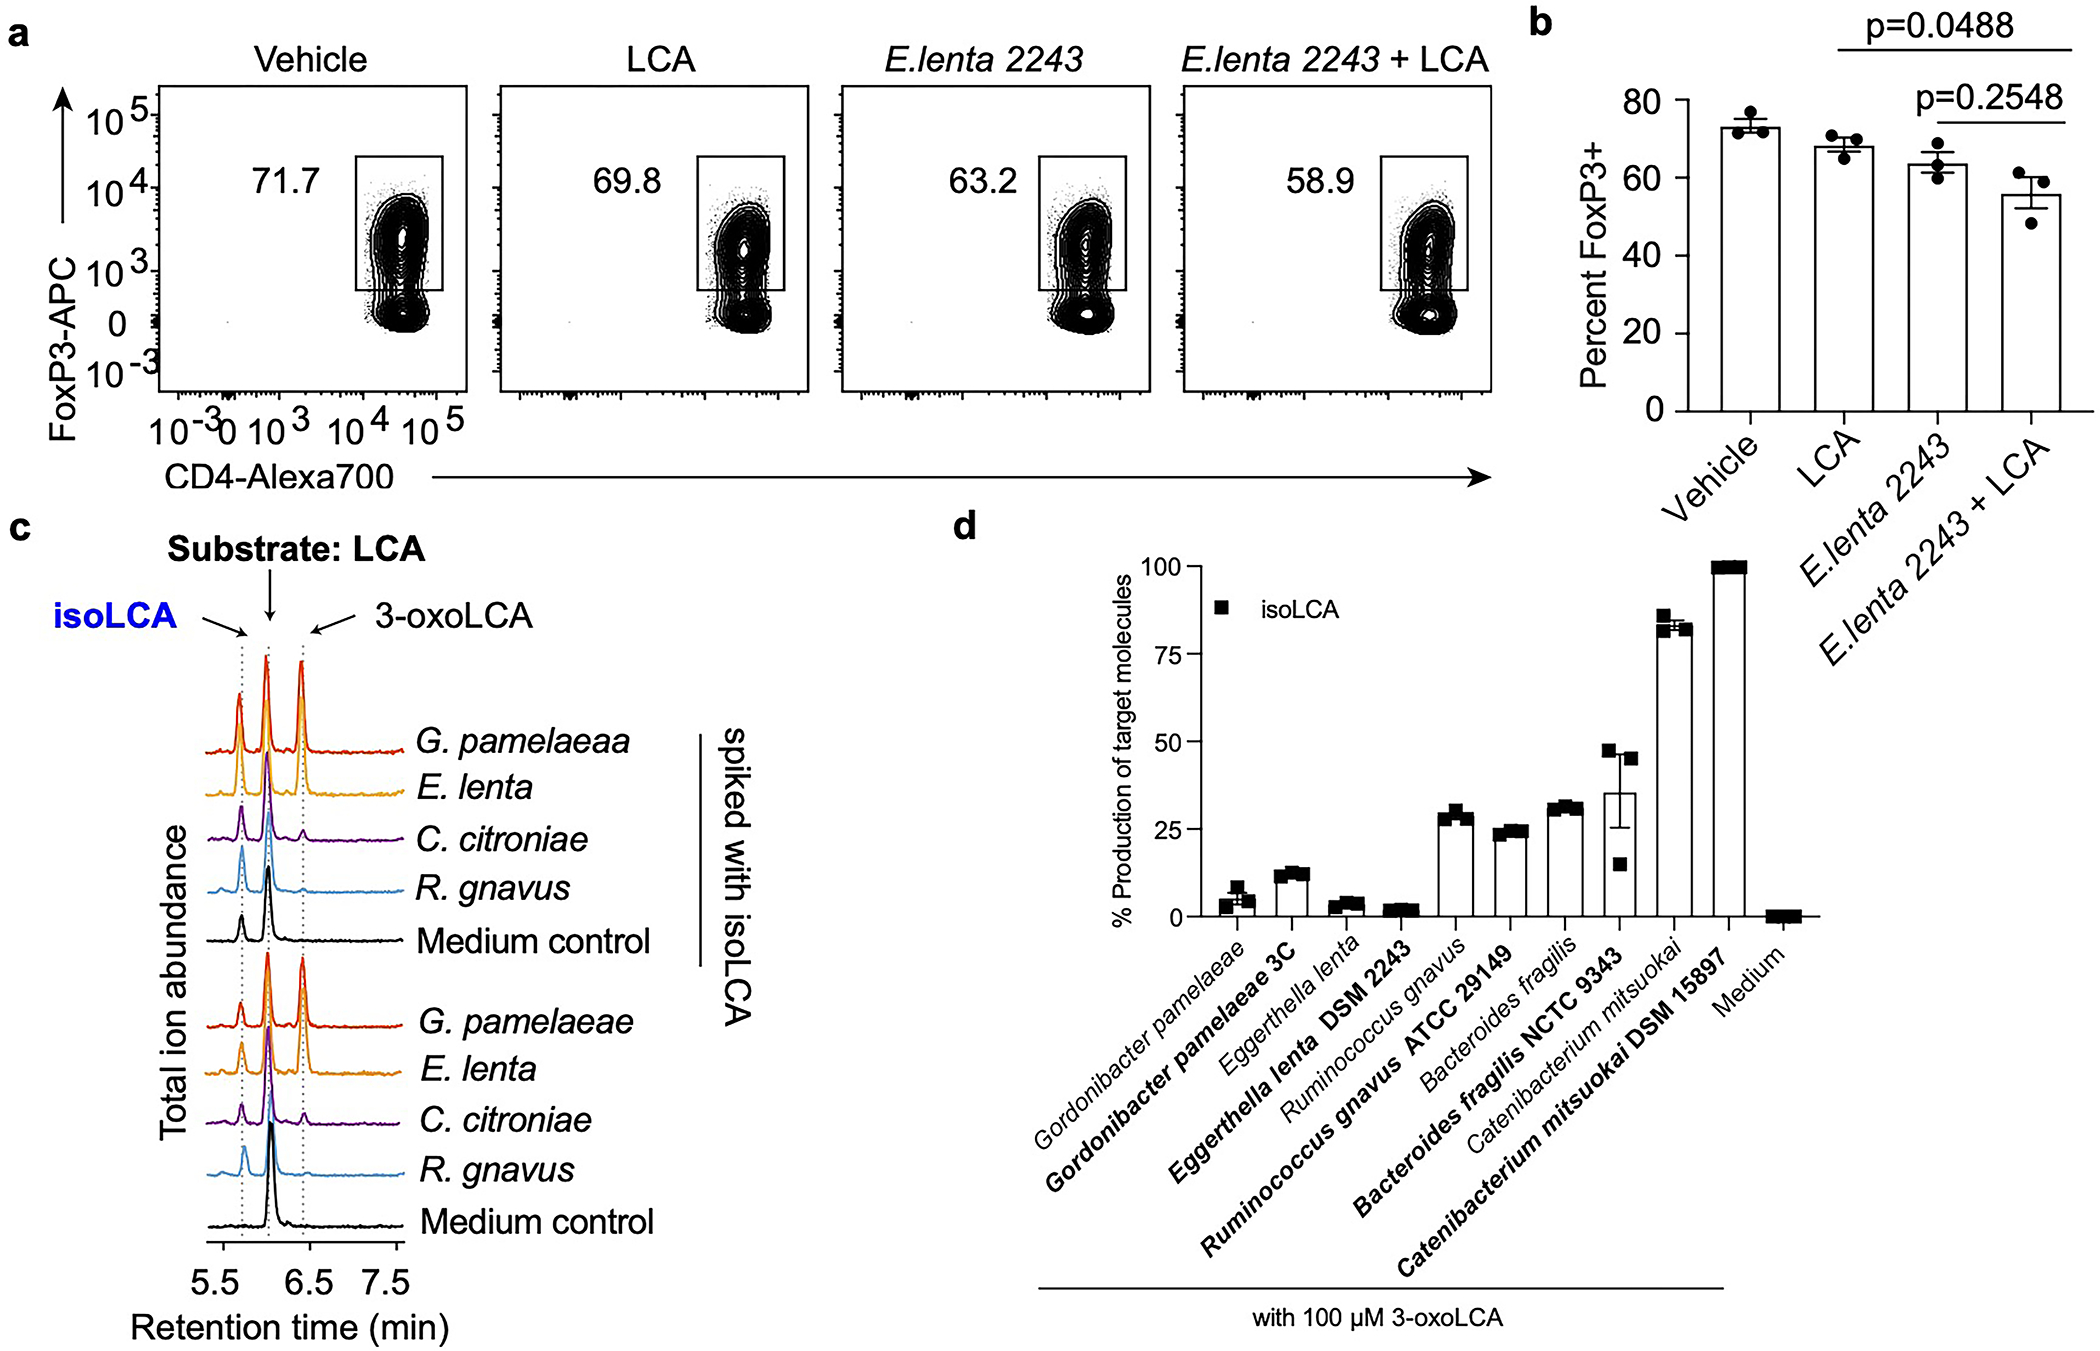
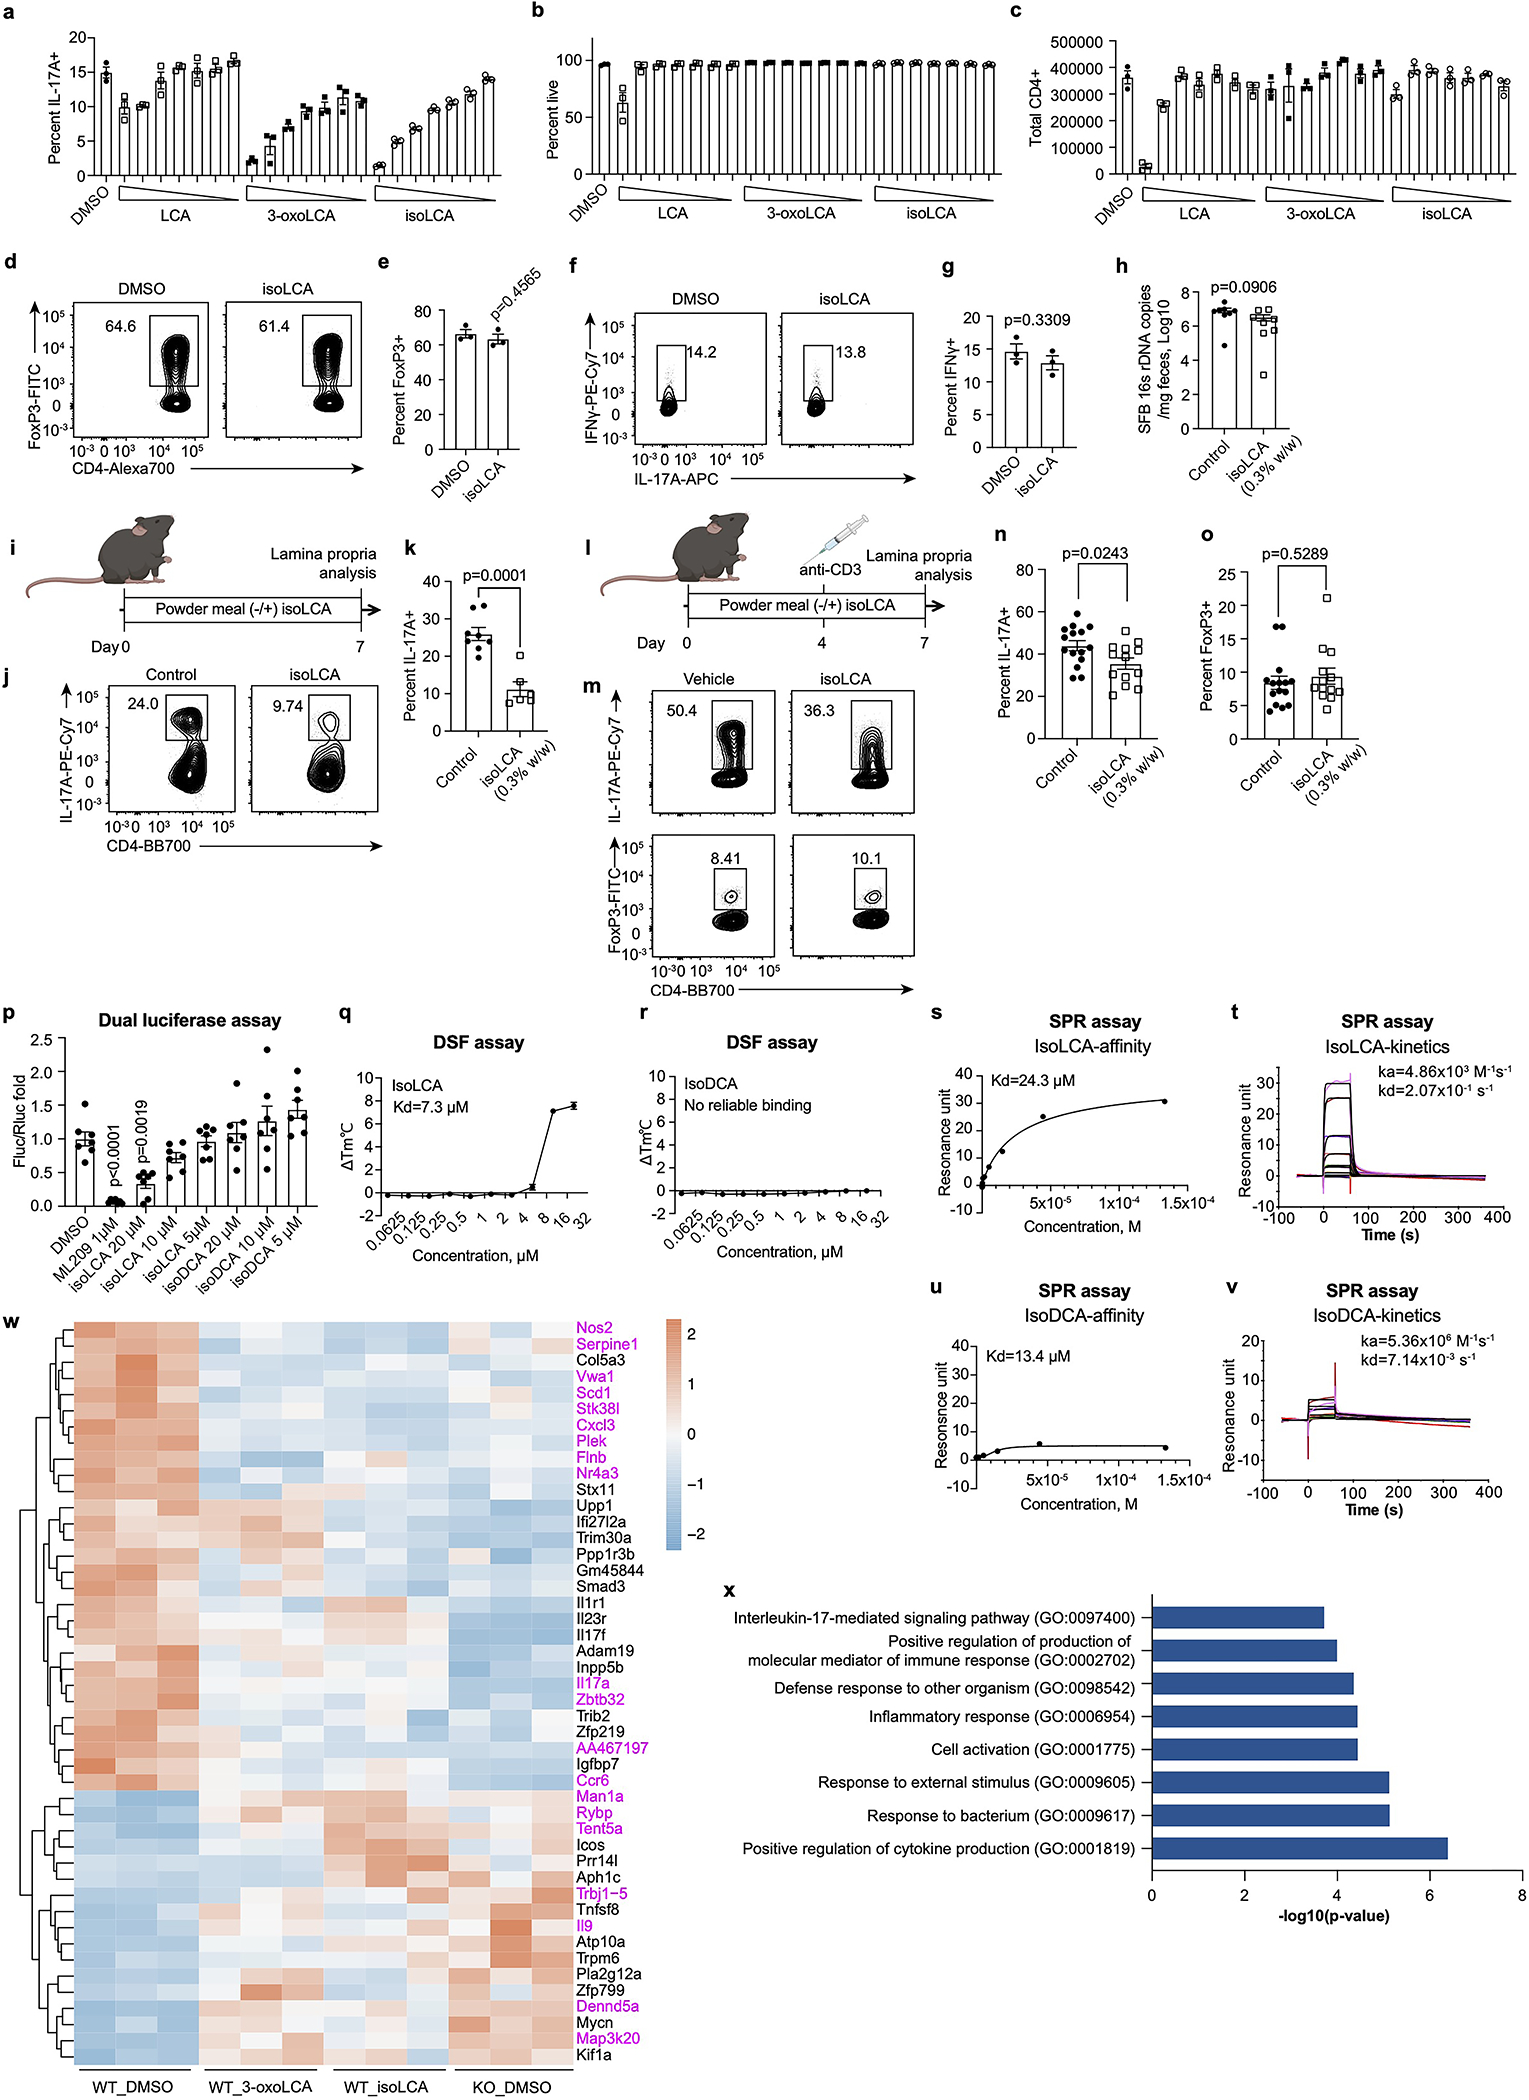
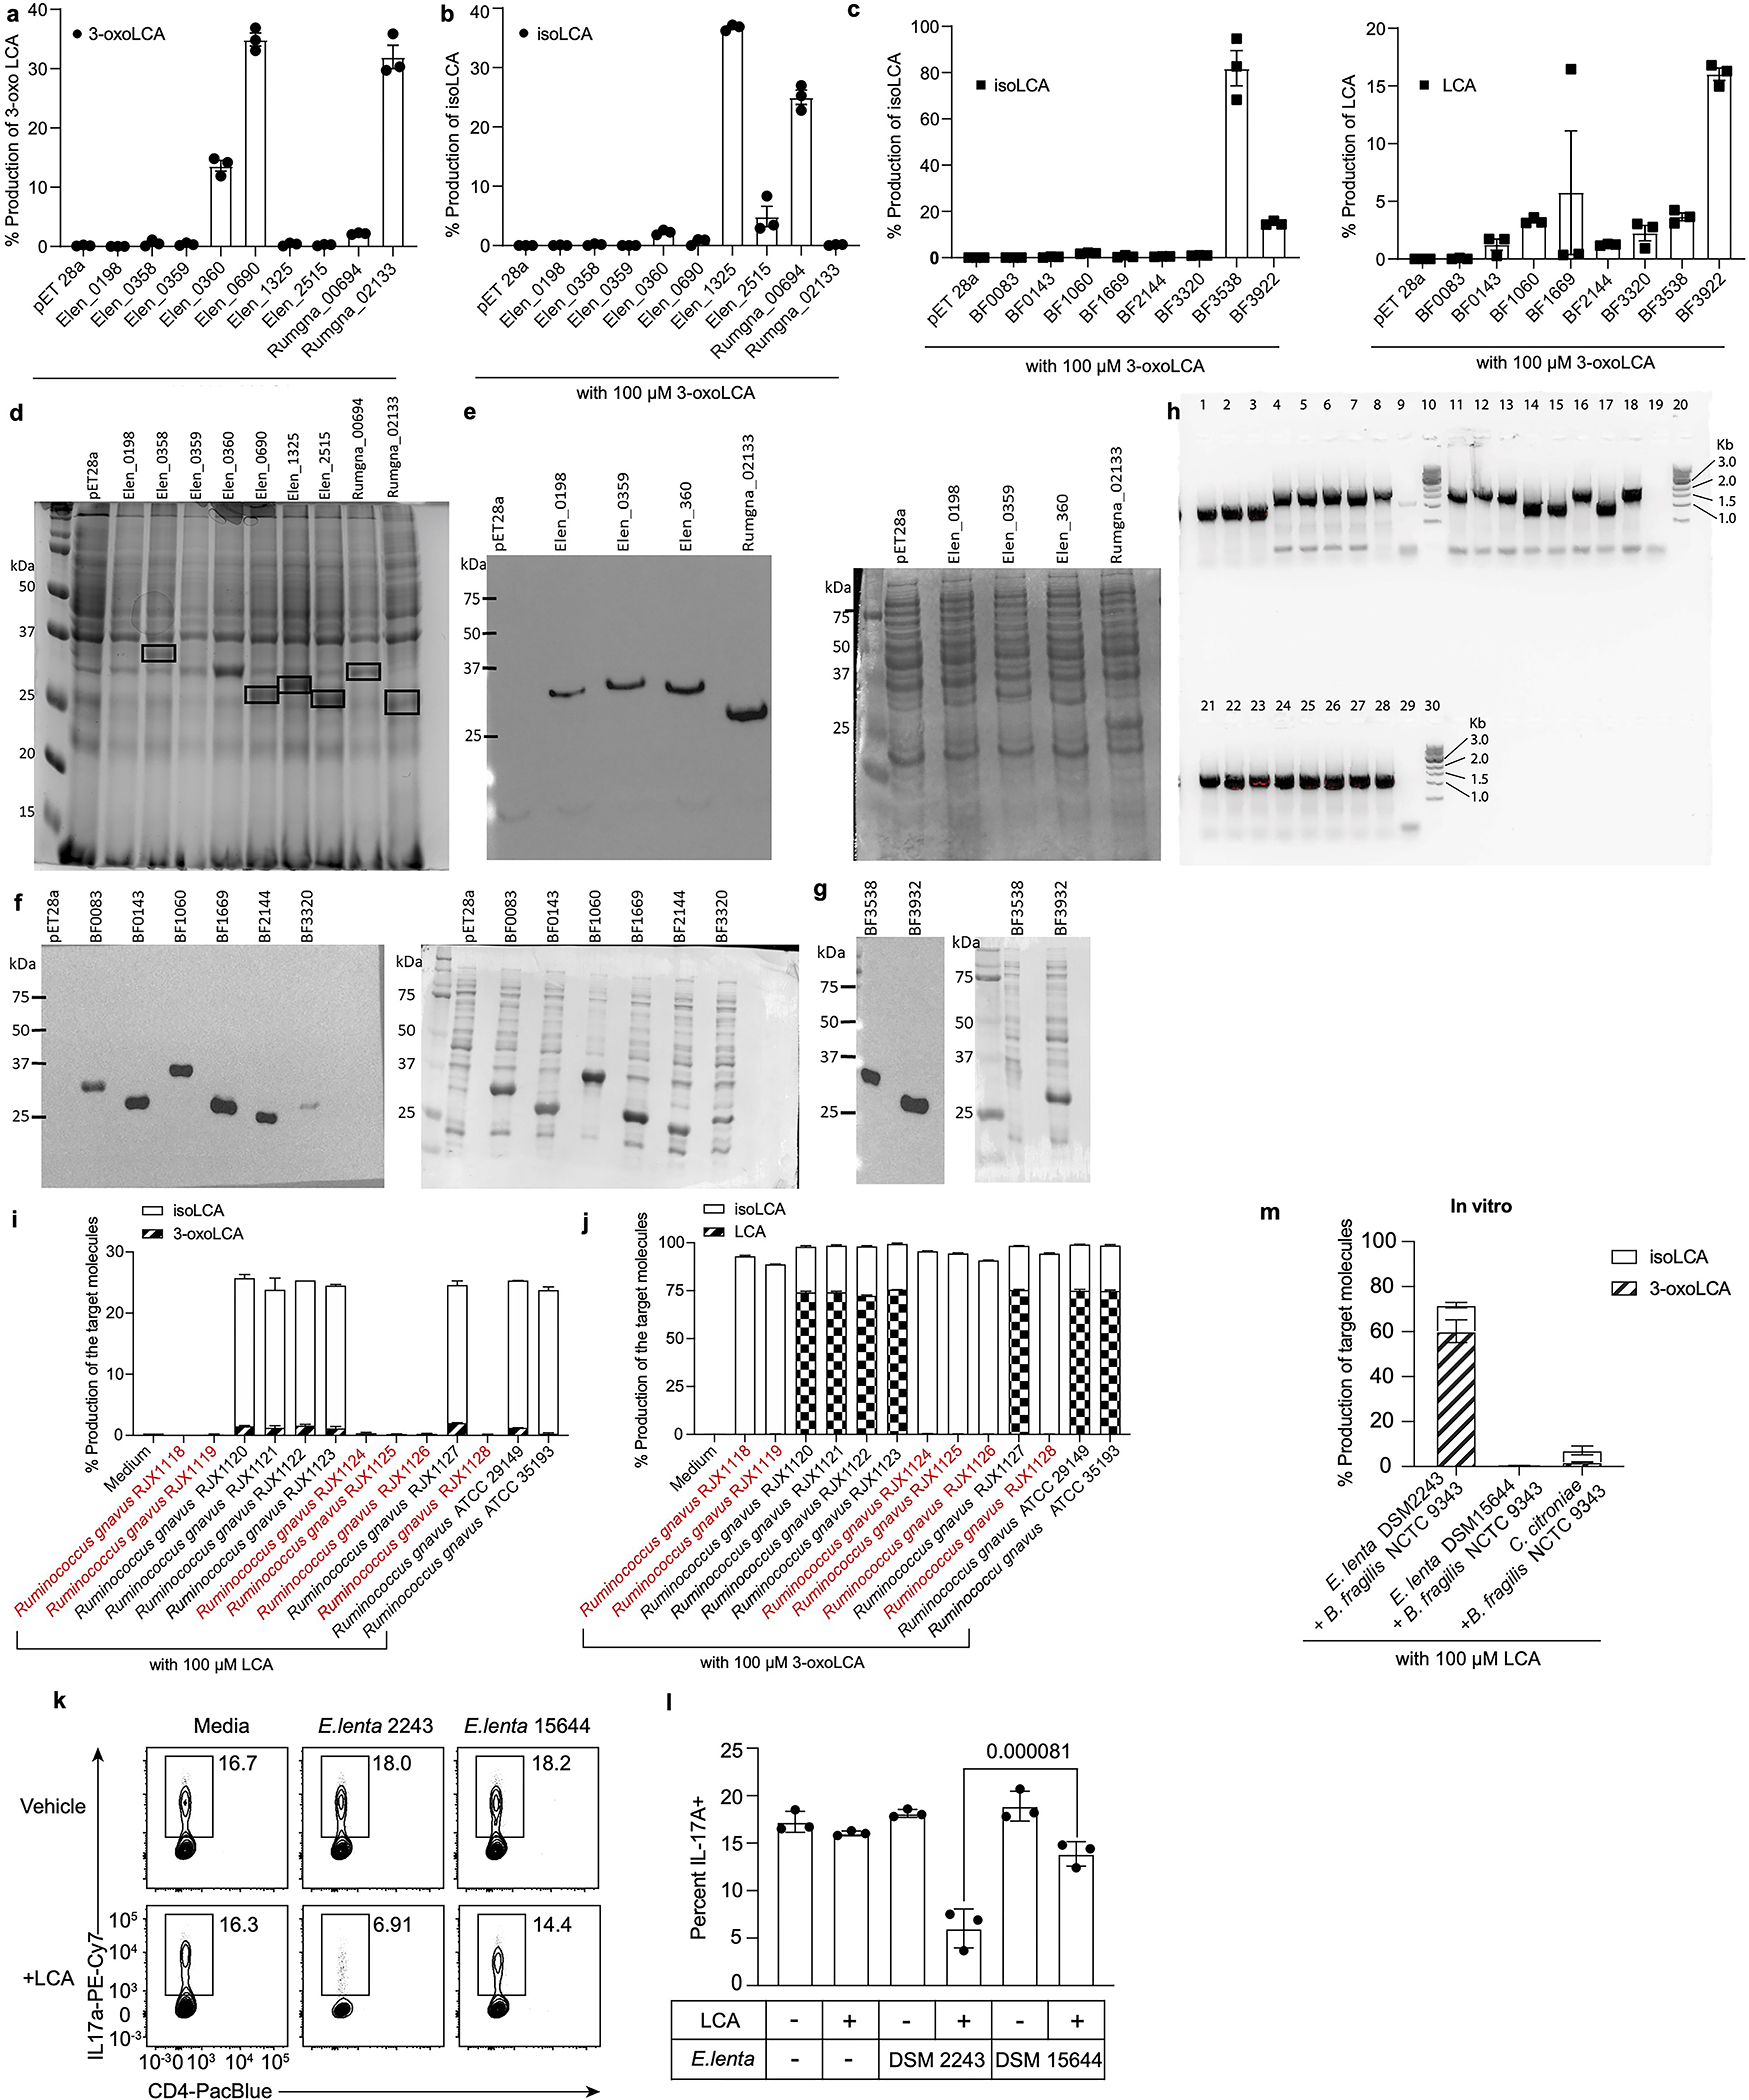
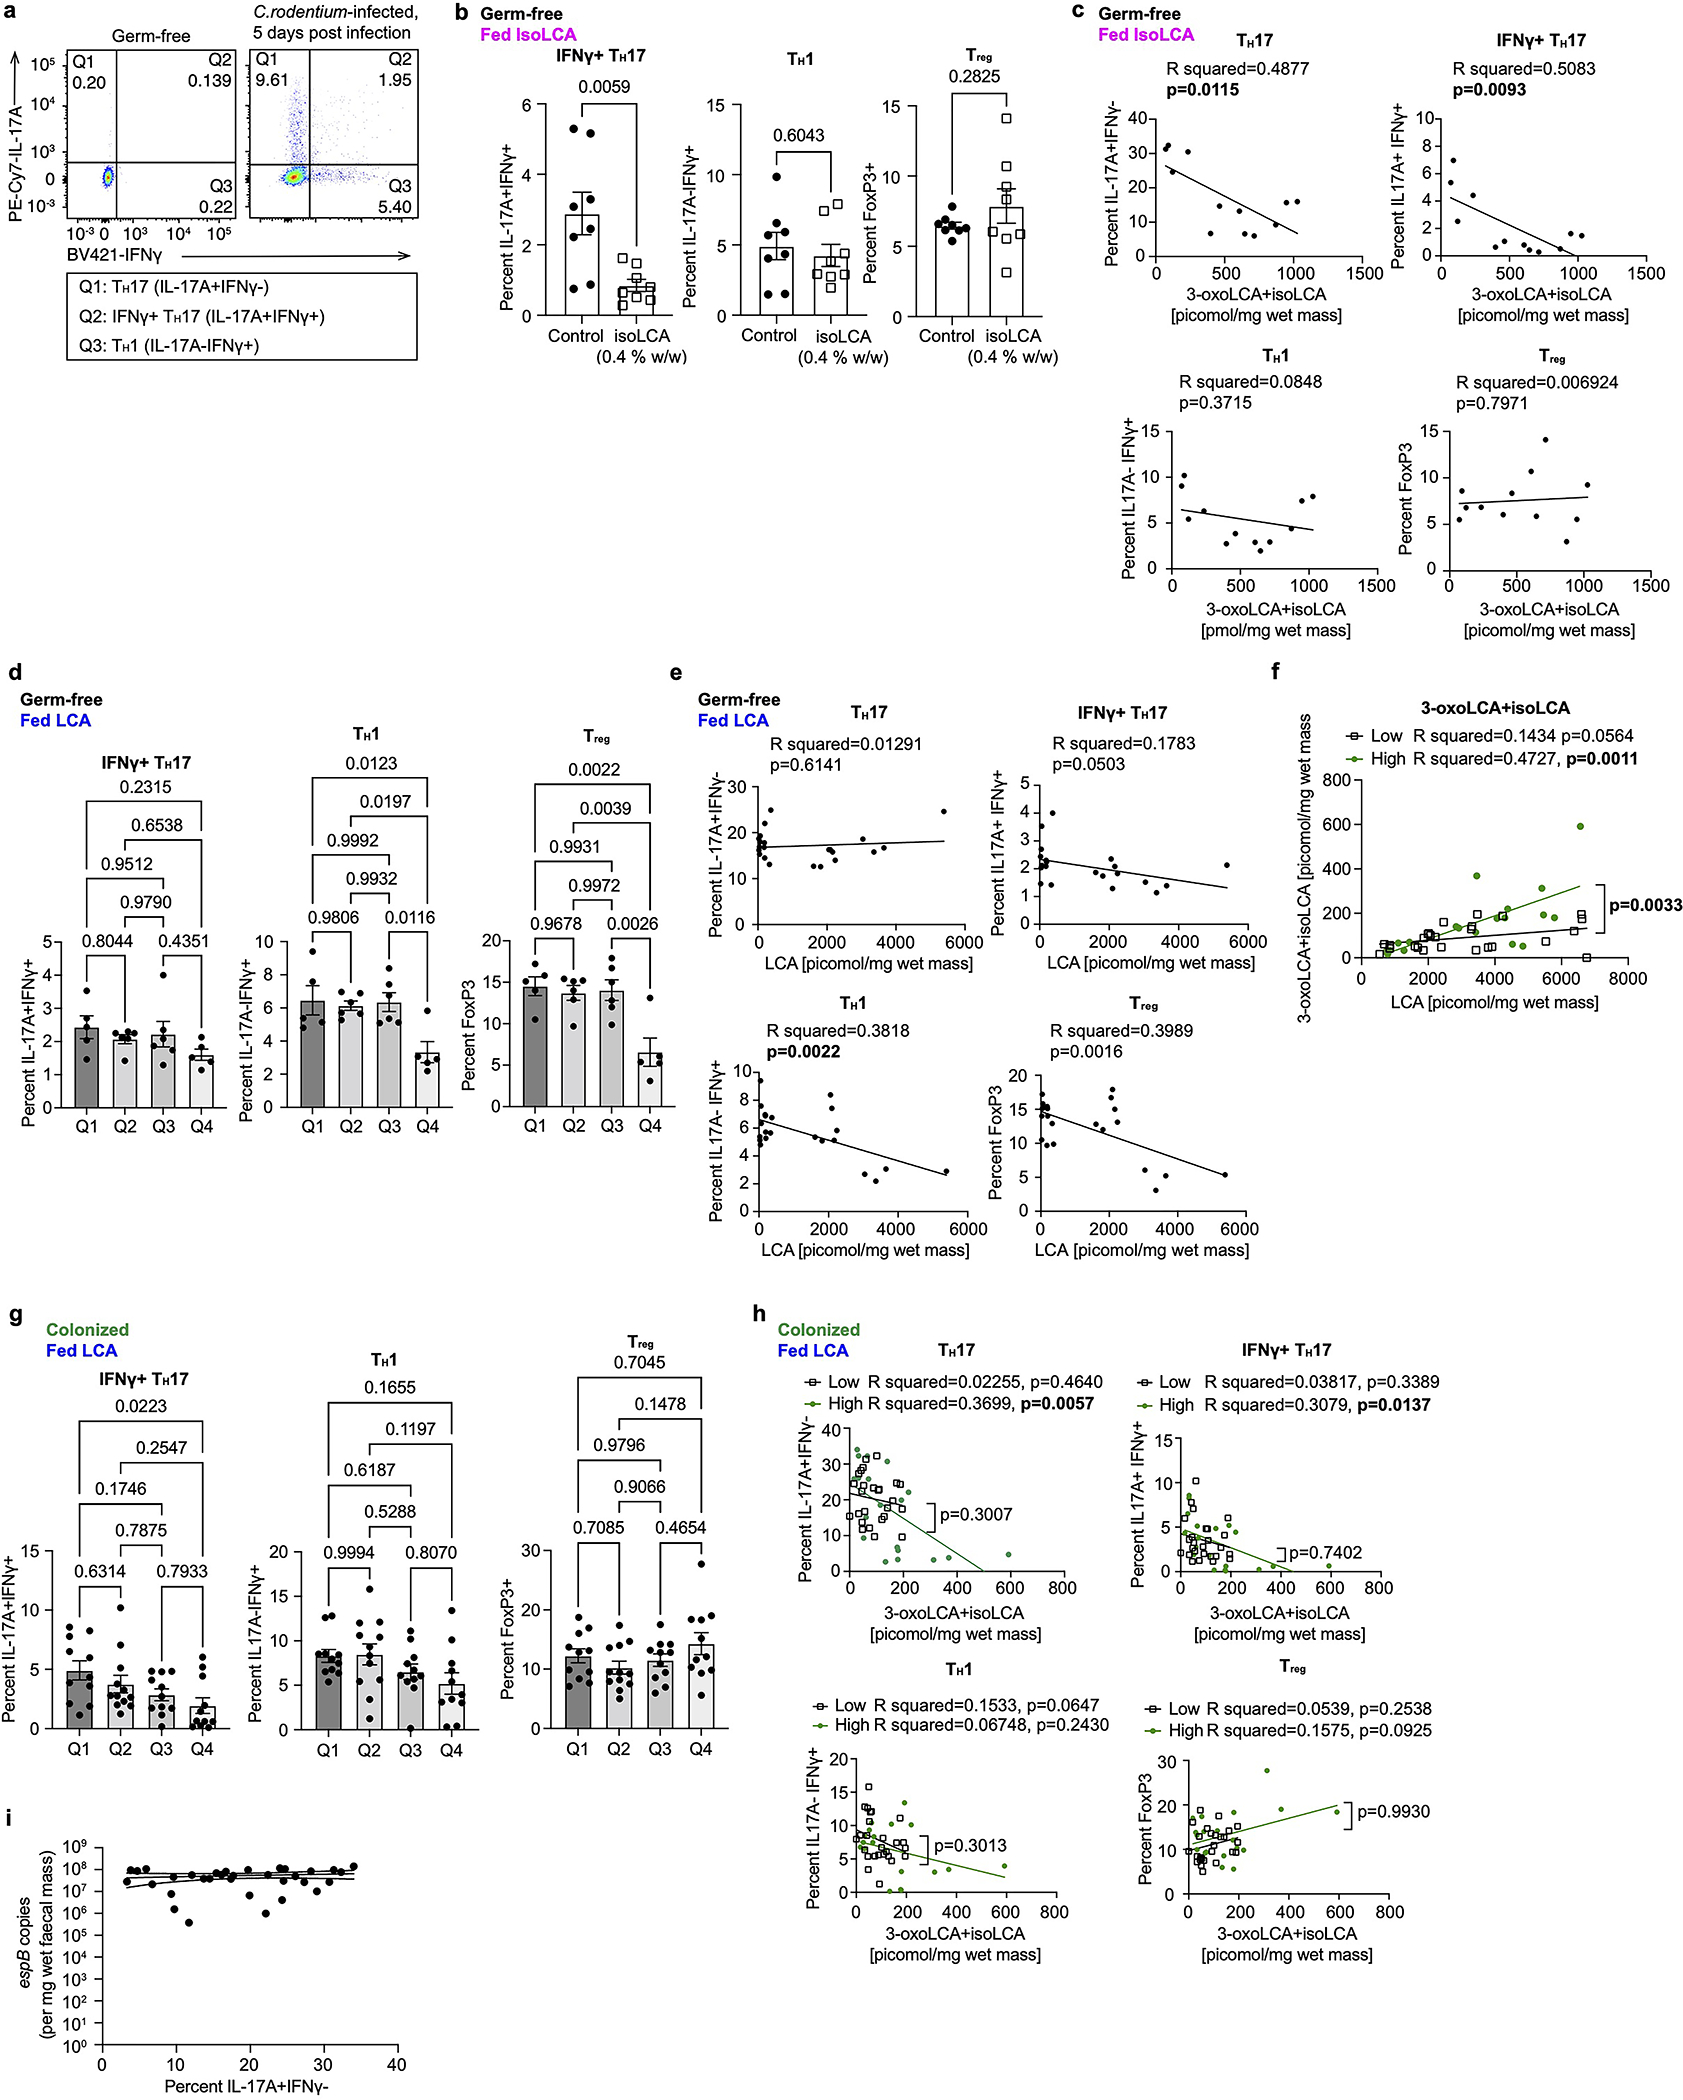
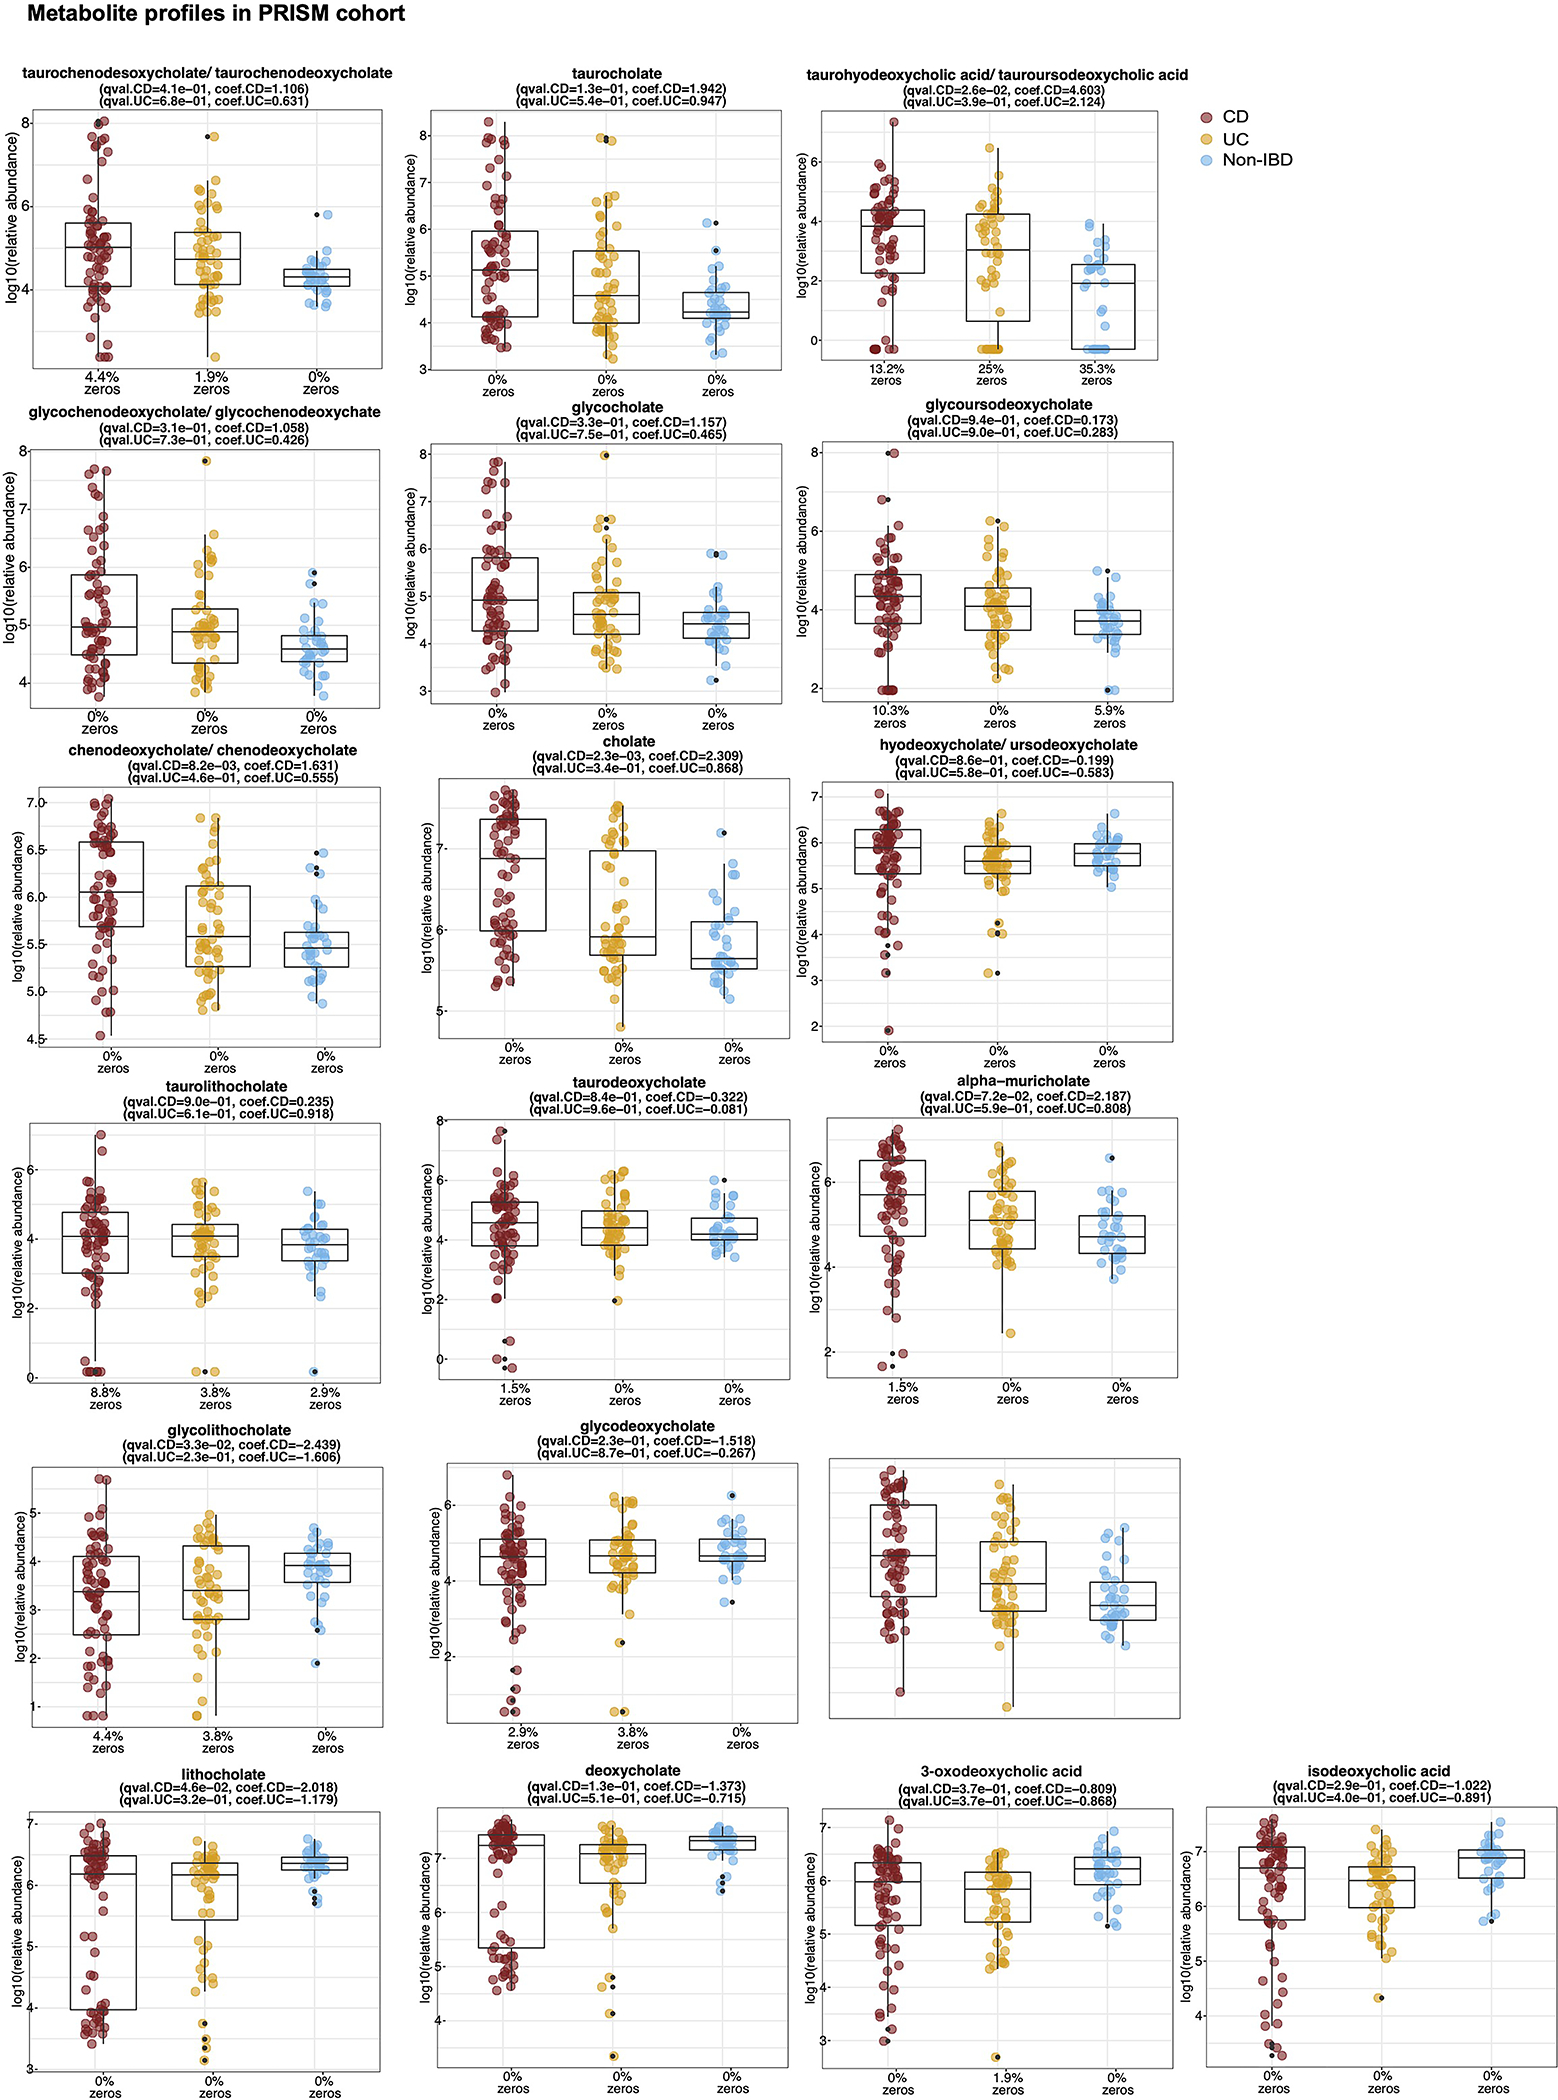
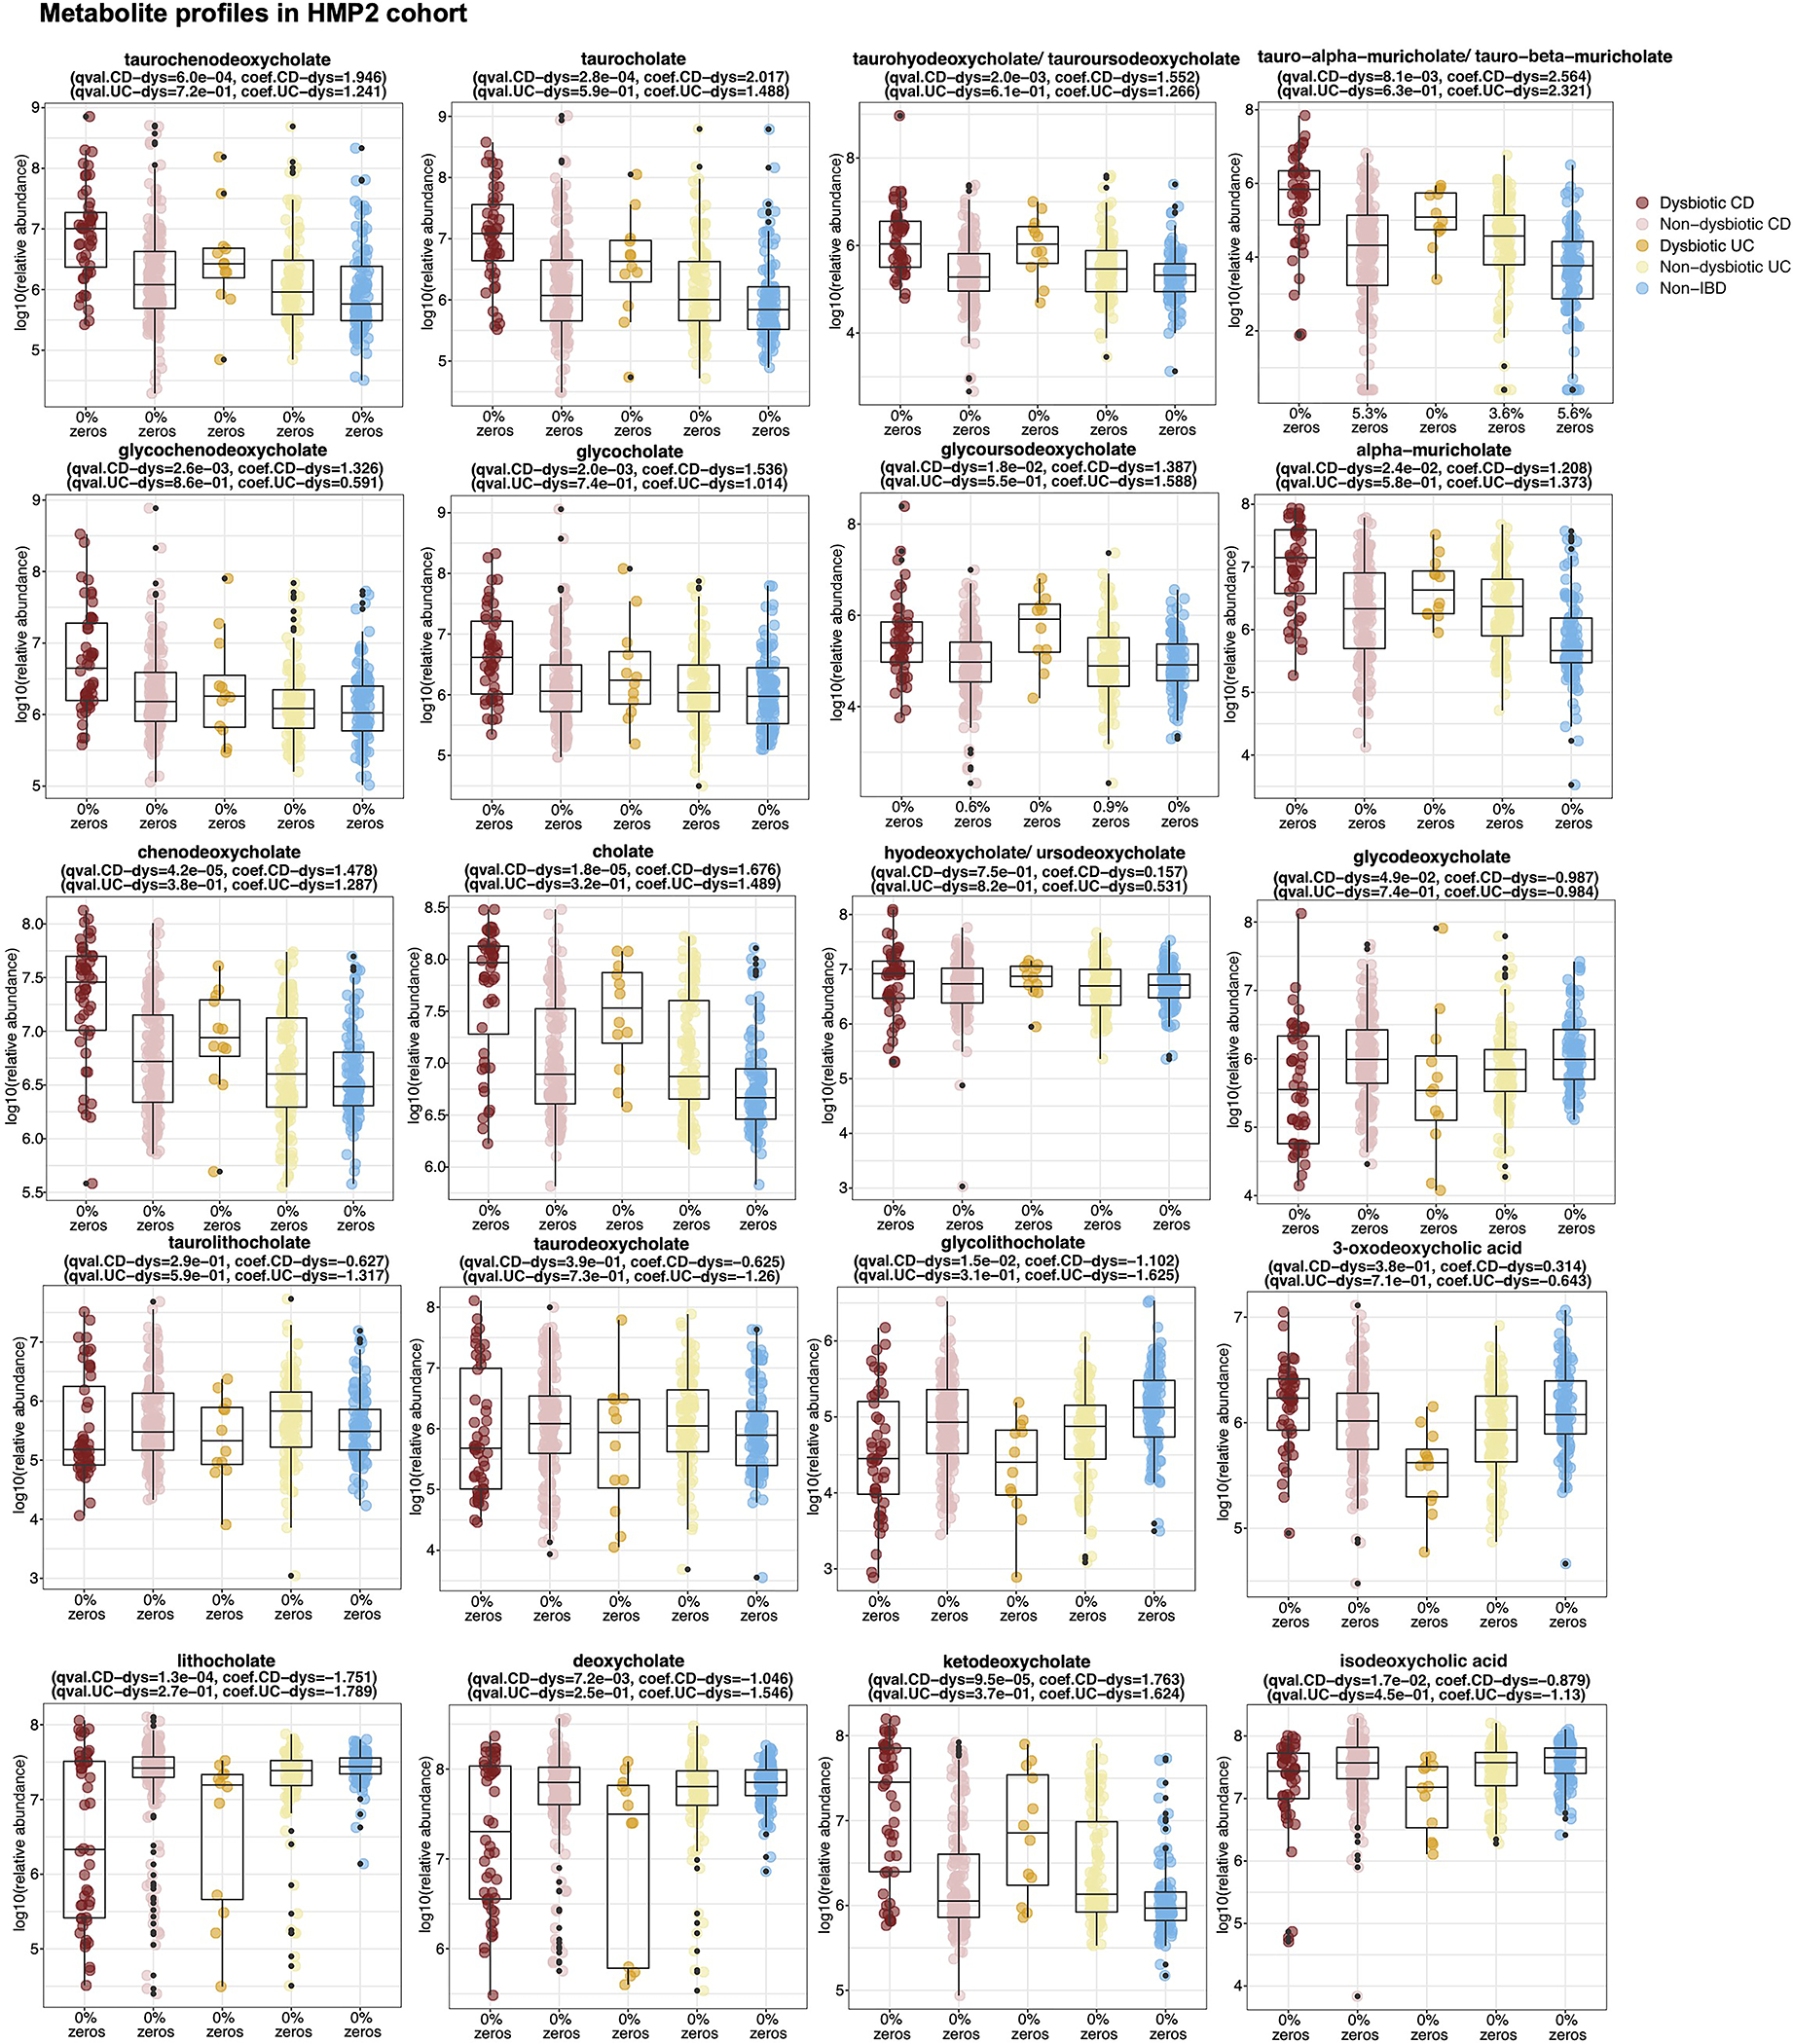
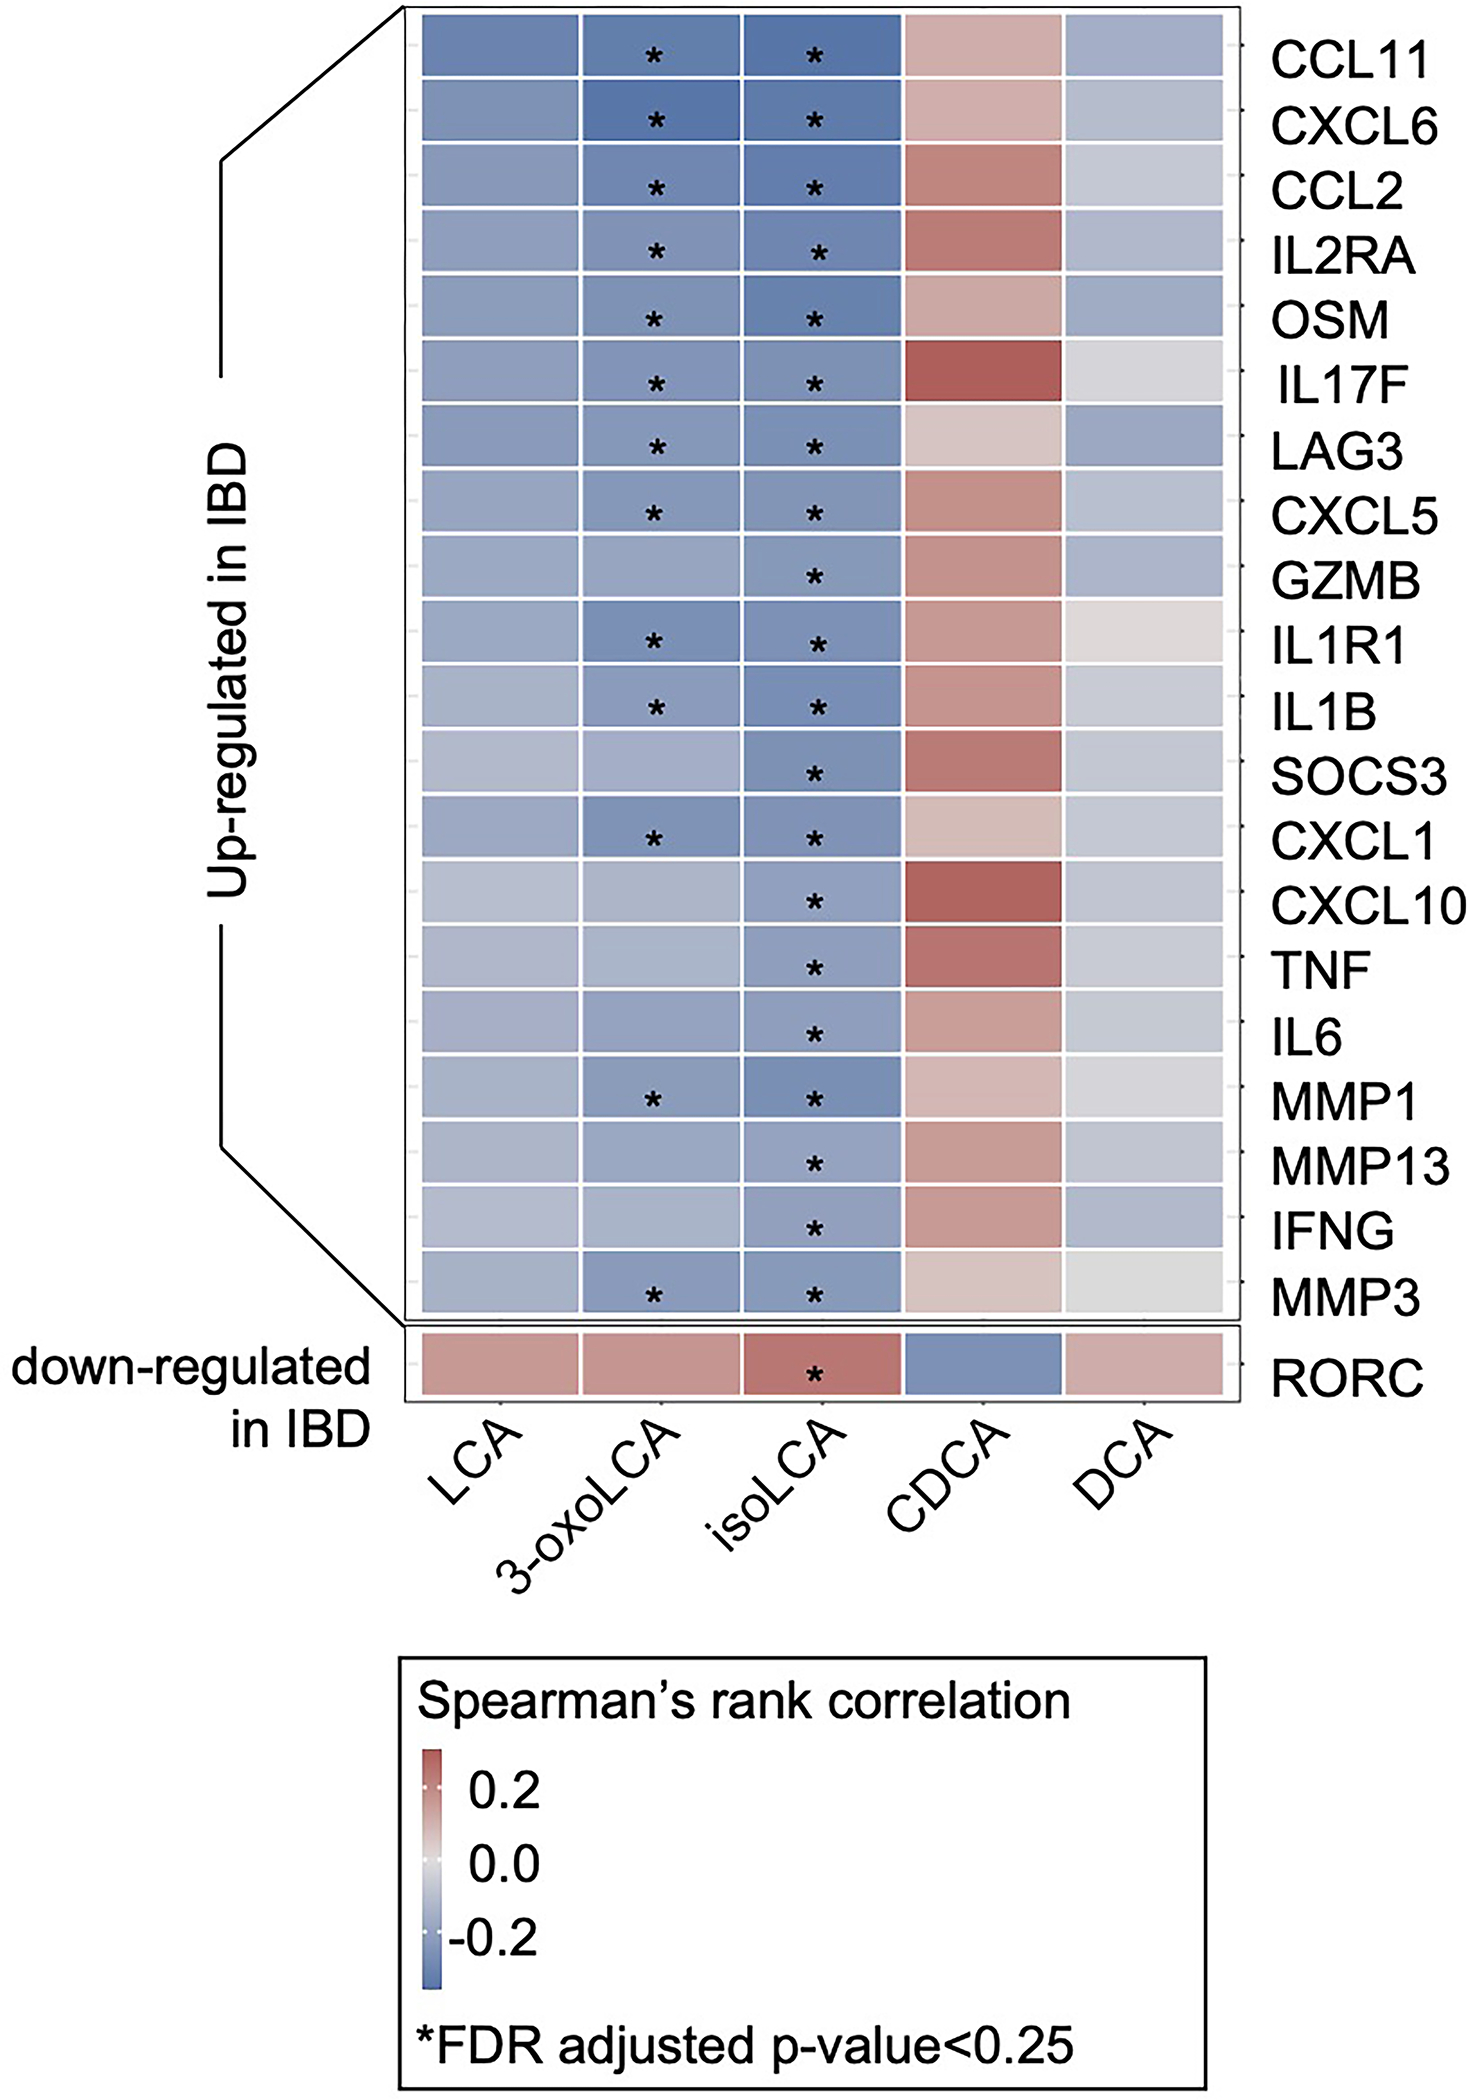
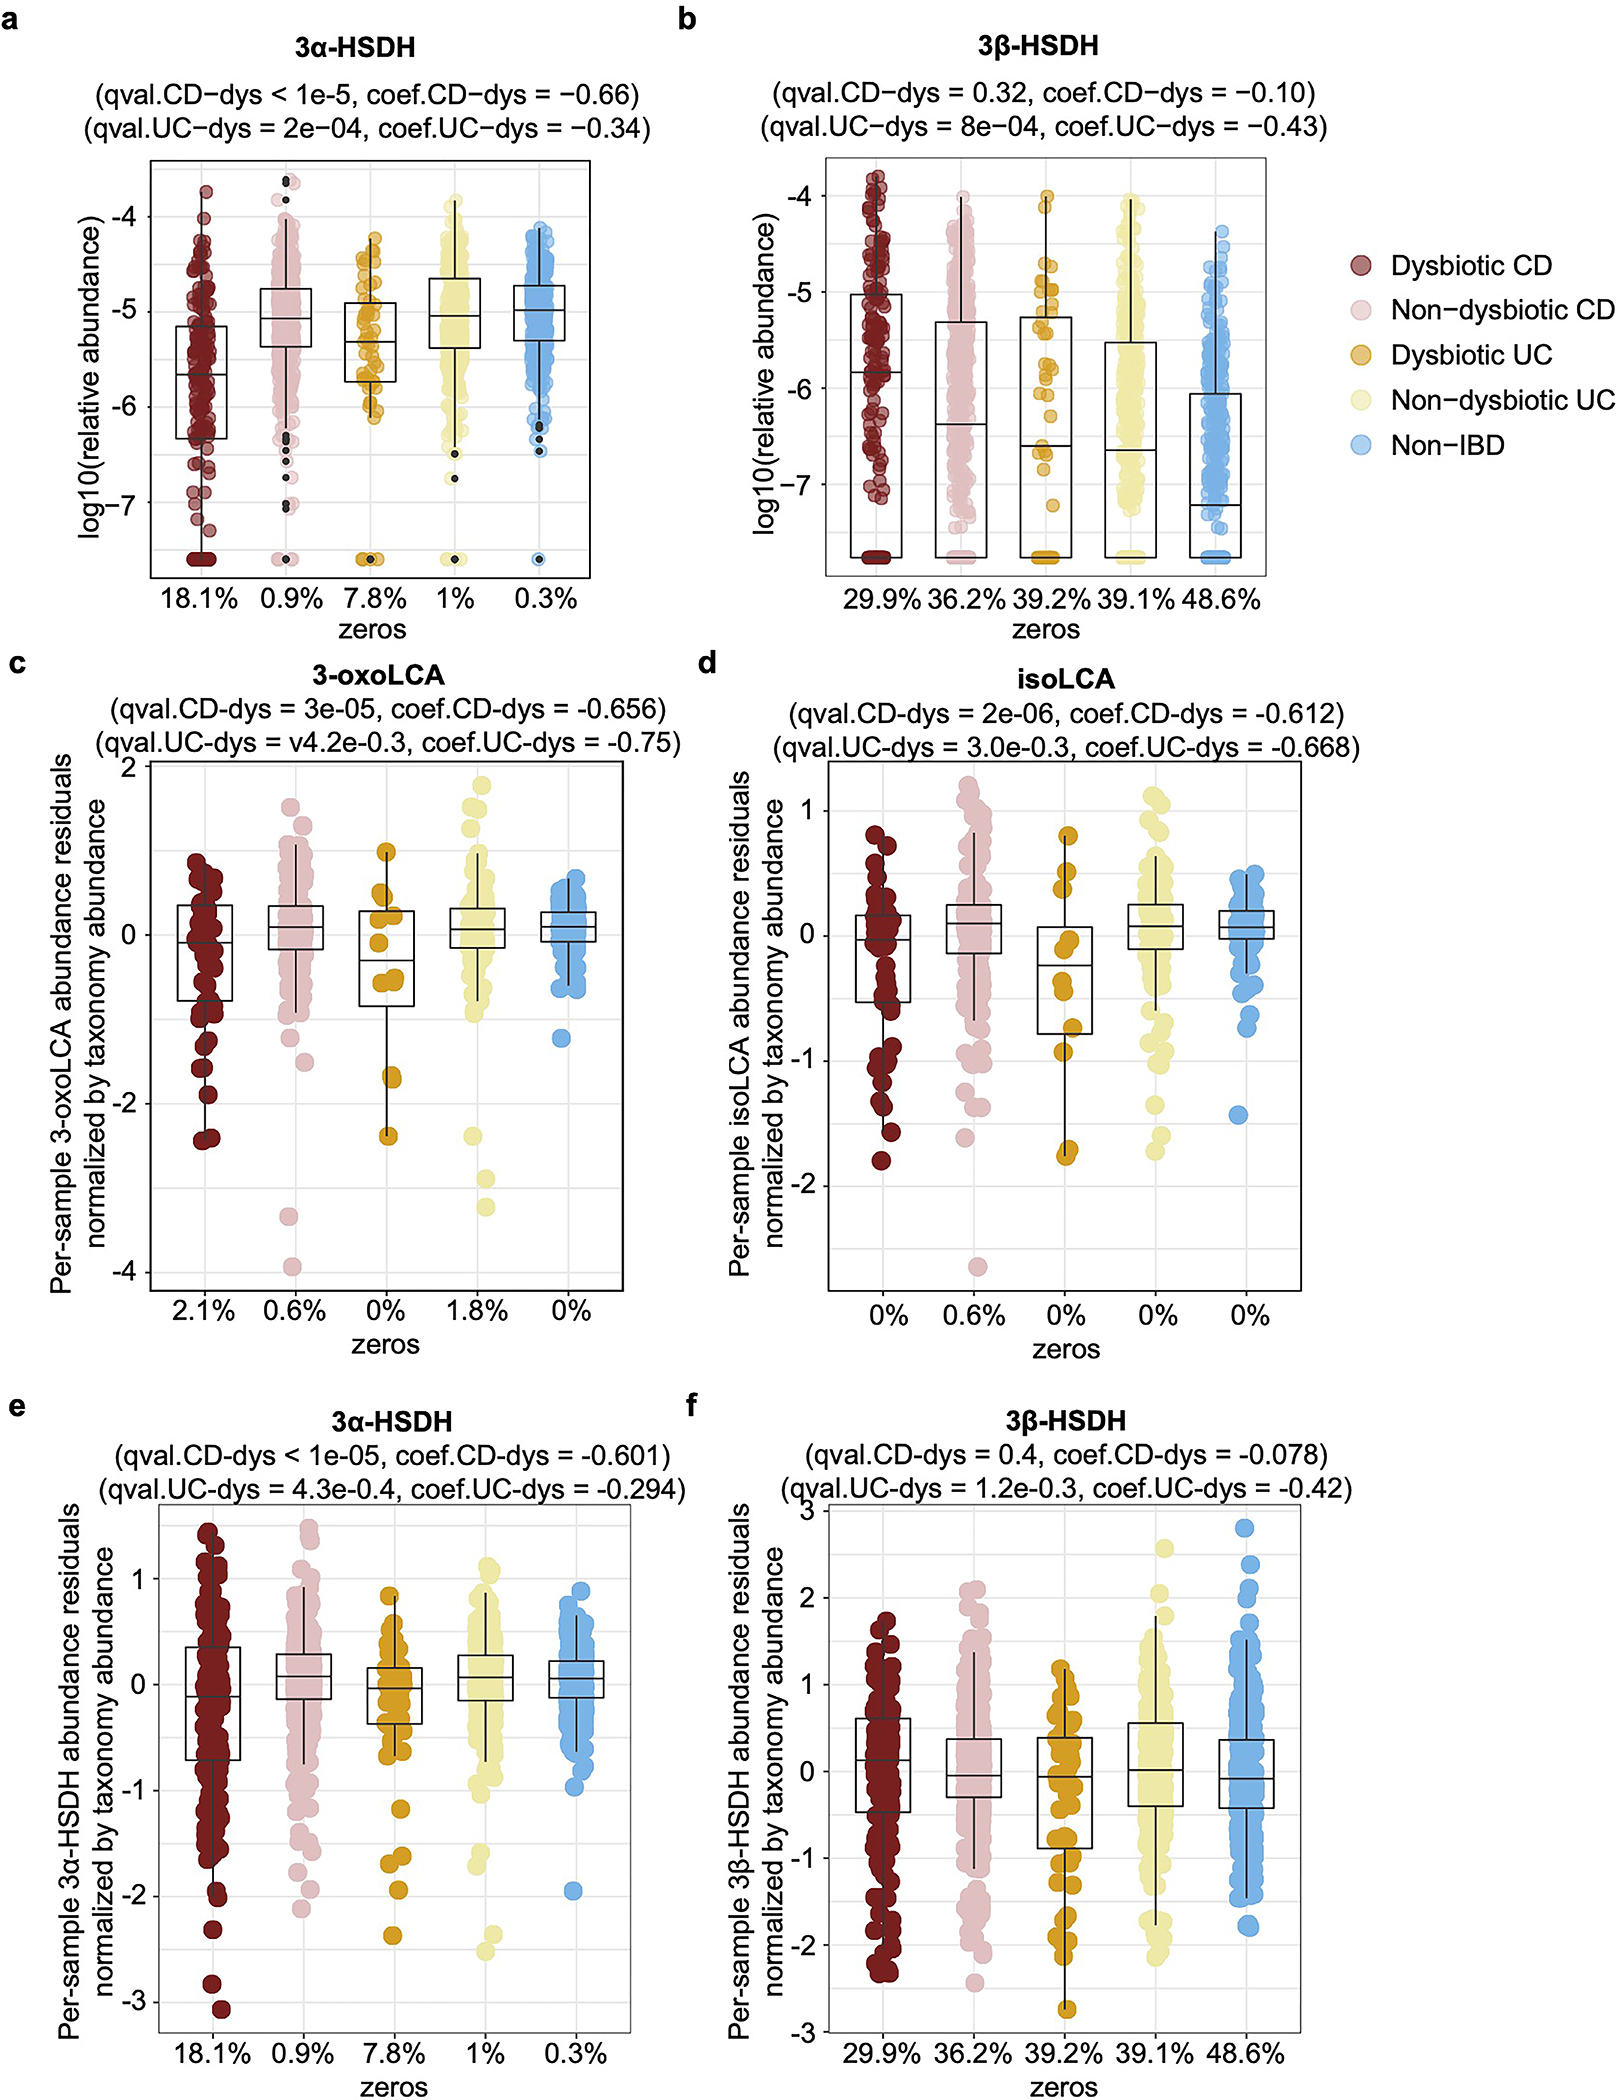
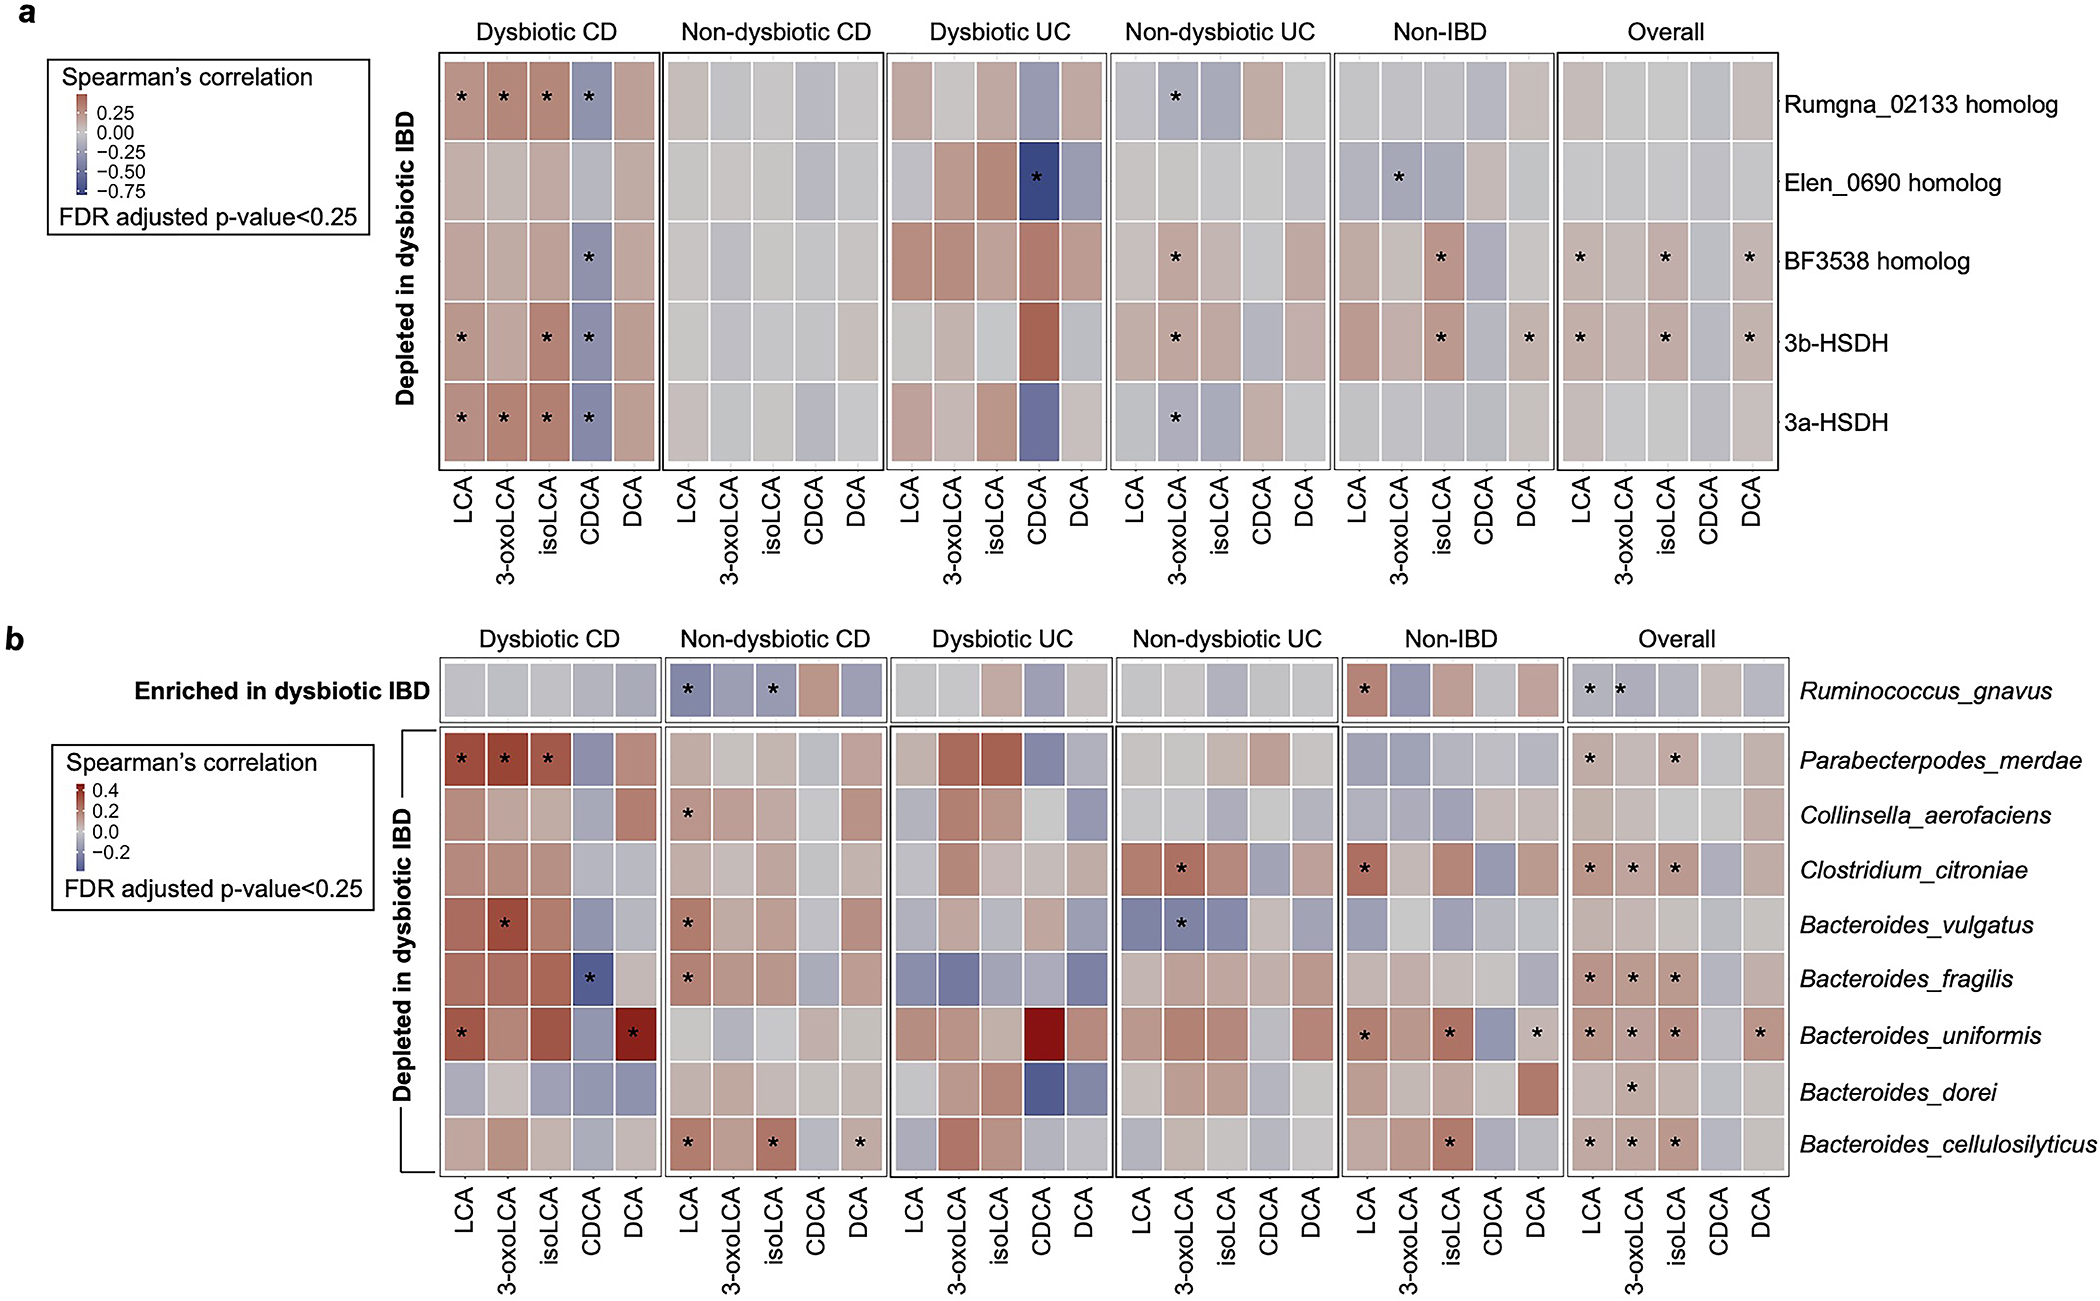
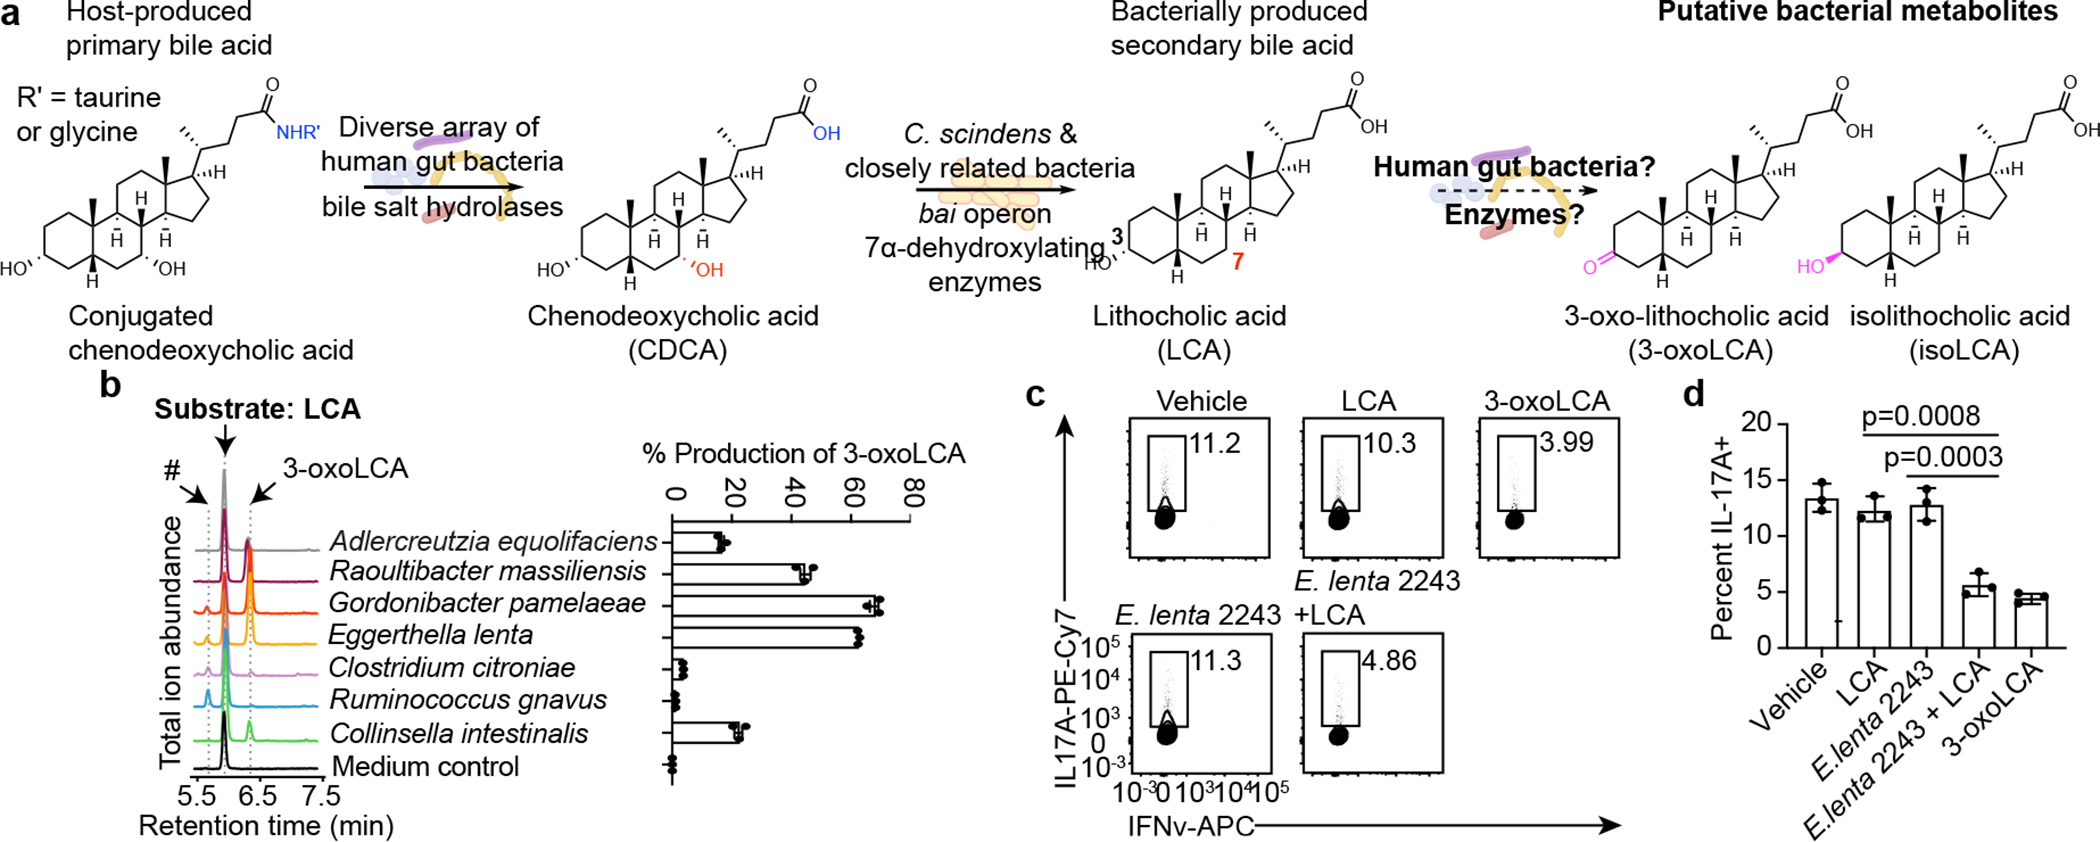
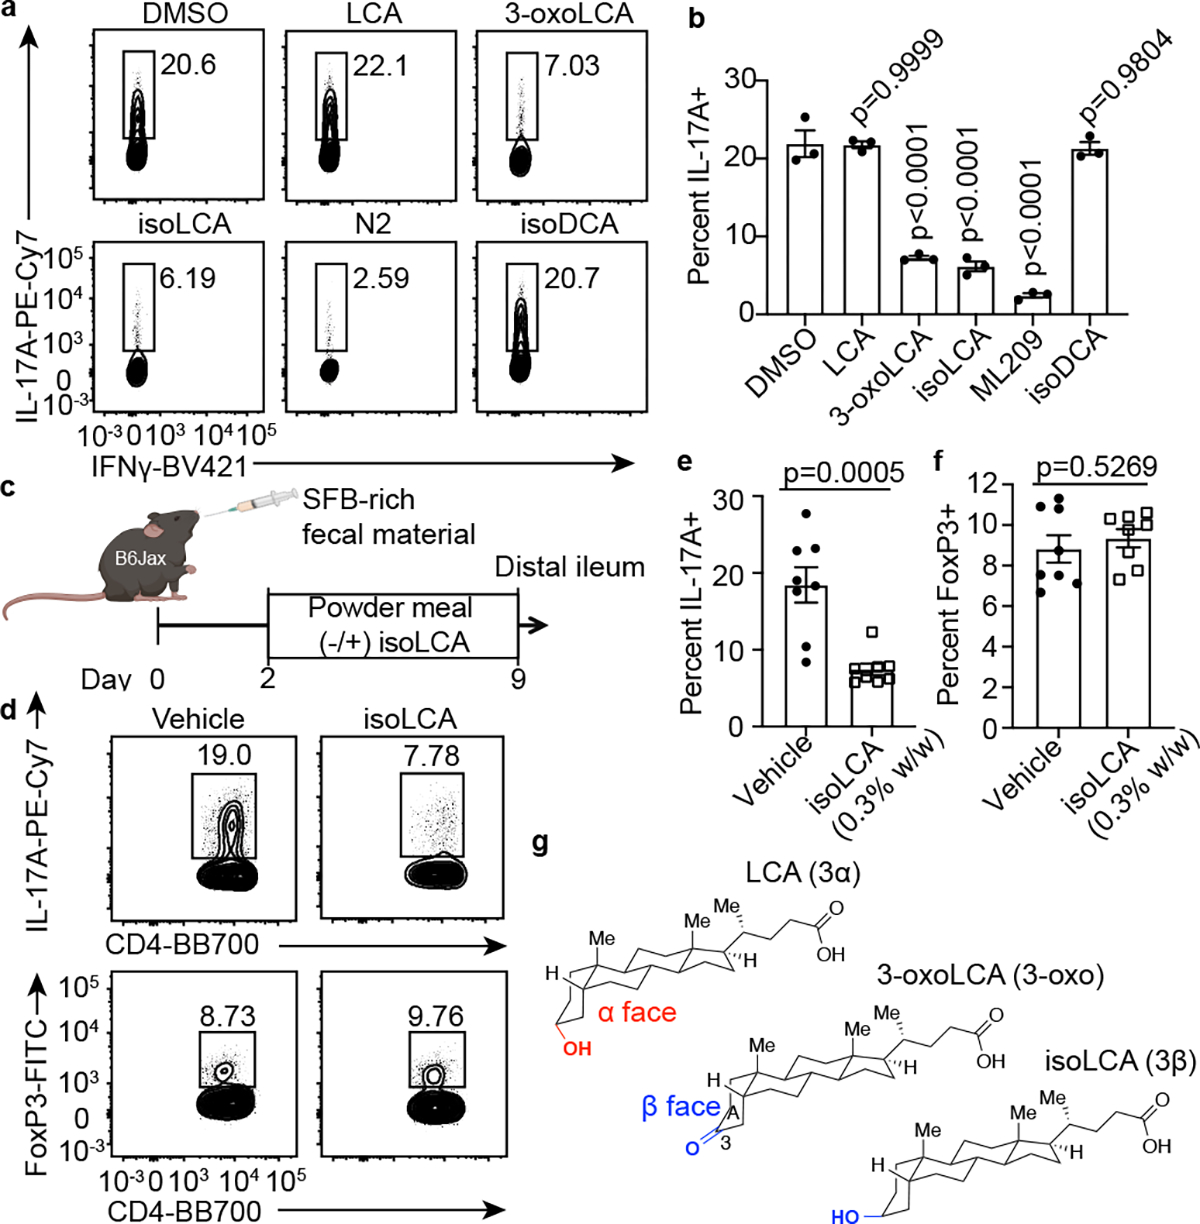
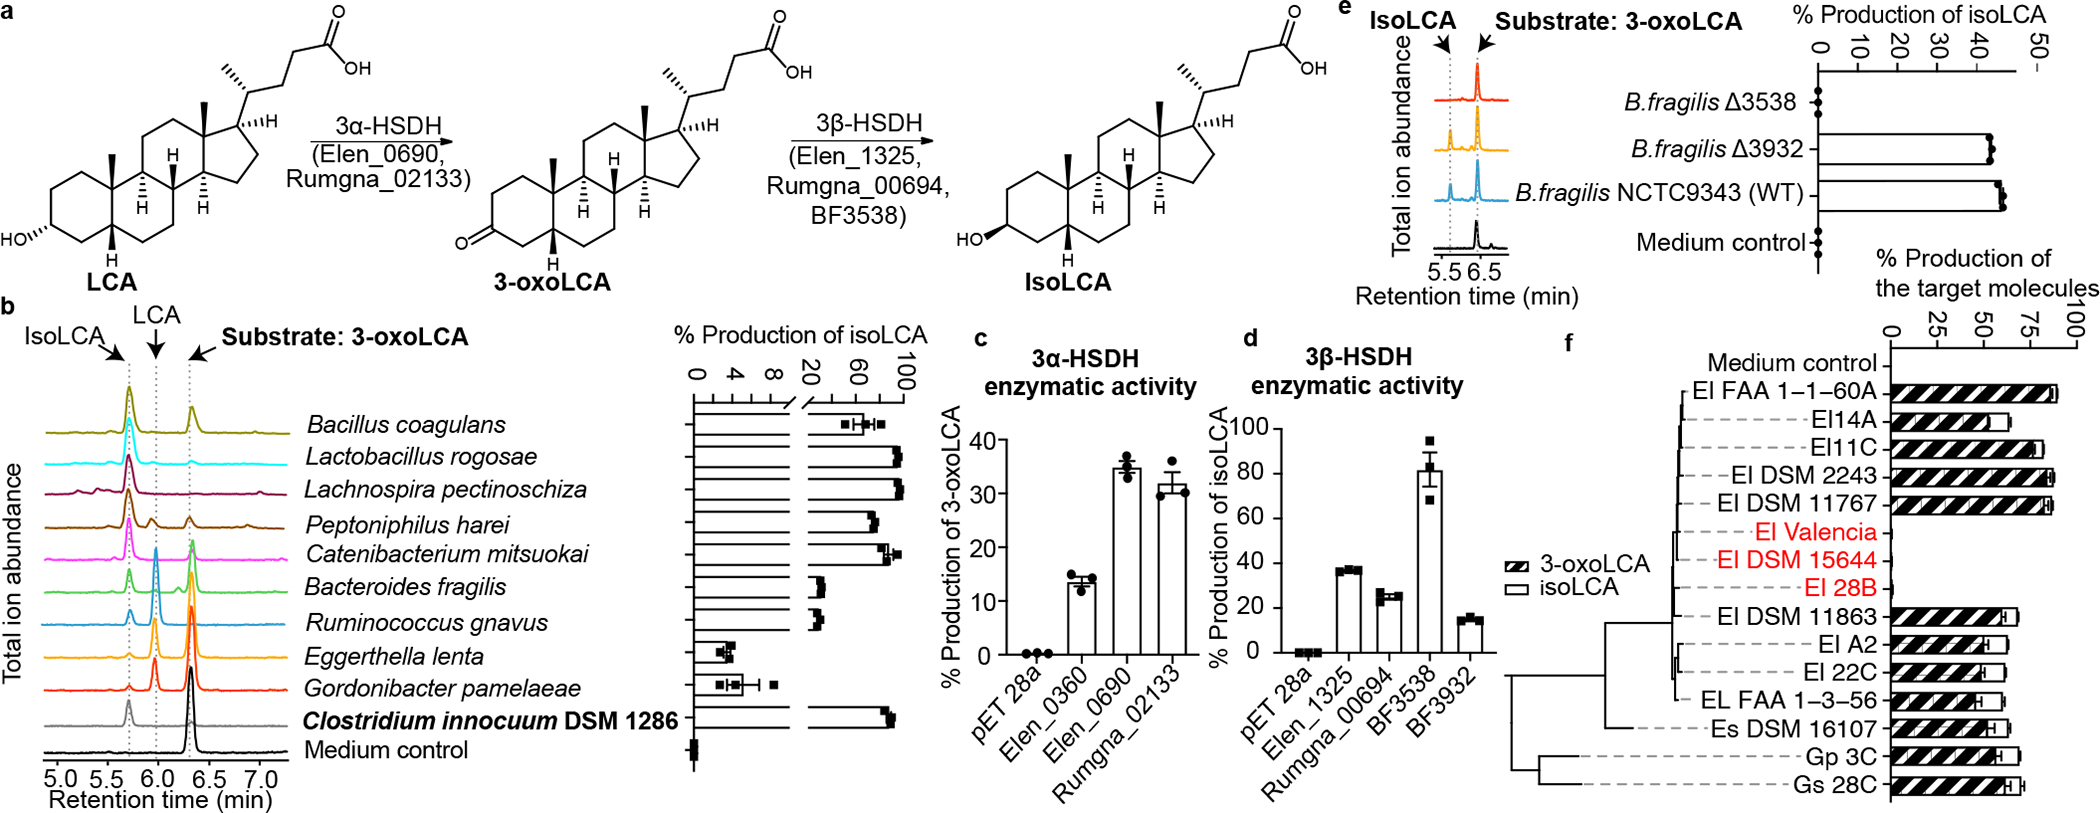
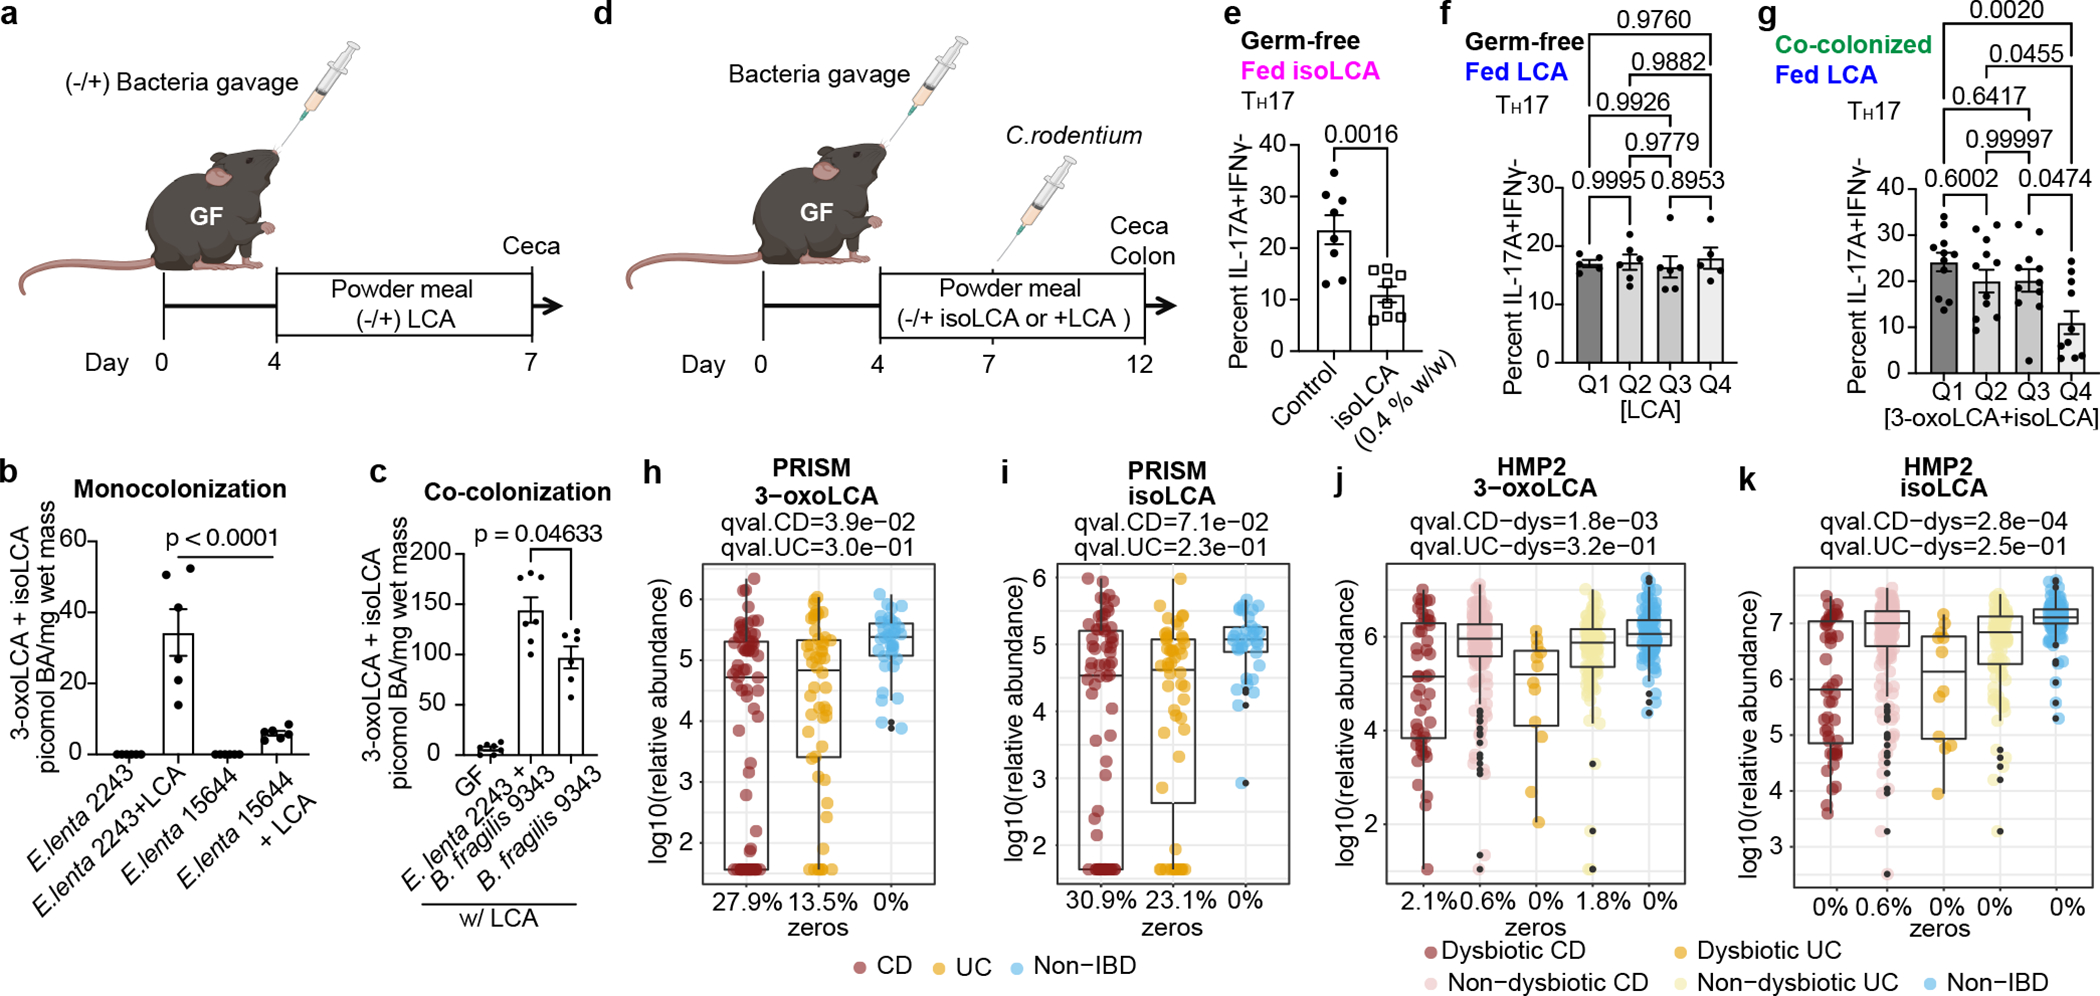
The microbiota modulates gut immune homeostasis. Bacteria influence the development and function of host immune cells, including T helper cells expressing interleukin-17A (TH17 cells). We previously reported that the bile acid metabolite 3-oxolithocholic acid (3-oxoLCA) inhibits TH17 cell differentiation1. Although it was suggested that gut-residing bacteria produce 3-oxoLCA, the identity of such bacteria was unknown, and it was unclear whether 3-oxoLCA and other immunomodulatory bile acids are associated with inflammatory pathologies in humans. Here we identify human gut bacteria and corresponding enzymes that convert the secondary bile acid lithocholic acid into 3-oxoLCA as well as the abundant gut metabolite isolithocholic acid (isoLCA). Similar to 3-oxoLCA, isoLCA suppressed TH17 cell differentiation by inhibiting retinoic acid receptor-related orphan nuclear receptor-γt, a key TH17-cell-promoting transcription factor. The levels of both 3-oxoLCA and isoLCA and the 3α-hydroxysteroid dehydrogenase genes that are required for their biosynthesis were significantly reduced in patients with inflammatory bowel disease. Moreover, the levels of these bile acids were inversely correlated with the expression of TH17-cell-associated genes. Overall, our data suggest that bacterially produced bile acids inhibit TH17 cell function, an activity that may be relevant to the pathophysiology of inflammatory disorders such as inflammatory bowel disease.


Conflict of interest statement

Competing interests

A.S.D. is a consultant for Takeda Pharmaceuticals and Axial Therapeutics. J.R.H. is a consultant for CJ Research Center, LLC and Interon Laboratories and on the scientific advisory board for ChunLab. P.J.T. is on the scientific advisory board for Kaleido, Pendulum, Seres, and SNIPRbiome. C.H. is on the scientific advisory boards of Seres Therapeutics, Empress Therapeutics, and ZOE Nutrition.

Figures

Extended Data Fig. 1 |
Extended Data Fig. 1 |. 3-oxoLCA biosynthetic pathway and microbial diversity from the human screen.
a, Quantification of 3-oxoLCA and isoLCA in stool samples from patients after fecal microbiota transplant (FMT) (n = 15). Stool samples from patient p#3 (3-oxoLCA: 44 picomol/mg, isoLCA: 136 picomol/mg) and patient p#27 (3-oxoLCA: 83 picomol/mg, isoLCA: 213 picomol/mg) were used to screen for 3-oxoLCA producers. b, Schematic of the screen for bacterial producers of the LCA metabolite 3-oxoLCA from human stool samples. In total, 990 bacterial colonies were isolated, restreaked, and archived from two human stool samples. ① Replicate plates (assay plates) were then used for the screen. ② Individual isolates were incubated anaerobically with LCA (100 μM) (see Fig. 1b) or 3-oxoLCA (100 μM) (see Fig. 2b) for 48 hours. Cultures were harvested, acidified, extracted, and BA metabolites were quantified by UPLC-MS. ③ Positive hits containing 3-oxoLCA were re-selected from the archived stock plates, and recovered on new plates. ④ Activity was verified and each producer species was identified by full-length 16S rRNA sequencing. Finally, bacterial enzymes responsible for the LCA metabolite production were identified (see Fig. 3), and ⑤ corresponding genes were utilized as query sequences in BLASTP searches for novel putative bacterial producers and enzymes. c, Sample preparation workflow for the determination of cultured bacteria from the human stool sample screen. For each patient, individual isolates were recovered and cultured for 48 hours. These isolates were then pooled together, and genomic DNA was extracted from the pooled pellet. Illumina® MiSeq sequencing on the V3 and V4 hypervariable regions of 16S rRNA was then performed. d, Genus and phylum-level microbial community composition for each human stool sample. e, 3-oxoLCA and/or isoLCA production was verified in the type strains of a subset of 3-oxoLCA-producing human isolates (n = 3 biological replicates per group, data are mean ± SEM).
Extended Data Fig. 2 |
Extended Data Fig. 2 |. Supernatants from LCA metabolite-producing bacteria do not affect Treg cell differentiation in vitro.
a, b, Representative FACS plots (a) and population frequencies (b) of CD4+ T cells, cultured under Treg polarization conditions in vitro are presented. Bacterial culture supernatants were added 18 hours after TCR activation (n = 3 biologically independent samples per group. Data are mean ± SEM, one-way ANOVA followed by Tukey’s multiple comparison test). c, A pure standard of isoLCA was spiked into a subset of bacterial culture extracts containing the new peak (#). Co-elution and an identical m/z match confirmed that the new compound (#) in Fig. 1b was isoLCA. Total ion chromatograms (TICs) are shown. d, isoLCA production from 3-oxoLCA (100 μM) was verified in the type strains of a subset of isoLCA-producing human isolates (n = 3 biological replicates per group, data are mean ± SEM).
Extended Data Fig. 3 |
Extended Data Fig. 3 |. IsoLCA neither affects T cell viability nor inhibits Treg and TH1 cell differentiation in vitro.
a-c, IsoLCA does not reduce T cell viability or proliferation. Percentages of TH17 cells (a), viable cells (b) and total cell numbers (c) at the end of T cell culture under TH17 polarization conditions in the presence of LCA, 3-oxoLCA, or isoLCA at 40, 20, 10, 5, 2.5, 1.25 and 0.625 μM (n = 3 biologically independent samples, data are mean ± SEM, one-way ANOVA with Dunnett’s multiple comparisons). d-g, IsoLCA does not affect Treg or TH1 cell differentiation in vitro. Flow cytometry and quantification of intracellular staining for FoxP3 (d, e) or IFN-γ (f, g). Mouse naive CD4 T cells from wild-type B6Jax mice were cultured under TH1- or Treg- polarizing conditions and DMSO or isoLCA was added 18 hours after TCR activation (n = 3 biologically independent samples per condition, data are mean ± SEM, two-tailed unpaired t-test). h, SFB colonization measured by qPCR analysis in Fig.2 c–f, calculated as SFB 16s rRNA copy number (n = 8 mice per group, pooled from two experiments, data are mean ± SEM, two-tailed unpaired t-test). i–k, Experimental scheme of Th17 induction by SFB (i), representative FACS plots (j) and population frequencies of TH17 cells (k), isolated from the ileal lamina propria of control or isoLCA-treated mice (n = 8 mice for control, n=6 mice for isoLCA-treated groups, pooled from two experiments). B6 Tac mice were fed a control or a isoLCA (0.3% w/w)-containing diet for 7 days (data are mean ± SEM, two-tailed unpaired t-test). l–o, Experimental scheme of anti-CD3 experiment (l), representative FACS plots (m) and population frequencies of TH17 (n) and Treg cells (o) of the ileal lamina propria of control or isoLCA-treated mice (n = 15 mice for control, 13 mice for isoLCA-treated groups, pooled from three experiments). B6 Tac mice were intraperitoneally injected with anti-CD3 and fed a control diet or isoLCA-containing (0.3% w/w) diet during the experiments (data are mean ± SEM, two-tailed unpaired t-test). p, RORγt luciferase reporter assay in HEK293 cells, treated with a synthetic RORγ inhibitor ML209 (1 μM), isoLCA (20 μM, 10 μM, 5 μM), isoDCA (20 μM, 10 μM, 5 μM) or DMSO. The fold ratio of firefly luciferase (FLuc) to Renilla luciferase (RLuc) activity is presented on the y-axis. DMSO-treated group set to 1 (n = 7 independent transfections per group, pooled from two experiments. Data are mean ± SEM, one-way ANOVA with Dunnett’s multiple comparison test, vehicle set as control). q, r, Differential scanning fluorimetry (DSF) analyses indicated robust binding of isoLCA (q), but not of isoDCA (s) to the RORγt ligand-binding domain (LBD). s-v, Surface plasmon resonance (SPR) indicated robust binding of isoLCA to the RORγt LBD. Sensorgrams for affinity (s) and kinetics (t) of isoLCA and affinity (u) and kinetics (v) of isoDCA with the RORγt LBD. w, Transcriptional profiling of wild-type (WT) T cells and RORγ deficient (KO) T cells, cultured under TH17 cell polarization conditions. DMSO or BAs were added to cells 18 hours after TCR activation. Cells were then harvested, and RNA-sequencing was performed. Heat map represents 46 genes that are regulated by either 3-oxoLCA or isoLCA as well as RORγ (n = 3 mice per condition, the Wald test with Benjamini-Hochberg correction was used to determine FDR-adjusted p value <0.05, genes that were differentially expressed by both isoLCA and 3-oxoLCA are shown in magenta). x, Gene ontology enrichment analysis was performed on the 46 genes that were differentially regulated by either 3-oxoLCA or isoLCA and RORγt ND revealed that these BA treatments resulted in changes in the expression of genes involved in several biological processes, including IL-17-mediated signaling and cytokine production pathways.
Extended Data Fig. 4 |
Extended Data Fig. 4 |. Screen of the candidate HSDH enzymes from gut bacteria.
a-c, Results of lysis assay in which the E. lenta DSM2243 (Elen), R. gnavus ATCC29149 (Rumgna), and B. fragilis NCTC9343 (BF) candidate HSDH enzymes were expressed in E. coli BL21 pLysS and their ability to convert LCA to 3-oxoLCA (a, 3α-HSDH activity), 3-oxoLCA to isoLCA (b, and c, left, 3β-HSDH activity), and 3-oxoLCA back to LCA (d, right, reverse 3α-HSDH activity) was analyzed by UPLC-MS. Data are reported as percent conversion to product (n = 3 biological replicates per group, data are mean ± SEM). d-g, SDS-PAGE analysis of candidate gene expression from E. lenta DSM 2243 and R. gnavus ATCC 29149 (Elen_0358, Elen_690, Elen_1325, Elen_2515, Rumgna_00694, and Rumgna_02133) (n = 3 replicates) (d). Western blot of the expression of Elen_0198, Elen_0359, Elen_0360, and Rumgna_02133. Anti-His tag labeling (left). Amido black total protein stain of membrane (right) (n = 2 replicates) (e). Western blot of the expression of BF0083, BF0143, BF1060, BF1669, BF2144, and BF3320. Anti-His tag labeling (left). Amido black total protein stain of membrane (right) (n = 2 replicates) (f). Western blot of the expression of Bf3538 and Bf3932. Anti-His tag labeling (left). Amido black total protein stain of membrane (right) (n = 2 replicates) (g). For source gel data for d-g, see Fig. S1. h, DNA gel for the B. fragilis genetic knockout mutants’ diagnostic PCR. IntF-UHF-BF3538/ Int-R-DHF-BF3538 PCR primers: lane 1–3 are B. fragilis Δ3538 mutant colonies #1-#3; lane 4, 5, 7 are B. fragilis Δ3932 mutant colonies #1-#3; lanes 6 and 8 are B. fragilis WT; lane 9 is a non-template control. IntF-UHF-BF3932/ Int-R-DHF-BF3932 PCR primers: lane 11–13 are B. fragilis Δ3538 mutant colonies #1-#3; lane 14, 15, 17 are B. fragilis Δ3932 mutant colonies #1-#3; lanes 16 and 18 are B. fragilis WT; lane 19 is a non-template control. UNIV-16s-F/ UNIV-16s-R PCR primers: lane 21–23 are B. fragilis Δ3538 mutant colonies #1-#3; lane 24, 25, 27 are B. fragilis Δ3932 mutant colonies #1-#3; lanes 26 and 28 are B. fragilis WT; lane 29 is a non-template control. Lane 10, 20, 30 are the 1kb DNA ladder (n = 2 replicates). For source gel data, see Fig. S1. i, j, R. gnavus isolates in red (R. gnavus RJX1118, R. gnavus RJX1119, R. gnavus RJX1124, R. gnavus RJX1125, R. gnavus RJX1126, R. gnavus RJX1128) that lack a homolog of Rumgna_02133 (Table S5) did not synthesize 3-oxoLCA or isoLCA from LCA (i). R. gnavus isolates in red that lack a homolog of Rumgna_02133 (Table S5) only produced isoLCA from 3-oxoLCA (j). All strains were incubated with 100 μM LCA as a substrate for 48 hours (n = 3 biological replicates per group). k, l, The 3α-HSDH gene of E. lenta is required to suppress TH17 cell differentiation in vitro. Representative FACS plots (l) and population frequencies of TH17 cells (k) are presented. Naive CD4+ T cells from wild-type B6Jax mice were cultured under TH17 cell polarizing conditions for 3 days. Culture supernatants of E. lenta DSM2243 or E. lenta DSM15644, an isolate lacking a 3α-HSDH, were added 18 hours after TCR activation (n=3 biologically independent samples per group, data are mean ± SEM, one-way ANOVA followed by Tukey’s multiple comparison test. p=0.000081 between column 4 and 6(l)). m, Production of 3-oxoLCA and isoLCA by “high” and “low” producer co-cultures. Production of 3-oxoLCA and isoLCA from LCA (100 μM) by co-cultures of human gut bacteria type strains in vitro are shown (high producer group: E. lenta DSM2243 + B. fragilis NCTC9343; low producer group: E. lenta DSM15644 + B. fragilis NCTC9343 ΔBF3538 and C. citroniae human isolate P2-B6 + B. fragilis NCTC9343 ΔBF3538; n = 3 biological replicates per co-culture, data are mean ± SEM).
Extended Data Fig. 5 |
Extended Data Fig. 5 |. Human gut bacteria affect T cell levels in gnotobiotic mice.
a, Representative FACS plots for IL-17A or IFNγ- producing CD4 T cells in the colonic lamina propria of GF mice (left) or in C.rodentium infected mice 5 days after infection (right). b, IsoLCA reduced IFNγ+ TH17 cell level but did not affect TH1 and Treg cell levels in GF mice following C. rodentium infection (n=8 for control and isoLCA groups, data are mean ± SEM pooled from two experiments followed by two-tailed unpaired t test). c, IsoLCA inhibited TH17 and IFNγ+ TH17 cell levels in a dose-dependent manner but not TH1 and Treg cell levels in GF mice treated with 0.08% or 0.4% (w/w) isoLCA-containing diet (linear regression, n=12 mice pooled from two experiments; TH17, R-squared=0.4877, p=0.0115; IFNγ+ TH17, R-squared=0.5083, p=0.0093; TH1, R-squared=0.0848, p=0.3715; Treg, R-squared=0.006924, p=0.7971). d, LCA did not affect IFNγ+ TH17 level while TH1 and Treg cell levels were negatively impacted in GF mice following C. rodentium infection. Mice were sorted into quartile groups based on LCA levels in cecal contents (see Methods for details, n=5 mice for Q1, n=6 for Q2, n=6 for Q3 and n=5 for Q4, data are mean ± SEM pooled from three experiments, one-way ANOVA followed by Tukey’s multiple comparison test). e, LCA treatment did not affect TH17 and IFNγ+ TH17 cell levels but negatively impacted TH1 and Treg cell levels in GF mice treated with 0.012%, 0.06%, 0.25% or 0.3% (w/w) LCA-containing diets (linear regression, n=22 mice; TH17, R-squared=0.01291, p=0.6141; IFNγ+ TH17, R-squared=0.1783, p=0.0503; TH1, R-squared=0.3818, p=0.0022; Treg, R-squared=0.3989, p=0016) f, 3-oxoLCA and isoLCA levels in mice colonized with the high producer bacterial group were significantly higher than those colonized with the low producer groups (linear regression, R-squared=0.1434, p=0.0564, n=26 mice for low producers; R-squared=0.4727, p=0.0011, n=19 for high producers; p=0.0033 for the difference between two lines). g, GF mice colonized with bacterial producers of 3-oxoLCA and isoLCA affected IFNγ+ TH17 but not TH1 or Treg cell levels. Mice were sorted into quartile groups based on 3-oxoLCA+isoLCA levels in cecal contents (see Methods for details, n=11 mice for Q1, n=12 for Q2, n=11 for Q3 and n=11 for Q4, data are mean ± SEM pooled from six experiments, one-way ANOVA followed by Tukey’s multiple comparison test). h, GF mice colonized with low and high bacterial producers of 3-oxoLCA and isoLCA affected TH17 and IFNγ+ TH17 but not TH1 or Treg cell levels (linear regression, n=26 for low producers, n=19 mice for high producers; TH17, R-squared=0.02255, p=0.4640 for low producers, R-squared=0.3699, p=0.0057 for high producers, p=0.3007 for the interaction term (slope*bacterial groups); IFNγ+ TH17, R-squared=0.03817, p=0.3389 for low producers, R-squared=0.3079, p=0.0137 for high producers, p=0.7402 for the interaction term (slope*bacterial groups); TH1, R-squared=0.1533, p=0.0647 for low producers, R-squared=0.006748, p=0.2430 for high producers, p=0.3013 for the interaction term (slope*bacterial groups); Treg, R-squared=0.0539, p=0.2538 for low producers; R-squared=0.1575, p=0.0925 for high producers, p=0.9930 for the interaction term (slope*bacterial groups)). i, TH17 cell percentages do not affect C. rodentium-encoded espB levels. Citrobacter colonization was measured by qPCR analyses detecting espB and plotted against TH17 cell percentages in mice used for bacterial colonization experiments shown in Fig. 4g, Extended Data Fig. 5g, h were determined by qPCR and plotted against percentage of Th17 cells in individual mice. n=31, R squared=0.02928 for goodness of fit, F=0.9352, p=0.3414 for slope by simple linear regression. Dotted lines are 95% confidence bands of the best fit line.
Extended Data Fig. 6 |
Extended Data Fig. 6 |. Levels of BA metabolites detected in the PRISM cohort.
Abundances of identifiable BAs in PRISM cohort. BA levels were not universally decreased in CD patients, indicating that decreased levels of LCA, 3-oxoLCA, and isoLCA were not due to lower levels of all BAs in these cohorts. Boxplots show median and lower/upper quartiles with outliers outside of boxplot ‘whiskers’ (indicating the inner fences of the data). n = 34 for CD, n=52 for UC and n=34 for non-IBD. The percentage of zeros in each condition are added as x-axis tick labels. See Table S6 for full results.
Extended Data Fig. 7 |
Extended Data Fig. 7 |. Levels of BA metabolites detected in the HMP2 cohort.
Abundances of identifiable BAs in HMP2 cohort. BA levels were not universally decreased in dysbiotic CD patients, indicating that decreased levels of LCA, 3-oxoLCA, and isoLCA were not due to lower levels of all BAs in these cohorts. Boxplots show median and lower/upper quartiles with outliers outside of boxplot ‘whiskers’ (indicating the inner fences of the data). n=47 for dysbiotic CD, n = 169 for non-dysbiotic CD, n=12 for dysbiotic UC, n=110 for non-dysbiotic UC and n=122 for non-IBD. The percentage of zeros in each condition are added as x-axis tick labels. See Table S6 for full results.
Extended Data Fig. 8 |
Extended Data Fig. 8 |. Correlation between TH17/IL-17-related features and LCA metabolite abundance in HMP2.
TH17/IL-17-related genes in IBD upregulated in IBD were significantly negatively correlated with 3-oxoLCA and isoLCA (FDR-adjusted p-value < 0.25) but not the other 3 control BAs (LCA, DCA, and CDCA). Differentially expressed TH17/IL-17-related genes with at least one significant association are shown. This analysis was based on a subset of n = 71 subject-unique samples with matched metagenomic, metabolomic, and host transcriptomic profiling in the HMP2 cohort (33 CD, 21 UC, and 17 non-IBD controls, Spearman correlation with FDR adjusted p-value < 0.25). Correlations were based on residual transcript and metabolite abundance after correcting for diagnosis, consent age, and antibiotic use. See Table S8 for full results.
Extended Data Fig. 9 |
Extended Data Fig. 9 |. Correlation between 3α,β-HSDH-related microbial features and LCA metabolite abundance in HMP2.
a-b, Relative abundance distributions of differentially abundant 3α-HSDH (a) and 3α-HSDH (b) homologs profiled from HMP2 metagenomes (n = 1,595 samples from 130 subjects: linear mixed-effects model coefficient for dysbiosis within diagnosis, FDR-adjusted p-values < 0.05). Boxplots show median and lower/upper quartiles with outliers outside of boxplot ‘whiskers’ (indicating the inner fences of the data). The percentage of zeros in each condition are added as x-axis tick labels. See Table S9 for full results. c-f, LCA metabolites show significant differential abundance after adjusting for variation in underlying taxonomic abundance. Accounting for underlying variation in the taxonomic abundance of the major producers of isoLCA (Actinobacteria and Firmicutes), we used the phyla abundances as additional covariates to normalize the abundance of LCA metabolites and enzymes. 3-oxoLCA (c) and isoLCA (d) as derived from metabolomic profiles of HMP2 cohorts are significantly depleted in HMP2 dysbiotic CD samples (n = 48) relative to non-dysbiotic controls (n = 169). Meanwhile, 3α-HSDH (e) and 3β-HSDH (f) homologs were also profiled from HMP2 metagenomes (n = 1,595 samples from 130 subjects; linear mixed-effects model coefficient for dysbiosis within diagnosis, FDR-adjusted p-values < 0.05). The percentage of zeros in each condition are added as x-axis tick labels. Boxplot ‘boxes’ indicate the first, second (median), and third quartiles of the data. The points outside of boxplot whiskers are outliers. Statistical analysis was performed using a linear mixed-effect model and its coefficient and significance, FDR-adjusted p-values, are shown.
Extended Data Fig. 10|
Extended Data Fig. 10|. 3α- and 3β-HSDH homologs and species with 3α-/ 3β-HSDH activity are likely to be positively correlated with 3-oxoLCA/ isoLCA in HMP2.
a, Differentially abundant 3α-/ 3β-HSDH homologs (FDR adjusted p-value < 0.05) with at least one significant metabolite association (Spearman correlation with FDR adjusted p-value < 0.25). Correlations were computed over a subset of paired metabolomes and metagenomes from the HMP2 cohort derived from 106 participants (CD, n=50; UC, n=30; Non-IBD, n=26). b, Differentially abundant species with validated 3α-/ 3β-HSDH activity (FDR adjusted p-value < 0.05) with at least one significant metabolite association (Spearman correlation with FDR adjusted p-value < 0.25) with five metabolites are shown for the paired metabolome and metagenome samples from 106 participants (CD, n=50; UC, n=30; Non-IBD, n=26) in HMP2.
Fig. 1 |
Fig. 1 |. Human gut bacteria produce 3-oxoLCA, a TH17-modulating BA metabolite.
a, Bacterial conversion of host-produced BAs. Prior to this work, the bacterial strains and enzymes responsible for the conversion of lithocholic acid (LCA) to 3-oxolithocholic acid (3-oxoLCA) and isolithocholic acid (isoLCA) were not known. b, Representative UPLC-MS traces (left) and percent production of 3-oxoLCA (right) by human bacterial isolates. Total ion chromatograms (TICs) are shown. An unknown peak of m/z 375.2 (#, retention time 5.7 min), was later identified as isolithocholic acid (isoLCA) (see Extended Data Fig. 2c) (n = 3 biological replicates per group, data are mean ± SEM). See Table S2 for full results. c, d, Supernatants from E. lenta DSM2243 cultured with LCA inhibited TH17 cell differentiation in vitro. Representative FACS plots (c) and population frequencies of mouse TH17 cells (d) activated and expanded in vitro are shown. Naive CD4+ T cells from wild-type B6Jax mice were cultured under TH17 cell polarizing conditions for 3 days and bacterial supernatants were added 18 hours after T cell receptor (TCR) activation (n = 3 biologically independent samples per group, data are mean ± SEM, one-way ANOVA followed by Tukey’s multiple comparison test).
Fig. 2 |
Fig. 2 |. The abundant gut bacterial metabolite isoLCA inhibits TH17 cell differentiation.
a, b, IsoLCA inhibited the differentiation of mouse TH17 cells in vitro. Representative FACS plots (a) and population frequencies of TH17 cells (b) cultured in the presence of various BAs (20 μM) and ML209 (2 nM) (n = 3 biologically independent samples per condition, data are mean ± SEM, one-way ANOVA followed by Dunnett’s multiple comparison test, vehicle set as control). c-f, IsoLCA inhibited the differentiation of TH17 cells in vivo. Experimental scheme (c), representative FACS plots (d) and population frequencies of TH17 cells (e) and Treg cells (f) in the ileal lamina propria of SFB-colonized mice are shown. B6 Jax mice were gavaged with SFB-rich fecal pellets and maintained on control or isoLCA-containing powder chow (0.3% w/w) for one week (n=8 mice per group, pooled from two experiments, data are mean ± SEM, two-tailed unpaired t-test). g, Three-dimensional structures of 3-oxoLCA, isoLCA, and LCA showing the facial orientation of the C3 oxygenation.
Fig. 3 |
Fig. 3 |. Bacterial hydroxysteroid dehydrogenases (HSDHs) convert LCA to 3-oxoLCA and isoLCA.
a, Proposed biosynthetic pathway for the conversion of LCA to 3-oxoLCA and isoLCA. b, Representative UPLC-MS traces (left) and percent production of isoLCA (right) by human bacterial isolates incubated with 3-oxoLCA (100 μM) for 48 hours. TICs are shown. Clostridium innocuum, which encoded 3β-HSDH homologs in HMP2 metagenomes (see Methods; Table S9), was selected for in vitro testing (n = 3 biological replicates per group, data are mean ± SEM, see Table S2). c, d, Heterologous expression of candidate HSDHs from E. lenta DSM2243, B. fragilis NCTC9343, and R. gnavus ATCC29149 in E. coli. E. coli lysate was incubated with either 100 μM LCA (c) or 100 μM 3-oxoLCA (d) as a substrate. E. coli containing an empty vector was used as a control. Data are reported as percent conversion to product (either 3-oxoLCA or isoLCA) (n = 3 biological replicates per group, data are mean ± SEM, see Extended Data Fig. 4 and Figs. S1 and S10 for protein gels). e, B. fragilis Δ3538, B. fragilis Δ3932, or the type strain B. fragilis NCTC9343 were incubated with 3-oxoLCA (100 μM) for 48 hours. Representative TIC UPLC-MS traces (left) and percent production of the target molecule isoLCA (right) are shown (n = 3 biological replicates per group, data are mean ± SEM, see Figs. S1 and S11 for DNA gels). f, Cladogram of E. lenta and related human isolates and their production of 3-oxoLCA and isoLCA (El, E. lenta; Es, Eggerthella sinensis; Gs, Gordonibacter sp., and Gp, Gordonibacter pamelaeae). E. lenta isolates in red (E. lenta 28B, E. lenta DSM15644, E. lenta Valencia) that lack a homolog of Elen_0690 did not synthesize 3-oxoLCA from LCA. All strains were incubated with 100 μM LCA for 48 hours (n = 3 biological replicates per group, data are mean ± SEM).
Fig. 4 |
Fig. 4 |. 3-oxoLCA and isoLCA modulate TH17 response in vivo and are negatively correlated with Crohn’s disease in humans.
a, Experimental scheme for gnotobiotic experiments. Colonized mice were fed control chow or chow containing 0.3% LCA (w/w) and their cecal contents were analyzed by UPLC-MS for LCA metabolites. b, c, GF-B6 mice were monocolonized with the E. lenta type strain (DSM2243) or a strain lacking a 3α-HSDH (DSM15644) (b) and were co-colonized with DSM2243 and B. fragilis NCTC9343 or monocolonized with B. fragilis (c). n=5, 6 for monocolonized and monocolonized+LCA groups, respectively (b); n=7, 7, 6 mice for GF, E. lenta+B. fragilis, and B. fragilis groups, respectively (c). IsoLCA was not detected in (b). d, Experimental scheme for gnotobiotic experiments. GF mice were treated with a BA-containing diet in the presence or absence or prior colonization. Following C.rodentium infection, both IL-17A-producing CD4 T cell percentages in the colonic lamina propria and BA levels in the cecal contents of treated animals were analyzed. e, IsoLCA feeding suppressed TH17 differentiation in Citrobacter-infected GF mice (n=8 per group). Data are mean ± SEM pooled from two experiments, followed by two-tailed unpaired t test f, LCA treatment did not significantly affect TH17 cell levels in Citrobacter-infected GF mice treated with LCA-containing diets. Mice were sorted into quartile groups based on LCA levels in cecal contents (see Methods for details; Q1, lowest BA quartile, n=5 mice; Q2, n=6; Q3, n=6; Q4, highest BA quartile, n=5 mice). g, Population frequencies of TH17 cells were reduced in mice colonized with human gut bacteria producing higher compared to lower levels of 3-oxoLCA and isoLCA. Mice were sorted into quartile groups based on 3-oxoLCA+isoLCA levels in cecal contents (see Methods for details; Q1, lowest BA quartile, n=11 mice; Q2, n=12; Q3, n=11; Q4, highest BA quartile, n=11 mice). Data are mean ± SEM, followed by two-tailed unpaired t test (e) or by one-way ANOVA by Dunnett’s (c) or Tukey’s multiple comparison tests (b, f, g); pooled from two (b, c), three (e, f), and six (g) experiments. h-k, 3-oxoLCA and isoLCA were significantly depleted in CD subjects relative to controls in PRISM cohort (n = 34, 52, 34 for CD, UC, non-IBD) (h, i) and in dysbiotic CD samples relative to non-dysbiotic controls in HMP2 cohort (n=47,169, 12, 110, and 122 for dysbiotic CD, non-dysbiotic CD, dysbiotic UC, non-dysbiotic UC, and non-IBD, respectivley) (j, k). The percentage of zeros are added as x-axis tick labels. Boxplot ‘boxes’ indicate the first, second (median), and third quartiles of the data. Points outside of boxplot whiskers are outliers. Statistical analysis was performed using a linear mixed-model and its coefficient and significance, FDR-adjusted p-values, are shown (see Table S6).

Comment in

References

    1. Hang S et al. Bile acid metabolites control TH17 and Treg cell differentiation. Nature 576, 143–148 (2019). - PMC - PubMed
    1. Fiorucci S & Distrutti E Bile acid-activated receptors, intestinal microbiota, and the treatment of metabolic disorders. Trends Mol Med 21, 702–714 (2015). - PubMed
    1. Ridlon JM, Kang D-J & Hylemon PB Bile salt biotransformations by human intestinal bacteria. J Lipid Res 47, 241–259 (2005). - PubMed
    1. Modica S, Gadaleta RM & Moschetta A Deciphering the nuclear bile acid receptor FXR paradigm. Nucl Recept Signal 8, e005 (2010). - PMC - PubMed
    1. Schaap FG, Trauner M & Jansen PLM Bile acid receptors as targets for drug development. Nat Rev Gastroentero 11, 55–67 (2014). - PubMed