. 2022 Mar;603(7902):728-735.
doi: 10.1038/s41586-022-04494-7. Epub 2022 Mar 16.

A genome-scale screen for synthetic drivers of T cell proliferation

Affiliations

A genome-scale screen for synthetic drivers of T cell proliferation

Mateusz Legut et al. Nature. 2022 Mar.

Abstract

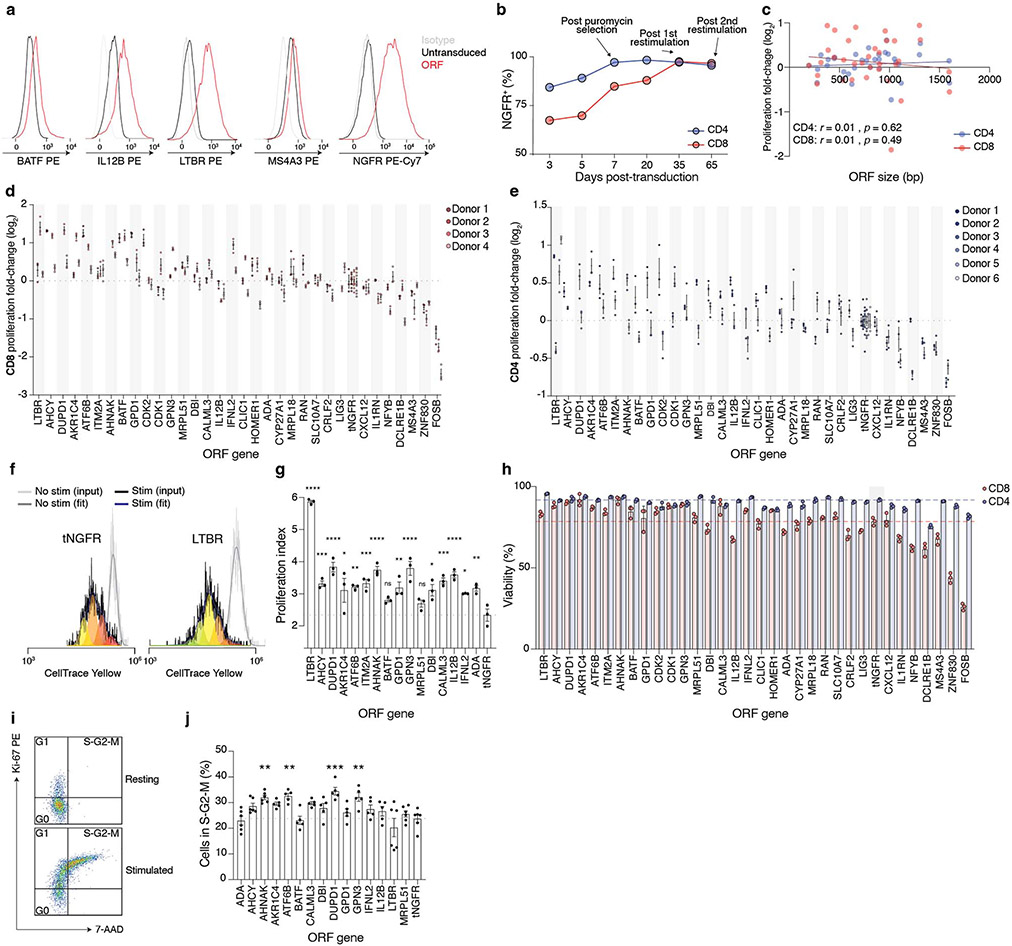
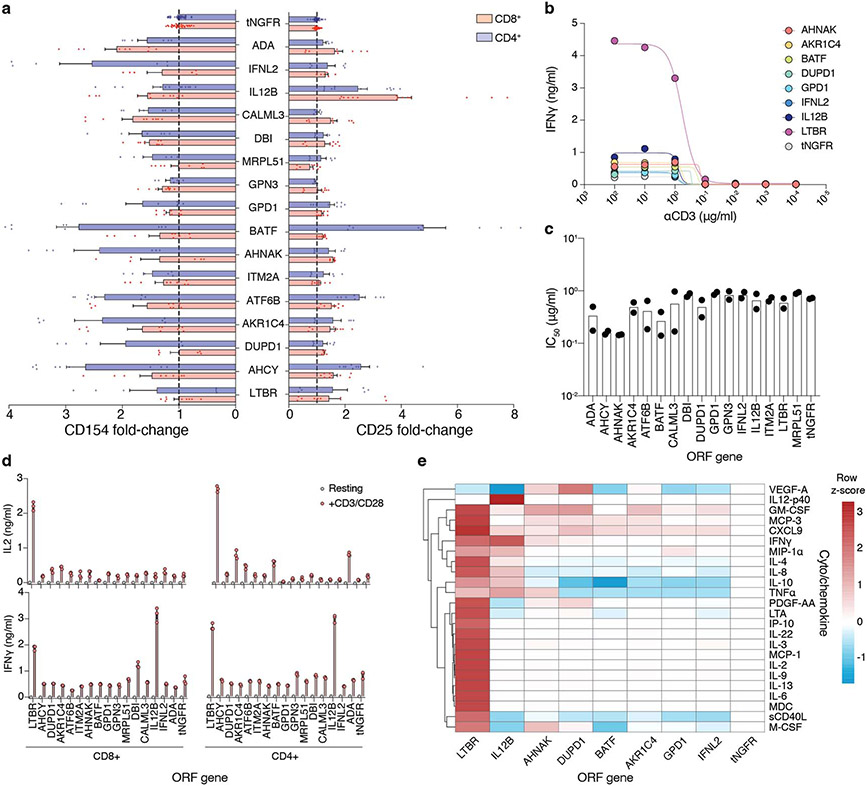
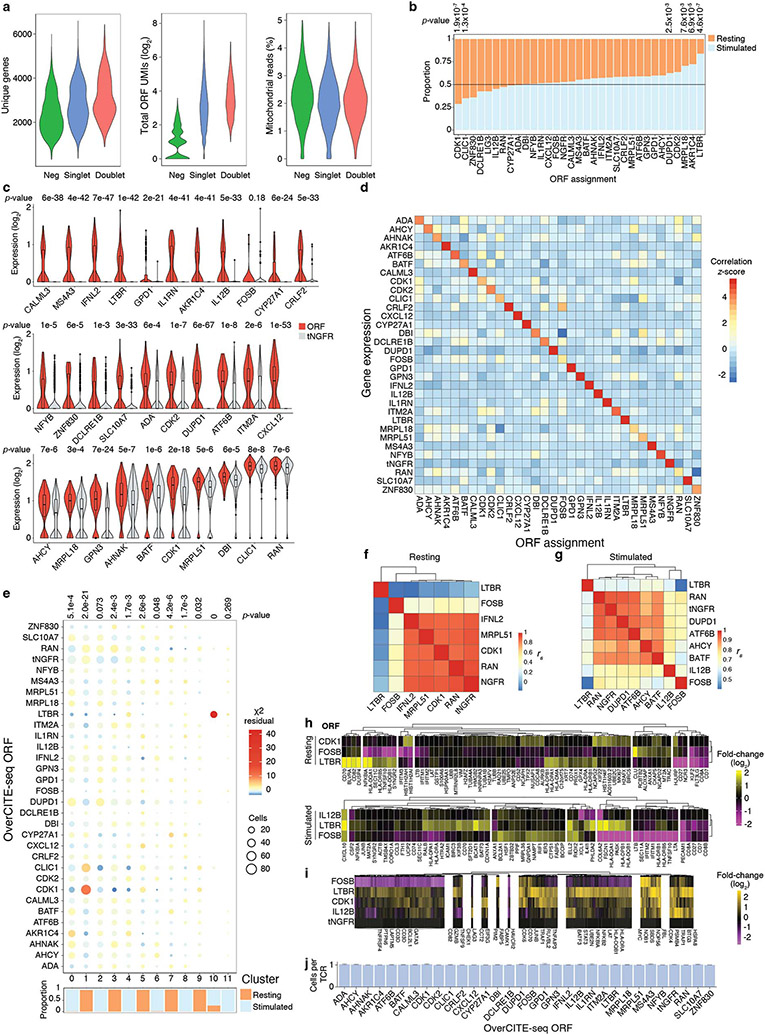
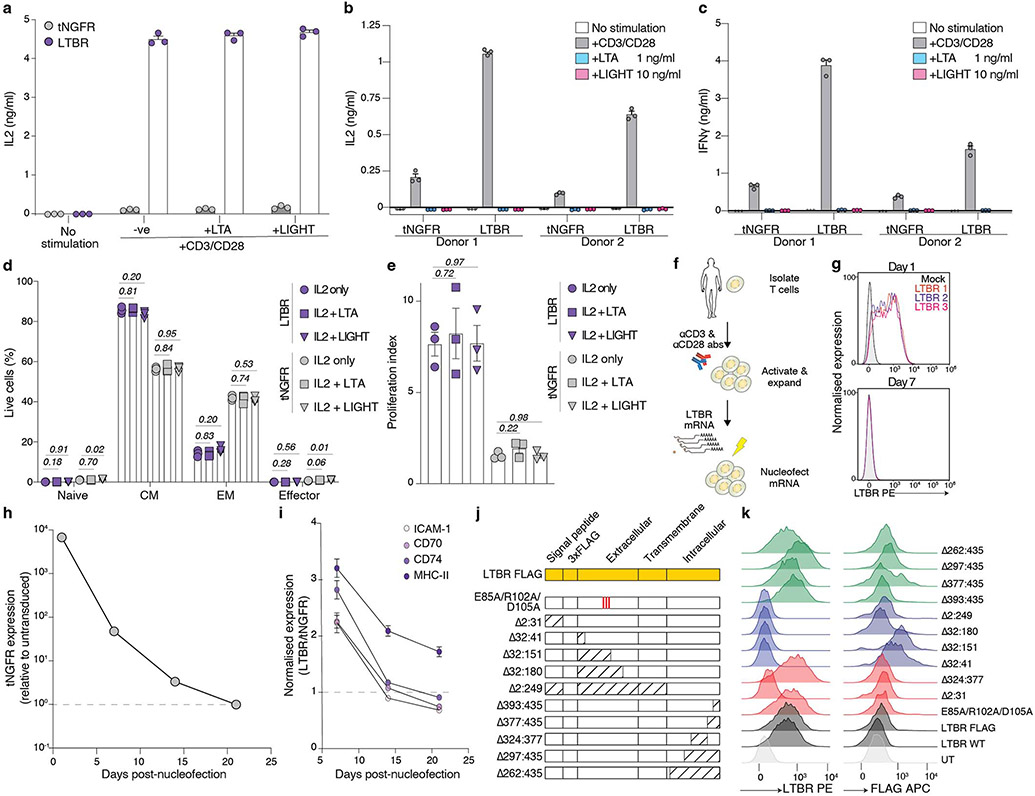
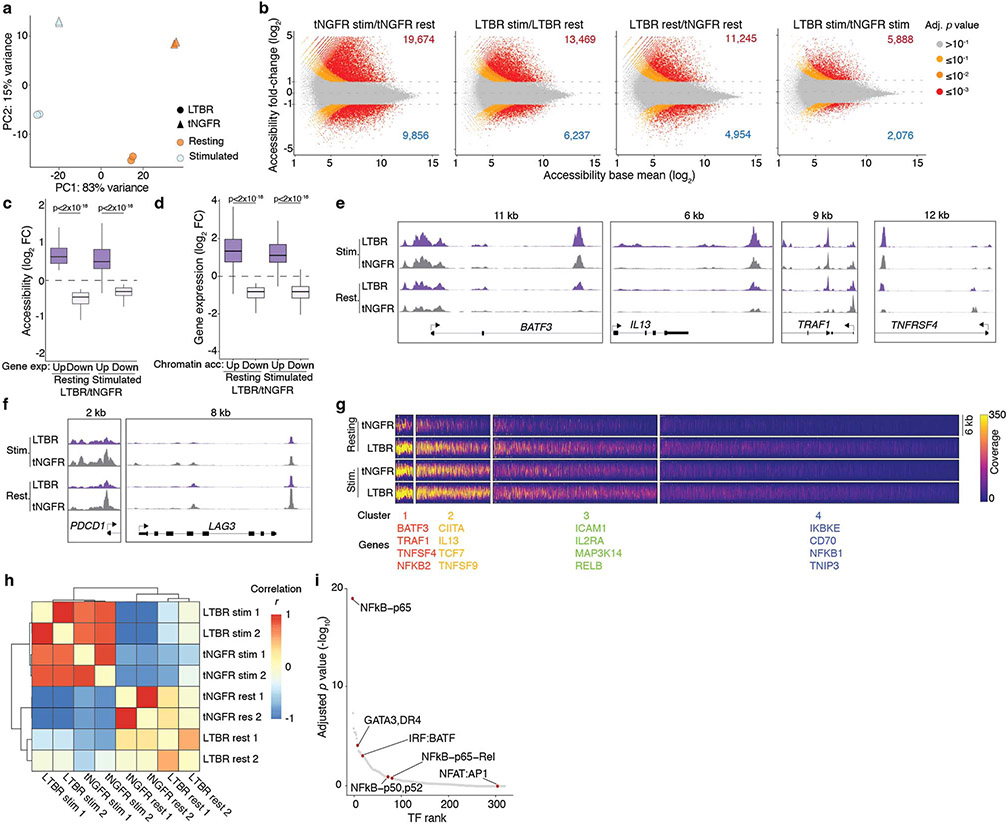
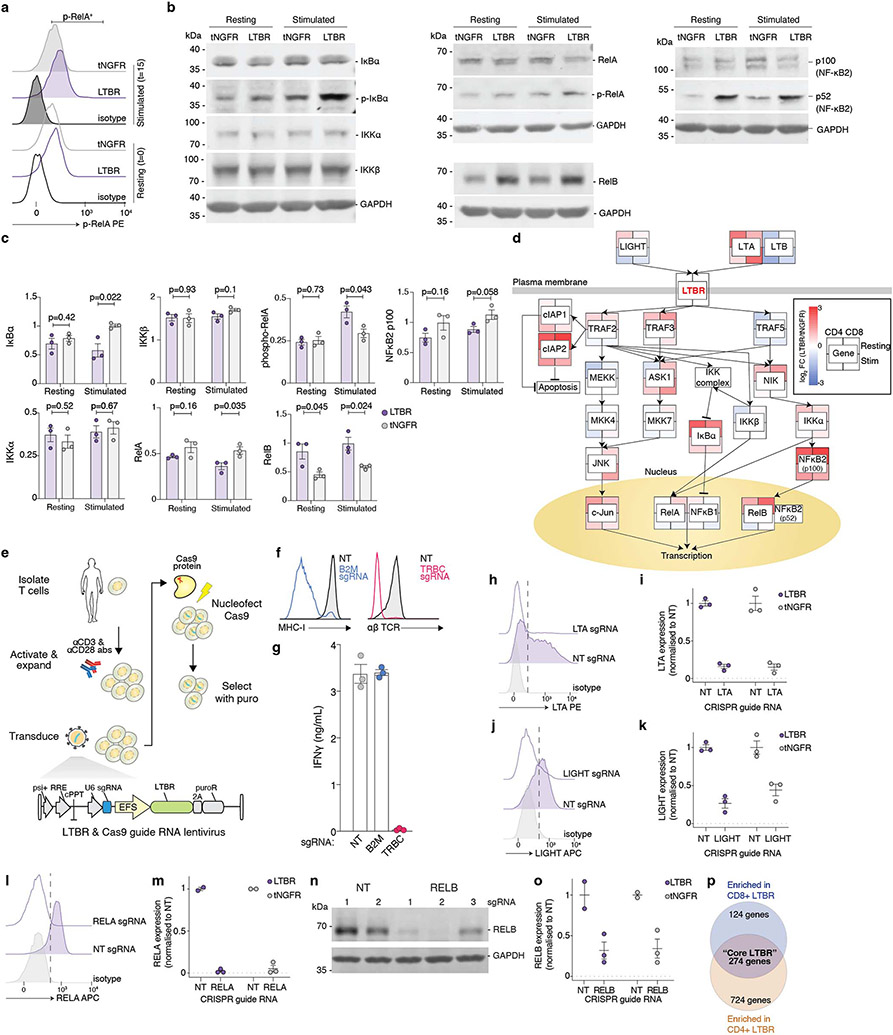
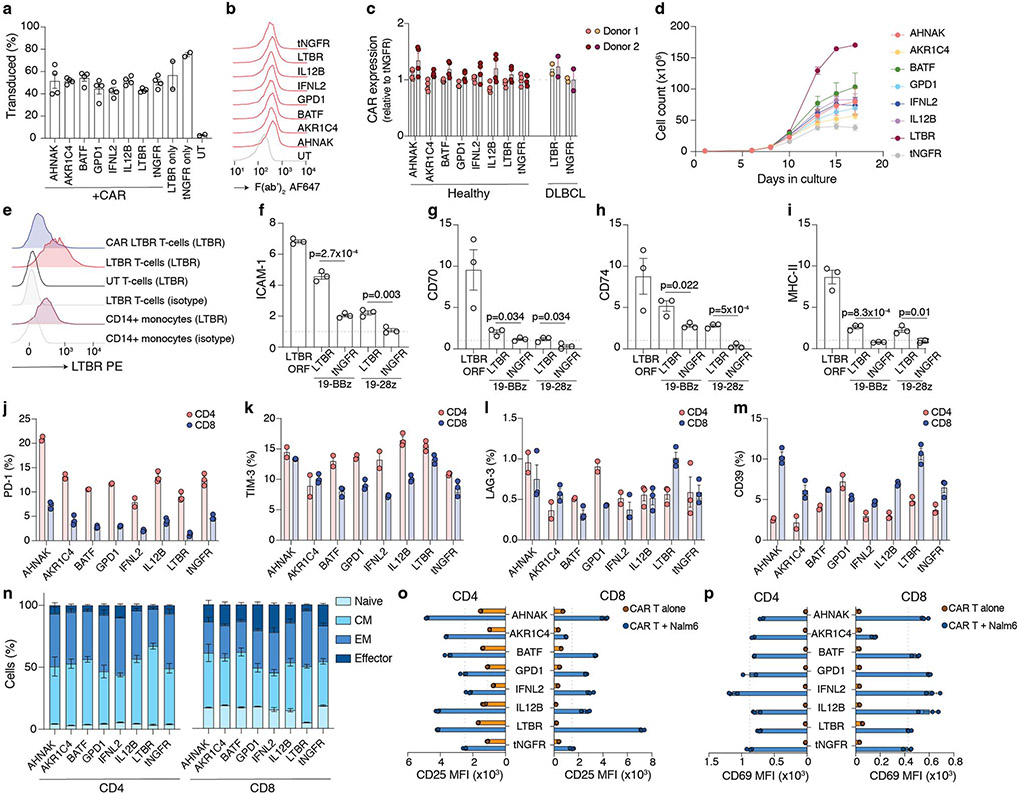
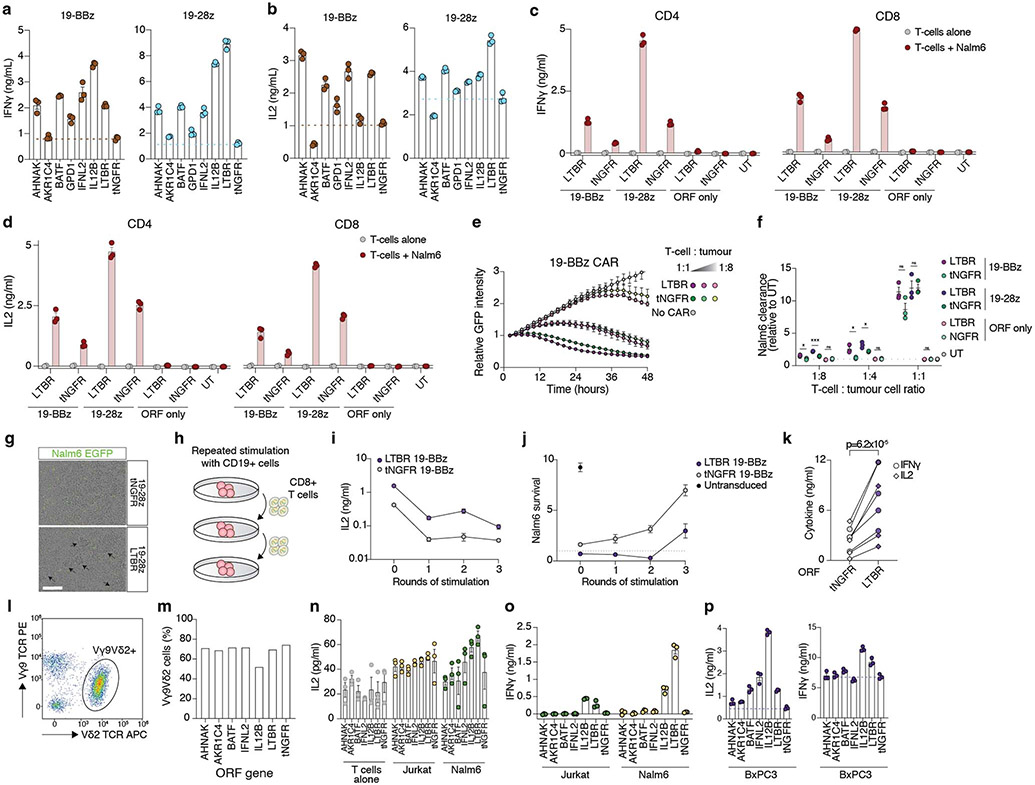
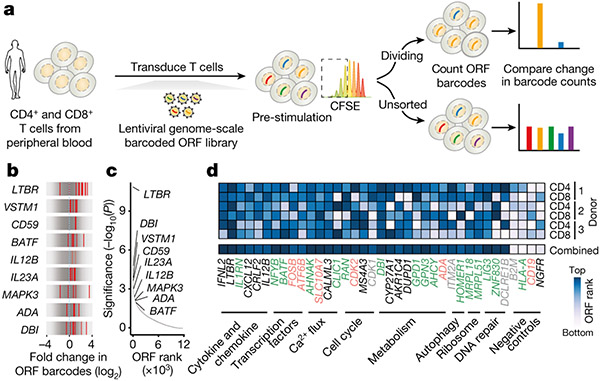
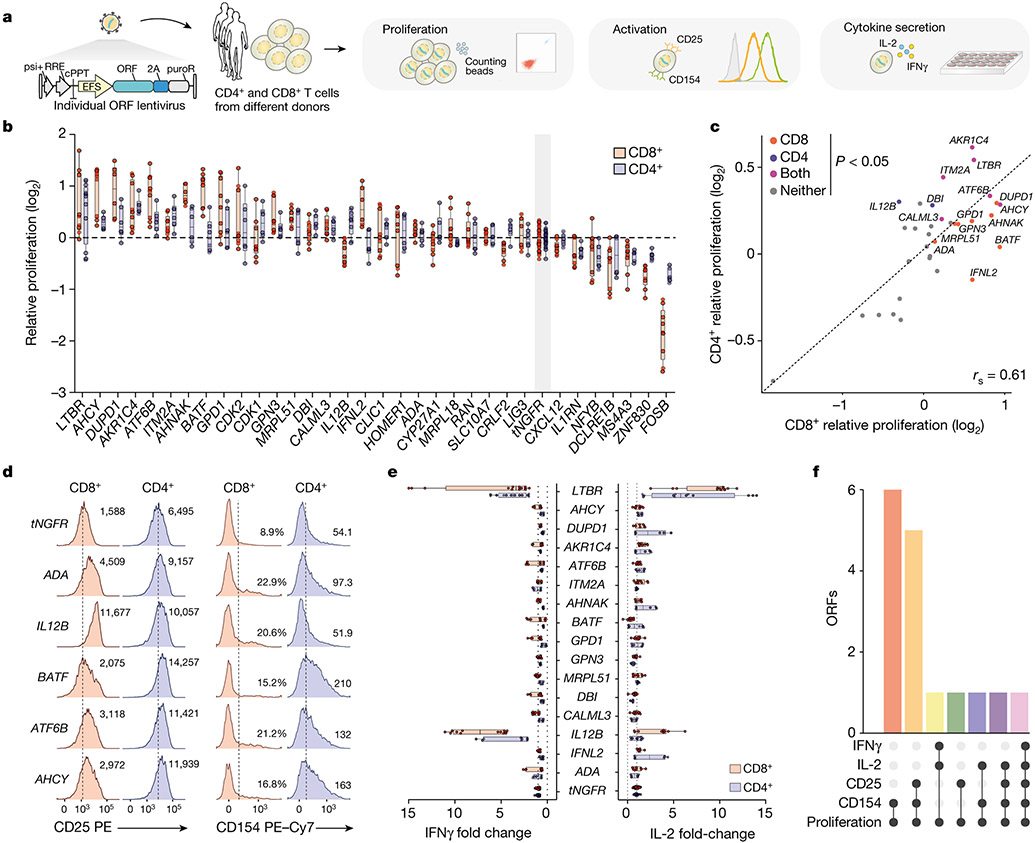
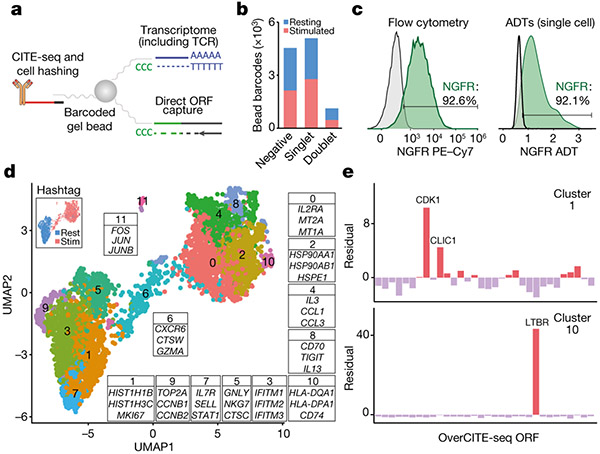
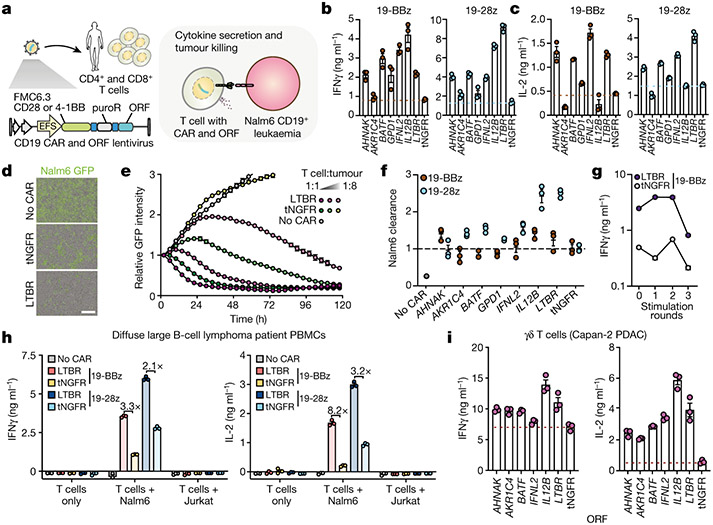
The engineering of autologous patient T cells for adoptive cell therapies has revolutionized the treatment of several types of cancer1. However, further improvements are needed to increase response and cure rates. CRISPR-based loss-of-function screens have been limited to negative regulators of T cell functions2-4 and raise safety concerns owing to the permanent modification of the genome. Here we identify positive regulators of T cell functions through overexpression of around 12,000 barcoded human open reading frames (ORFs). The top-ranked genes increased the proliferation and activation of primary human CD4+ and CD8+ T cells and their secretion of key cytokines such as interleukin-2 and interferon-γ. In addition, we developed the single-cell genomics method OverCITE-seq for high-throughput quantification of the transcriptome and surface antigens in ORF-engineered T cells. The top-ranked ORF-lymphotoxin-β receptor (LTBR)-is typically expressed in myeloid cells but absent in lymphocytes. When overexpressed in T cells, LTBR induced profound transcriptional and epigenomic remodelling, leading to increased T cell effector functions and resistance to exhaustion in chronic stimulation settings through constitutive activation of the canonical NF-κB pathway. LTBR and other highly ranked genes improved the antigen-specific responses of chimeric antigen receptor T cells and γδ T cells, highlighting their potential for future cancer-agnostic therapies5. Our results provide several strategies for improving next-generation T cell therapies by the induction of synthetic cell programmes.


Figures

Extended Data Figure 1.
Extended Data Figure 1.. Design of human ORF library screen in primary T-cells.
a) Barcoded vector design for ORF overexpression. b) Distribution of the number of barcodes per ORF in the library. c) Vector design for quantifying the effect of different promoters and ORF insert sizes on lentiviral transduction efficiency. EFS – elongation factor-1α short promoter, CMV – cytomegalovirus promoter, PGK – phosphoglycerate kinase-1 promoter. d) Sequential gating strategy and representative histograms of cells transduced with marker gene rat CD2 under different promoters. e) Percentage of positive cells and (f) mean fluorescence intensity (MFI) of rat CD2 (rCD2) expressed from the EFS and CMV promoters, following puromycin selection of transduced primary CD4+ T-cells. Each data point indicates individual transduction (n = 3 biological replicates). Error bars are SEM. g) Distribution of ORF sizes in the genome-scale library. The size of TCR-rCD2 construct tested in panels e and f is marked. h) Titration of CD3/CD28 antibodies. T-cells were labelled with CFSE, stimulated and incubated for 4 days. Gate for proliferating T-cells was set to include cells that proliferated at least twice (third CFSE peak). i) Expansion of T cells from three healthy donors transduced with the ORF library. j) Representative CFSE profile of restimulated CD8+ and CD4+ T cells before the sort. The CFSElow sort gate is marked. k) Recovery of individual barcodes or corresponding ORFs in transduced T cells and plasmid used for lentivirus production. Respective samples from three donors were computationally pooled together at equal number of reads prior to counting how many barcodes or ORFs were present with a minimum of one read. l) Distribution of reads corresponding to ORFs of different sizes. ORFs were assigned to ten quantiles based on their size, with Q1 being smallest size and Q10 being the largest size (n = 1,161 ORFs per quantile). Box shows 25-75 percentile with a line at the median while whiskers extend to 1.5x interquartile range. m) Enrichment of genes in both CFSElow CD4+ and CD8+ T-cells, calculated by collapsing individual barcodes into corresponding genes. Significantly-enriched genes (log2 fold change higher than 0.5 and adjusted p-value lower than 0.05) are marked in red. Immune response genes of interest are marked. n) Overlap of significantly-enriched genes from panel m in individual screen populations (CD4+, CD8+) analysed separately. o) Normalised enrichment of individual barcodes for indicated genes in the CD8+ screen. p) GO biological processes for significantly-enriched genes in panel m. (q) Overlap of significantly-enriched genes with differentially-expressed genes between CD3/CD28 stimulated and naïve T-cells.
Extended Data Figure 2.
Extended Data Figure 2.. Overexpression of select ORFs in screen-independent donors.
a) Histograms of selected ORF expression in T cells after puromycin selection. b) Quantification of tNGFR expression in transduced CD4+ and CD8+ T cells. Puromycin selection was complete after 7 days post transduction. To maintain T cells in culture, they were re-stimulated with CD3/CD28 on days 21 and 42. c) Correlation between ORF sizes and changes in proliferation relative to tNGFR. Mean log2 fold-changes are shown. d) Proliferation of restimulated CD8+ or e) CD4+ T cells relative to tNGFR in individual donors (n = 3 biological replicates). Mean and SEM are shown. f, g) Proliferation of T-cells transduced with ORFs that significantly improved T-cell proliferation (see Fig. 2c) measured by dilution of CellTrace Yellow. Representative CellTrace Yellow histograms and fitted distributions (f) as well as quantifications of the proliferation index (g) are shown (n = 3 biological replicates). P values: <0.0001, 0.0008, <0.0001, 0.011, 0.0031, 0.0007, <0.0001, 0.28, 0.004, <0.0001, 0.58, 0.01, 0.0003, <0.0001, 0.036, 0.0049 (left to right). h) Viability of ORF-transduced T-cells 4 days after CD3/CD28 restimulation. Representative data from one donor (out of 4 donors tested) are shown (n = 3 biological replicates), i, j) Cell cycle analysis of T-cells stimulated with CD3/CD28 for 24 h. Gating was performed based on isotype and fluorescence minus one controls. Representative gating (i) as well as (j) quantification of cells in the S-G2-M phases (for stimulated T-cells) are shown (n = 6 biological replicates from two donors). P values: 1, 0.29, 0.0065, 0.17, 0.0051, 1, 0.13, 0.55, 0.0004, 0.98, 0.0088, 0.68, 0.91, 0.7, 1 (left to right). Statistical significance for panels g and j: one way ANOVA with Dunnett’s multiple comparisons test * p<0.05, ** p<0.01, *** p<0.001, **** p<0.0001. Error bars indicate SEM.
Extended Data Figure 3.
Extended Data Figure 3.. Functional response of ORF-overexpressing T-cells.
a) Quantitative expression of CD25 or CD154 following re-stimulation. A minimum of two donors was tested in triplicate per gene. Only genes that significant increase T-cell proliferation in CD4+, CD8+ or both T-cell subsets are shown. Mean and SEM are shown. b,c) Sensitivity to antigen dose. T-cells were incubated with indicated anti-CD3 antibody concentrations for 24 h and the amount of secreted IFNγ was quantified. Representative dose-response curve fitting (b) and IC50 quantifications (c) are shown (n = 2 biological replicates). d) Quantification of secreted IL-2 and IFNγ in T-cells incubated alone or with CD3/CD28 antibodies for 24 h. Representative data from one out of four donors (n = 3 biological replicates) are shown. e) Multiplexed quantification of selected secreted cytokines and chemokines by ORF-transduced T cells after 24 h of CD3/CD28 stimulation. Means of duplicate measurements (from independent samples) z-score normalised to tNGFR are shown. Absolute quantities of secreted cytokines and chemokines in stimulated and resting T cells are shown in Supplementary Table 7.
Extended Data Figure 4.
Extended Data Figure 4.. OverCITE-seq identifies ORFs and their transcriptional effects.
a) Quality parameters of cells as identified by gel bead barcodes. Negative, singlets and doublets are assigned based on cell hashing. b) Proportion of stimulated and resting T-cells among cells assigned to each ORF. Chi-squared test p-values are shown for ORFs with significantly shifted (uneven) distributions of stimulated and rested cells. c) Cell-cycle corrected scaled expression of the overexpressed gene in the cells transduced with the respective ORF and negative control (tNGFR). Two-sided Wilcoxon test p-values shown above the violin plots indicate the statistical significance of gene expression level between specific ORF and tNGFR-transduced T-cells. Box shows 25-75 percentile with a line at the median while whiskers extend to maximum and minimum values. N = 71 (ADA), 147 (AHCY), 190 (AHNAK), 119 (AKR1C4), 124 (ATF6B), 179 (BATF), 137 (CALML3), 189 (CDK1), 129 (CDK2), 236 (CLIC1), 84 (CRLF2), 91 (CXCL12), 88 (CYP27A1), 129 (DBI), 26 (DCLRE1B), 261 (DUPD1), 25 (FOSB), 119 (GPD1), 124 (GPN3), 199 (IFNL2), 60 (IL12B), 70 (IL1RN), 156 (ITM2A), 74 (LTBR), 88 (MRPL18), 167 (MRPL51), 107 (MS4A3), 69 (NFYB), 355 (NGFR), 261 (RAN), 182 (SLC10A7), and 56 (ZNF830) single cells. d) Expression of all ORF genes by cells assigned each ORF. Each row is z-score normalised. e) Distribution of individual ORF frequencies in clusters. Numbers of ORF cells and the chi-squared test residuals are displayed. Chi-squared test p-values indicating whether ORF distribution in each cluster significantly differs from overall ORF distribution are shown on top of the plot. Proportions of stimulated and resting T-cells in each cluster are shown underneath the cluster label. f,g) Spearman correlations between transcriptional profiles of selected ORF cells in resting (f) and stimulated (g) populations. h) Fold change of top differentially expressed genes between cells with the indicated ORFs in resting and stimulated T-cells. For each condition, the ORFs with the strongest transcriptional changes (compared to tNGFR cells) are shown. i) Differential gene expression in stimulated ORF T-cells compared to resting T-cells. Genes with significant expression changes in at least one ORF are shown (DESeq2 adjusted p < 0.05). For all genes, we display log2 fold-change of each ORF (stimulated) to tNGFR (resting), normalised to log2 fold-change of tNGFR (stimulated) to tNGFR (resting). Genes of interest in each cluster are labelled. j) Mean TCR clonotype diversity in ORF cells.
Extended Data Figure 5.
Extended Data Figure 5.. Functional analysis of LTBR overexpression in T-cells.
a) LTBR expression in the indicated human primary tissues from the Genotype-Tissue Expression (GTEx) project v8 (n = 948 donors). Box shows 25-75 percentile with a line at the median. b) LTBR expression in peripheral blood mononuclear cells (PBMCs) from 31,021 cells from 2 donors. Cell types indicated are derived from Harmony tSNE clustering of single-cell transcriptomes. c) Overlap between significantly upregulated genes in LTBR cells compared to tNGFR cells identified in single-cell or bulk RNA-seq. d,e) TCF1 expression in LTBR or tNGFR transduced T-cells. d) Representative histograms of TCF1 expression and the gate for TCF1+ cells (dashed line) are shown, as well as (e) quantification of TCF1+ cells (n = 3 biological replicates). f-h) ICAM-1, CD70, CD74, and MHC-II expression in LTBR and tNGFR T-cells. Representative histograms (f), quantification (g) in n = 3 donors (CD8+) or n = 4 donors (CD4+) and timecourse (h) of expression in LTBR and tNGFR cells after CD3/CD28 stimulation (n = 3 biological replicates). i) Differentiation phenotype of NGFR and LTBR transduced T cells (n = 4 donors, CD4+ and CD8+ separately). CM: Central memory. EM: Effector memory. Differentiation was defined based on CD45RO and CCR7 expression (naïve: CD45ROneg CCR7+, CM: CD45RO+ CCR7+, EM: CD45RO+ CCR7neg, effector CD45ROneg CCR7neg). j) Representative dot plots of T-cell viability after CD3/CD28 stimulation. Viable cells are in the lower left quadrant. k) Cell viability of CD4+ T-cells transduced with LTBR or tNGFR lentivirus, either re-stimulated with CD3/CD28 for four days or left unstimulated (n = 2 donors with 3 biological replicates each). l,m) LTBR and tNGFR cells were stimulated with a 3:1 excess of CD3/CD28 beads every three days for up to three rounds of stimulation. Following repeated stimulation, expression of TIM-3 and LAG-3 (l) was measured in resting cells, and secretion of IFNγ and IL2 (m) was measured in restimulated cells (n = 3 biological replicates). Statistical significance for panels e, i, and k: two-sided unpaired t-test; for panel g: two-sided paired t-test. Error bars indicate SEM.
Extended Data Figure 6.
Extended Data Figure 6.. LTBR ligands and expression of LTBR via mRNA or with deletion and point mutants.
a) IL2 secretion after 24 hour stimulation with CD3/CD28 antibodies. Where indicated, recombinant soluble LTA (1 ng/mL) or LIGHT (10 ng/mL) were added together with CD3/CD28 antibodies. CD4+ T cells from one donor were tested in triplicate. b,c) CD4+ and CD8+ T cells from two donors were co-incubated for 24 hours with CD3/CD28 antibodies or recombinant soluble LTA or LIGHT and then IL2 (b) and IFNγ (c) were measured. (n = 3 biological replicates). d,e) Differentiation phenotype (d) or proliferation (e) after restimulation of tNGFR and LTBR transduced T cells (n = 3 biological replicates) incubated either with IL2 alone or with LTA (1 ng/mL) or LIGHT (10 ng/mL) for the duration of culture. CM: Central memory. EM: Effector memory. Unpaired two-sided t-test p values are shown. f-i) Transient LTBR or tNGFR expression via mRNA nucleofection (f). T-cells were either nucleofected with LTBR or tNGFR mRNA (n = 3 biological replicates), and the surface expression of LTBR (g), tNGFR (h) or four genes upregulated in LTBR cells (i) was monitored over 21 days. At each timepoint the expression of target genes was normalised to matched tNGFR control. j) Schematic representation of FLAG-tagged LTBR mutants. k) LTBR and FLAG expression in T-cells transduced with LTBR mutants. Error bars indicate SEM.
Extended Data Figure 7.
Extended Data Figure 7.. Chromatin accessibility in LTBR T-cells.
a) Principal component (PC) analysis of global accessible chromatin regions of LTBR and tNGFR T-cells, either resting or stimulated with CD3/CD28 for 24 hours. b) Differentially accessible chromatin regions between stimulated and resting tNGFR, stimulated and resting LTBR, resting LTBR and resting tNGFR, and stimulated LTBR and stimulated tNGFR. Numbers of peaks gained/lost are shown (using absolute log2 fold change of 1 and adjusted p value < 0.1 as cut-off). c, d) Changes in chromatin accessibility (c) for differentially expressed (adjusted p<0.05) genes or in gene expression (d) for differentially accessible (adjusted p<0.05) regions. Two-sided t-test p values are shown. Box shows 25-75 percentile with a line at the median while whiskers extend to 1.5x interquartile range. N = 614 genes (c) or genomic regions (d). e, f) Chromatin accessibility profiles at loci more (e) or less open (f) in LTBR compared to tNGFR cells, resting or stimulated for 24 hours. The y-axis represents normalised reads (scale: 0-860 for BATF3, 0-1950 for IL13, 0-1230 for TRAF1, 0-1000 for TNFSF4, 0-300 for PDCD1, 0-2350 for LAG3). g) Chromatin accessibility in resting or stimulated LTBR and tNGFR cells. Each row represents a peak significantly enriched in LTBR over matched tNGFR control (log2 fold change > 1, DESeq2 adjusted p value < 0.05). Peaks were clustered using k-means clustering and selected genes at/near peaks from each cluster are indicated. h) Correlations for each ATAC sample (biological replicate) based on the bias-corrected deviations. i) Top transcription factor (TF) motifs enriched in the differentially accessible chromatin regions in resting LTBR cells compared to resting tNGFR cells.
Extended Data Figure 8.
Extended Data Figure 8.. Proteomic and functional genomic assays of NF-κB activation.
a) Phospho-RelA staining by intracellular flow cytometry in LTBR and tNGFR cells. Gating for identification of phospho-RelA+ cells is shown. b, c) Western blot quantification of key proteins in the NF-κB pathway in LTBR and tNGFR cells, resting or stimulated with CD3/CD28 for 15 min. Representative gels (b) or quantification of band intensity relative to GAPHD (c) are shown (n = 3 biological replicates). Unpaired two-sided t test p values are shown. d) Representation of the LTBR signalling pathway. Each gene is coloured based on the differential expression in LTBR over matched tNGFR cells (CD4+ and CD8+ T-cells, resting or stimulated for 24 hours). e-g) Simultaneous gene knockout via CRISPR and ORF overexpression. T-cells were transduced with a lentiviral vector co-expressing a single guide RNA (sgRNA) and the LTBR ORF. After transduction, Cas9 protein was delivered via nucleofection. f) Representative expression of target genes in LTBR cells co-expressing an sgRNA targeting B2M, an essential component of the MHC-I complex, or TRBC1/2, an essential component of the αβ TCR. g) Quantification of IFNγ after restimulation (n = 3 sgRNAs). h-o) Representative protein-level based quantification of gene knockout efficiency. Representative histograms (h, j, l) and quantification of relative expression levels of LTA, LIGHT, and RELA (i, k, m) are shown (n = 3 sgRNAs). Dashed lines represent gates used to enumerate cells expressing a given protein. Representative gel (n) and quantification of RELB expression (o) are shown (n = 3 sgRNAs for RELB and 2 non-targeting control sgRNAs). p) Identification of 274 genes identified as enriched in both CD4+ and CD8+ T-cells transduced with LTBR over matched tNGFR controls (“core LTBR” genes). See Supplementary Figure 1 for uncropped gel images. Error bars indicate SEM.
Extended Data Figure 9.
Extended Data Figure 9.. Co-delivery of ORFs with CD19-targeting CARs.
a) Transduction efficiency of CAR+ORF lentiviral vectors or ORF alone (n = 4 biological replicates). b,c) CAR expression level as determined by staining with anti-mouse Fab F(ab’)2-Representative histograms (b) and quantification of CAR expression relative to tNGFR (c) is shown for two healthy donors and two diffuse large B-cell lymphoma (DLBCL) patients, d) Expansion curves of CAR+ORF transduced T-cells (n = 4 biological replicates). e) LTBR expression in autologous CD14+ monocytes and T-cells transduced with LTBR alone or CAR+LTBR. f-i) Expression of ICAM-1 (f), CD70 (g), CD74 (h) and MHC-II (i) by T-cells transduced with LTBR ORF only, CAR+LTBR or CAR+tNGFR. All data are normalised to tNGFR only (no CAR). Unpaired two-sided t test p values are shown. j-m) Expression of exhaustion markers PD-1 (j), TIM-3 (k), LAG-3 (l) and CD39 (m) in CAR+ORF T-cells. n) Differentiation phenotype of CAR+ORF T-cells. CM: Central memory. EM: Effector memory. Differentiation was defined based on CD45RO and CCR7 expression (naïve: CD45ROneg CCR7+, CM: CD45RO+ CCR7+, EM: CD45RO+ CCR7neg, effector CD45ROneg CCR7neg). o,p) Expression of activation markers CD25 (o) and CD69 (p) in CAR+ORF T-cells incubated alone or with Nalm6 cells for 24 hours. Error bars indicate SEM. N = 3 biological replicates, unless indicated otherwise.
Extended Data Figure 10.
Extended Data Figure 10.. Top-ranked genes from the ORF screen boost antigen-specific T cell responses.
a,b) Co-delivery of anti-CD19 CARs and ORFs to T-cells from healthy donors. (a) IFNγ and (h) IL2 secretion after overnight co-incubation of CD4+ T-cells with Nalm6 cells at 1:1 ratio (n = 3 biological replicates, representative of two donors). c,d) IFNγ (c) or IL-2 (d) secretion by CAR+ORF or ORF only T-cells co-incubated for 24 hours either alone or with Nalm6 cells. e) Cytotoxicity of 19-BBz CAR T cells expressing tNGFR or LTBR ORF after co-incubation with Nalm6 GFP cells. f) Quantification of Nalm6 clearance (relative to Nalm6 co-incubated with untransduced T-cells) for CAR+ORF or ORF alone T-cells at different effector:target ratios. Unpaired two-sided t-test p values: 0.011, 1.3x10⁻⁴, 0.072, 0.02, 0.021, 0.52, 0.087, 1, 0.51 (left to right). g) Representative images of T cells transduced with 19-28z CAR and NGFR or LTBR, co-incubated with CD19+ Nalm6 GFP cells for 48 hours at 1:1 ratio. Scale bar: 200 μm. h-j) Repeated stimulation of CAR+ORF T-cells with Nalm6 cells. IL-2 secretion (i), or Nalm6 survival (j), by 19-BBz CAR LTBR or tNGFR T-cells re-challenged with Nalm6 after repeated stimulation with Nalm6 cells every three days, for up to three rounds of stimulation. k) Secretion of cytokines IL2 and IFNγ by CAR/LTBR or CAR/tNGFR T-cells from two DLBCL patients after overnight incubation with Nalm6 target cells. Two-sided paired t-test p value is shown. l) Representative staining of ORF-transduced T cells endogenously expressing Vγ9Vδ2 TCR. m) Quantification of ORF-transduced T cells expressing Vγ9Vδ2 TCR. n,o) IL2 (n) or IFNγ (o) secretion after 24 hours co-incubation of ORF transduced Vγ9Vδ2 T cells with leukaemia cell lines. p) IL2 or IFNγ secretion after 24 hours co-incubation of ORF transduced Vγ9Vδ2 T cells with BxPC3, a pancreatic ductal adenocarcinoma cell line. Cell lines in panels n-p were pre-treated with zoledronic acid prior to co-incubation. Error bars indicate SEM. N = 3 biological replicates are shown, unless indicated otherwise.
Figure 1.
Figure 1.. A genome-scale overexpression screen to identify genes that boost proliferation of primary human T-cells.
(a) Overview of the pooled open reading frame (ORF) screen. CD4+ and CD8+ T-cells were separately isolated from peripheral blood from three healthy donors. Barcoded genome-scale ORF library was then introduced into CD3/CD28-stimulated T-cells, followed by selection of transduced cells. After 14 days of culture, T-cells were labelled with carboxyfluorescein succinimidyl ester (CFSE) and re-stimulated to induce proliferation. By comparing counts of specific ORF barcodes before and after cell sorting, we identified ORFs enriched in the CFSElow population. (b) Normalised enrichment of individual barcodes for indicated genes in the CD4+ screen. (c) Robust rank aggregation of genes in both CFSElow CD4+ and CD8+ T-cells based on consistent enrichment of individual barcodes for each gene. (d) Enrichment in individual donors and T-cell populations of top-ranked genes (grouped by function and relevance to T-cell proliferation) selected for further study. Neutral genes (MHC-I complex and cell-type specific differentiation markers) are included for comparison. Gene names are coloured based on the differential expression in CD3/CD28-stimulated and resting T cells (green: up-regulated, red: down-regulated, grey: no change, black: no expression).
Figure 2.
Figure 2.. Overexpression of top-ranked ORFs increases proliferation, activation, and cytokine secretion of CD4+ and CD8+ T-cells.
(a) CD4+ and CD8+ T-cells from screen-independent donors were separately isolated and then transduced with lentiviruses encoding top-ranked ORFs together with a selection marker. Following transduction and selection, T-cells were re-stimulated before measurement of proliferation, expression of activation markers, and cytokine secretion. (b) Proliferation of T-cells transduced with top-ranked genes as fold change in absolute cell numbers of stimulated cells versus the corresponding unstimulated control, normalised to tNGFR. A minimum of two donors was tested per overexpressed gene, in biological triplicate. Box shows 25-75 percentile with a line at the mean while whiskers extend to maximum and minimum values. (c) Mean proliferation of ORF-transduced T-cells in CD4+ and CD8+ T-cells, normalised to tNGFR. Significant genes in both or either T-cell subsets are marked (Student’s two-sided t test p < 0.05 and false discovery rate < 0.1). (d) Representative expression of CD25 or CD154 following re-stimulation. The numbers on histograms correspond to the percentage of gated cells (CD8+ CD154+) or the mean fluorescence intensity (MFI). Dashed lines indicate the gate used to enumerate CD154+ cells (CD8+) or MFI for control (tNGFR) cells. (e) IL-2 and IFNγ secretion after re-stimulation, normalised to tNGFR. Only genes that significant increase T-cell proliferation in CD4+, CD8+ or both T-cell subsets are shown. A minimum of two donors was tested in triplicate per gene. Box shows 25-75 percentile with a line at the mean while whiskers extend to maximum and minimum values. (f) Intersection between different T-cell activation phenotypes significantly (p < 0.05) improved by a given ORF in CD8+ or CD4+ T-cells. Mean log2 fold change, two-sided t test p value and false-discovery rate for each ORF and phenotype are shown in Supplementary Table 6.
Figure 3.
Figure 3.. Single-cell OverCITE-seq identifies shared and distinct transcriptional programs induced by gene overexpression in T-cells.
(a) OverCITE-seq captures overexpression (ORF) constructs, transcriptomes, TCR clonotypes, cell-surface proteins, and treatment hashtags in single cells. (b) ORF assignment rate in resting and CD3/28-stimulated T-cells. (c) Antibody-tag sequencing (right) yields similar NGFR expression in tNGFR-transduced T-cells as flow cytometry (left) with tNGFR-transduced T-cells. Untransduced cells (left) or cells assigned a non-tNGFR ORF (right) are shown in grey. (d) UMAP representation of single cell transcriptomes after unsupervised clustering of OverCITE-seq captured ORF singlets. The inset in top left identifies stimulated and resting T-cells as given by treatment hashtags. For each cluster, a subset of the top 20 differentially expressed genes is shown. (e) ORF prevalence in two representative clusters. Standardised residual values are from a chi-squared test. ORFs of interest are shown.
Figure 4.
Figure 4.. LTBR overexpression improves T-cell function via canonical NF-κB activation.
(a) Differential expression of genes in resting LTBR and tNGFR (negative control) T-cells. Genes highlighted in red are those with a 2-fold or greater change in expression and an adjusted p < 0.05. (b) Significantly enriched Gene Ontology biological processes in LTBR overexpressing T-cells (p < 0.05). (c) Cell viability of CD8+ T-cells transduced with LTBR or tNGFR lentivirus, either re-stimulated with CD3/CD28 for four days or left unstimulated (n = 2 donors with 3 biological replicates each). (d) PD-1 expression on resting LTBR or tNGFR T-cells stimulated with a 3:1 excess CD3/CD28 beads every 3 days, for up to 3 rounds of consecutive stimulation. (e) ICAM-1 expression (resting) and IL-2 secretion (activated) by T-cells transduced with FLAG-tagged LTBR mutants, normalised to wild-type LTBR (n = 6 replicates across two experiments). (f) Enrichment of transcription factor motifs in differentially accessible chromatin (top 10 motifs from each comparison). (g) Quantification of phospho-RelA in LTBR or tNGFR T-cells stimulated with CD3/CD28 antibodies for indicated periods of time. (h, i) Quantification of phosphorylated IκBα (h) or mature NF-κB2 (i) in resting or CD3/CD28-stimulated (15 minutes) LTBR or tNGFR cells. (j) IFNγ secretion by stimulated LTBR or tNGFR cells after CRISPR knockout of indicated genes (n = 18, 3 sgRNAs in 2 donors in 3 biological replicates). IFNγ quantities are normalised to corresponding non-targeting controls (either LTBR or tNGFR) to allow comparisons of relative impacts of gene knockout on T-cell activation. (k) Expression levels of core LTBR genes (n = 274 genes) in LTBR and tNGFR cells after CRISPR knockout of RELA or RELB (normalized to non-targeting controls). Box shows 25-75 percentile with a line at the median while whiskers extend to 1.5x of interquartile range. Unpaired two-sided t test p values (panels c, g-k): ns p>0.05, * p<0.05, ** p<0.01, *** p<0.001, **** p<0.0001 (exact p values are given in Supplementary Table 15). Error bars are SEM. N = 3 biological replicates, unless stated otherwise.
Figure 5.
Figure 5.. Top-ranked genes improve antigen-specific T-cell responses and tumour killing.
(a - f) Co-delivery of anti-CD19 CARs and ORFs to T-cells from healthy donors. (b) IFNγ and (c) IL2 secretion after overnight co-incubation of CD8+ T-cells with Nalm6 cells at 1:1 ratio (n = 3 biological replicates, representative of two donors). (d) Representative images of Nalm6 GFP+ cells co-incubated for 48 hours with CAR T-cells or untransduced control T-cells. Scale bar: 200 μm. (e) Nalm6 GFP+ cell proliferation (normalized total GFP per well) after co-incubation with T-cells co-expressing 19-28z CAR and LTBR or tNGFR (negative control) at the indicated effector to target ratios. (f) Quantification of Nalm6 GFP+ clearance for T-cells co-expressing 19-28z or 18-BBz CARs and top-ranked genes (n = 3 biological replicates, representative of two donors), normalised to tNGFR at effector to target ratio of 0.25 and after 48 hours of co-incubation. (g) 19-BBz CAR T-cells co-expressing LTBR or tNGFR were co-incubated at a 1:1 ratio with Nalm6 cells every three days for up to three rounds of stimulation (n = 3 biological replicates). Seven days after repeated antigen stimulation, CAR T-cells were re-exposed to Nalm6 cells. IFNγ secretion was measured after overnight incubation. h) Co-delivery of anti-CD19 CARs and ORFs to total PBMC from a diffuse large B-cell lymphoma patient. Transduced T-cells were incubated alone, or co-incubated with CD19+ Nalm6 or CD19− Jurkat cell lines at a 1:1 ratio (n = 3 biological replicates, representative of two patients). Secretion of IFNγ and IL2 was measured after overnight incubation and shown as fold increase of cytokine secretion by LTBR cells over tNGFR (negative control) cells. i) Delivery of ORFs to Vγ9Vδ2 T-cells. IFNγ and IL-2 secretion after overnight co-incubation with pancreatic ductal adenocarcinoma line Capan-2, pre-treated with zoledronate to boost phosphoantigen accumulation (n = 3 biological replicates). Data are presented as mean values +/− SEM as appropriate.

References

Extended Data References

    1. GTEx Consortium. The GTEx Consortium atlas of genetic regulatory effects across human tissues. Science 369, 1318–1330 (2020). - PMC - PubMed
    1. Ding J et al. Systematic comparative analysis of single cell RNA-sequencing methods. http://biorxiv.org/lookup/doi/10.1101/632216 (2019) doi:10.1101/632216. - DOI - DOI

References

    1. Abramson JS et al. Transcend NHL 001: Immunotherapy with the CD19-Directed CAR T-Cell Product JCAR017 Results in High Complete Response Rates in Relapsed or Refractory B-Cell Non-Hodgkin Lymphoma. Blood 128, 4192–4192 (2016).
    1. Shifrut E et al. Genome-wide CRISPR Screens in Primary Human T Cells Reveal Key Regulators of Immune Function. Cell 175, 1958–1971.e15 (2018). - PMC - PubMed
    1. Dong MB et al. Systematic Immunotherapy Target Discovery Using Genome-Scale In Vivo CRISPR Screens in CD8 T Cells. Cell 178, 1189–1204.e23 (2019). - PMC - PubMed
    1. Chen Z et al. In vivo CD8+ T cell CRISPR screening reveals control by Fli1 in infection and cancer. Cell 184, 1262–1280.e22 (2021). - PMC - PubMed
    1. Kabelitz D, Serrano R, Kouakanou L, Peters C & Kalyan S Cancer immunotherapy with γδ T cells: many paths ahead of us. Cell Mol Immunol 17, 925–939 (2020). - PMC - PubMed

Additional References

    1. Lissina A et al. Protein kinase inhibitors substantially improve the physical detection of T-cells with peptide-MHC tetramers. Journal of Immunological Methods 340, 11–24 (2009). - PMC - PubMed
    1. Meier JA, Zhang F & Sanjana NE GUIDES: sgRNA design for loss-of-function screens. Nature Methods 14, 831–832 (2017). - PMC - PubMed
    1. Liscovitch-Brauer N et al. Profiling the genetic determinants of chromatin accessibility with scalable single-cell CRISPR screens. Nat Biotechnol (2021) doi:10.1038/s41587-021-00902-x. - DOI - PMC - PubMed
    1. Dobin A et al. STAR: ultrafast universal RNA-seq aligner. Bioinformatics 29, 15–21 (2013). - PMC - PubMed
    1. Legut M et al. High-Throughput Screens of PAM-Flexible Cas9 Variants for Gene Knockout and Transcriptional Modulation. Cell Reports 30, 2859–2868.e5 (2020). - PMC - PubMed

Publication types