. 2022 Mar;603(7902):672-678.
doi: 10.1038/s41586-022-04502-w. Epub 2022 Mar 16.

Immune regulation by fungal strain diversity in inflammatory bowel disease

Affiliations

Immune regulation by fungal strain diversity in inflammatory bowel disease

Xin V Li et al. Nature. 2022 Mar.

Erratum in

Abstract

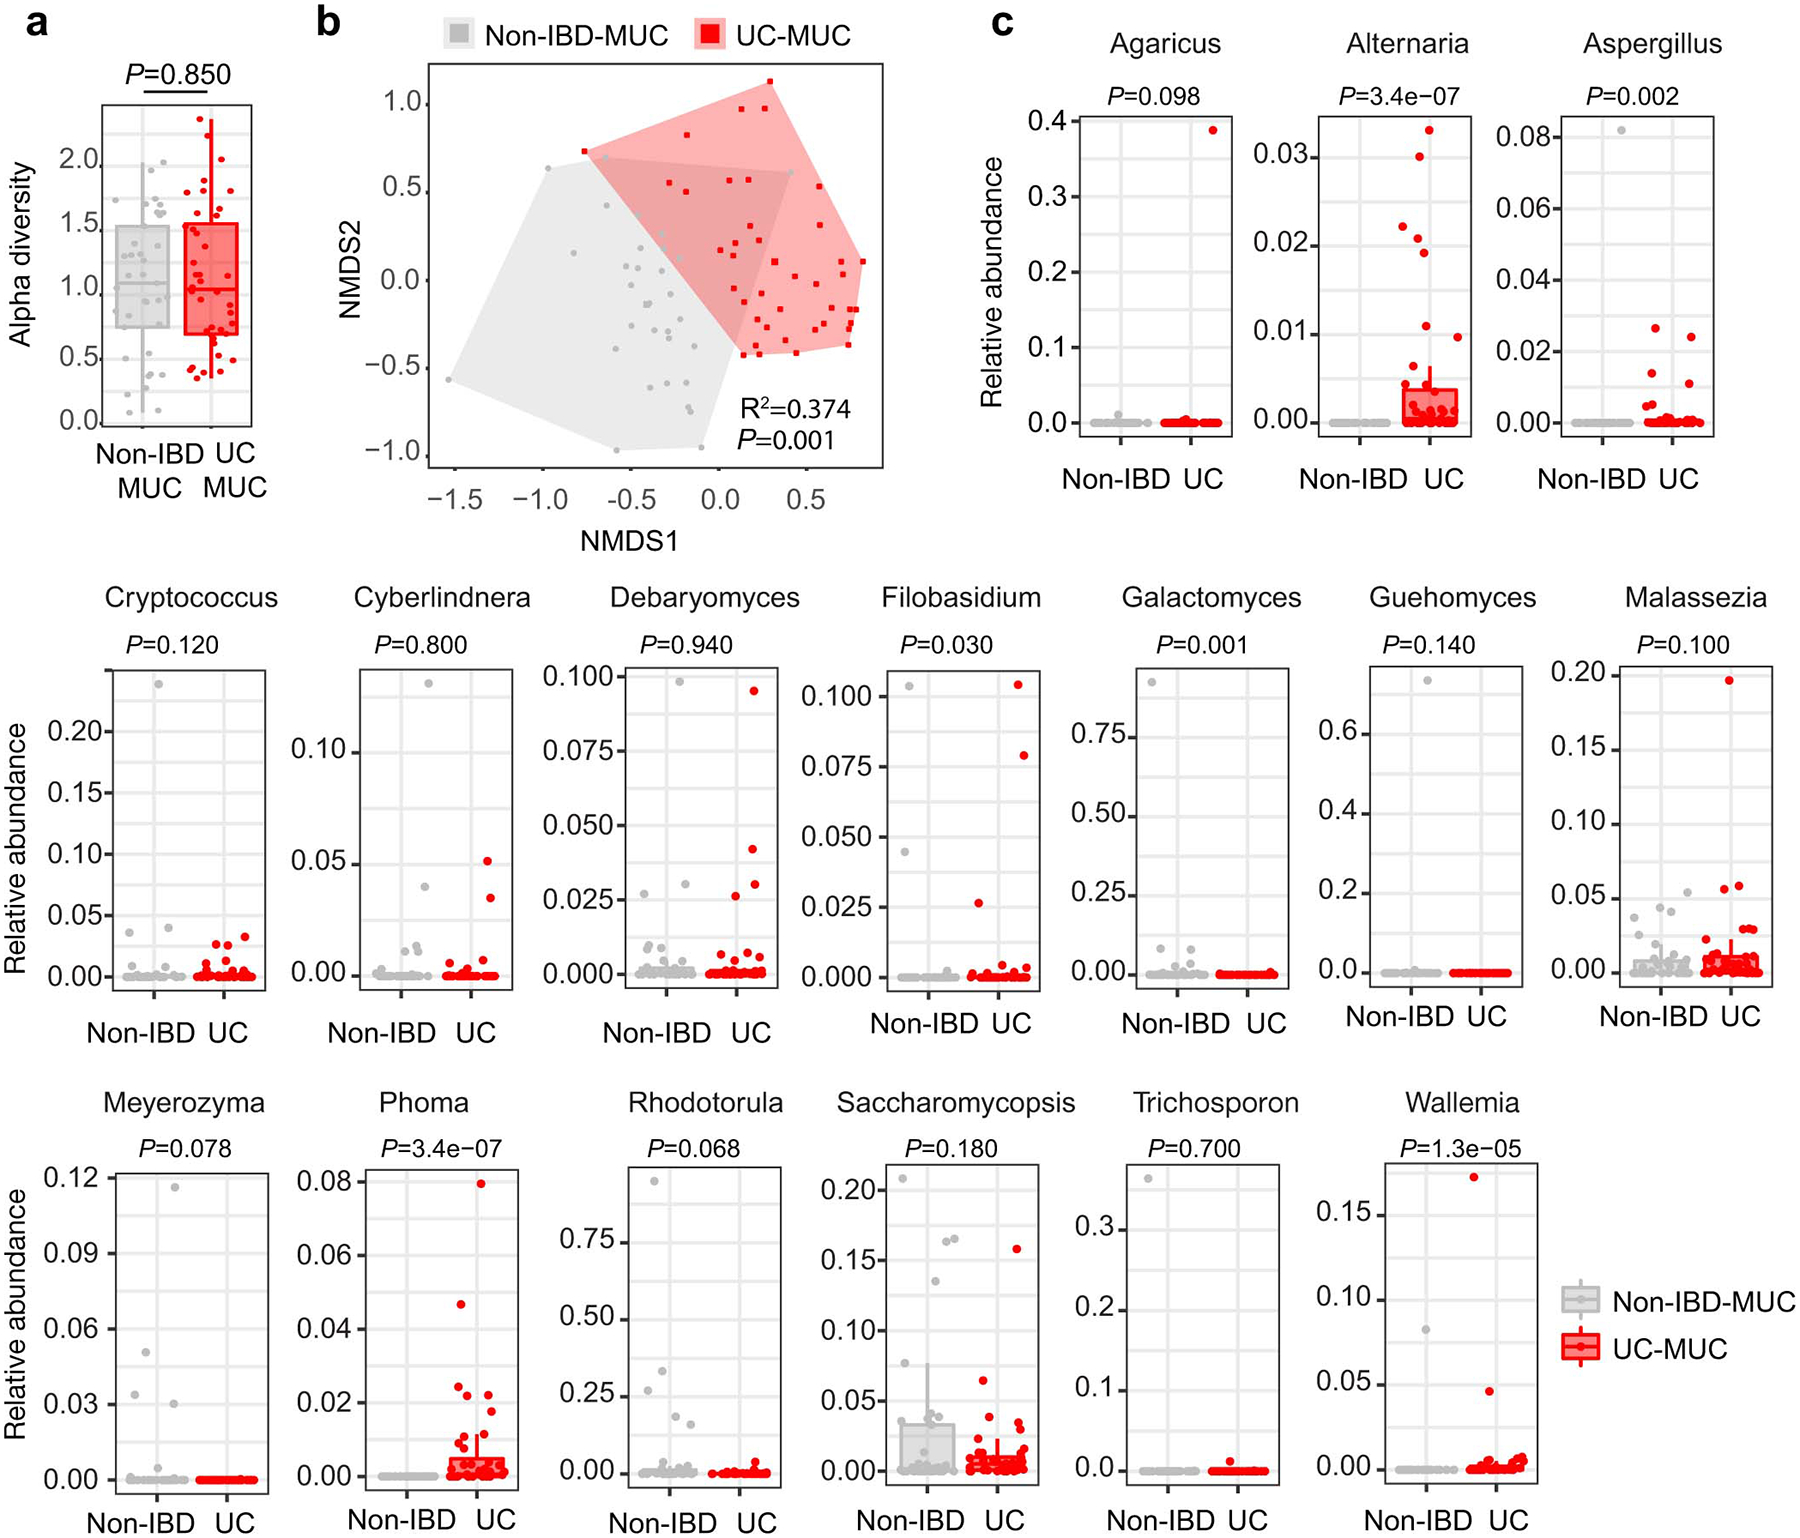
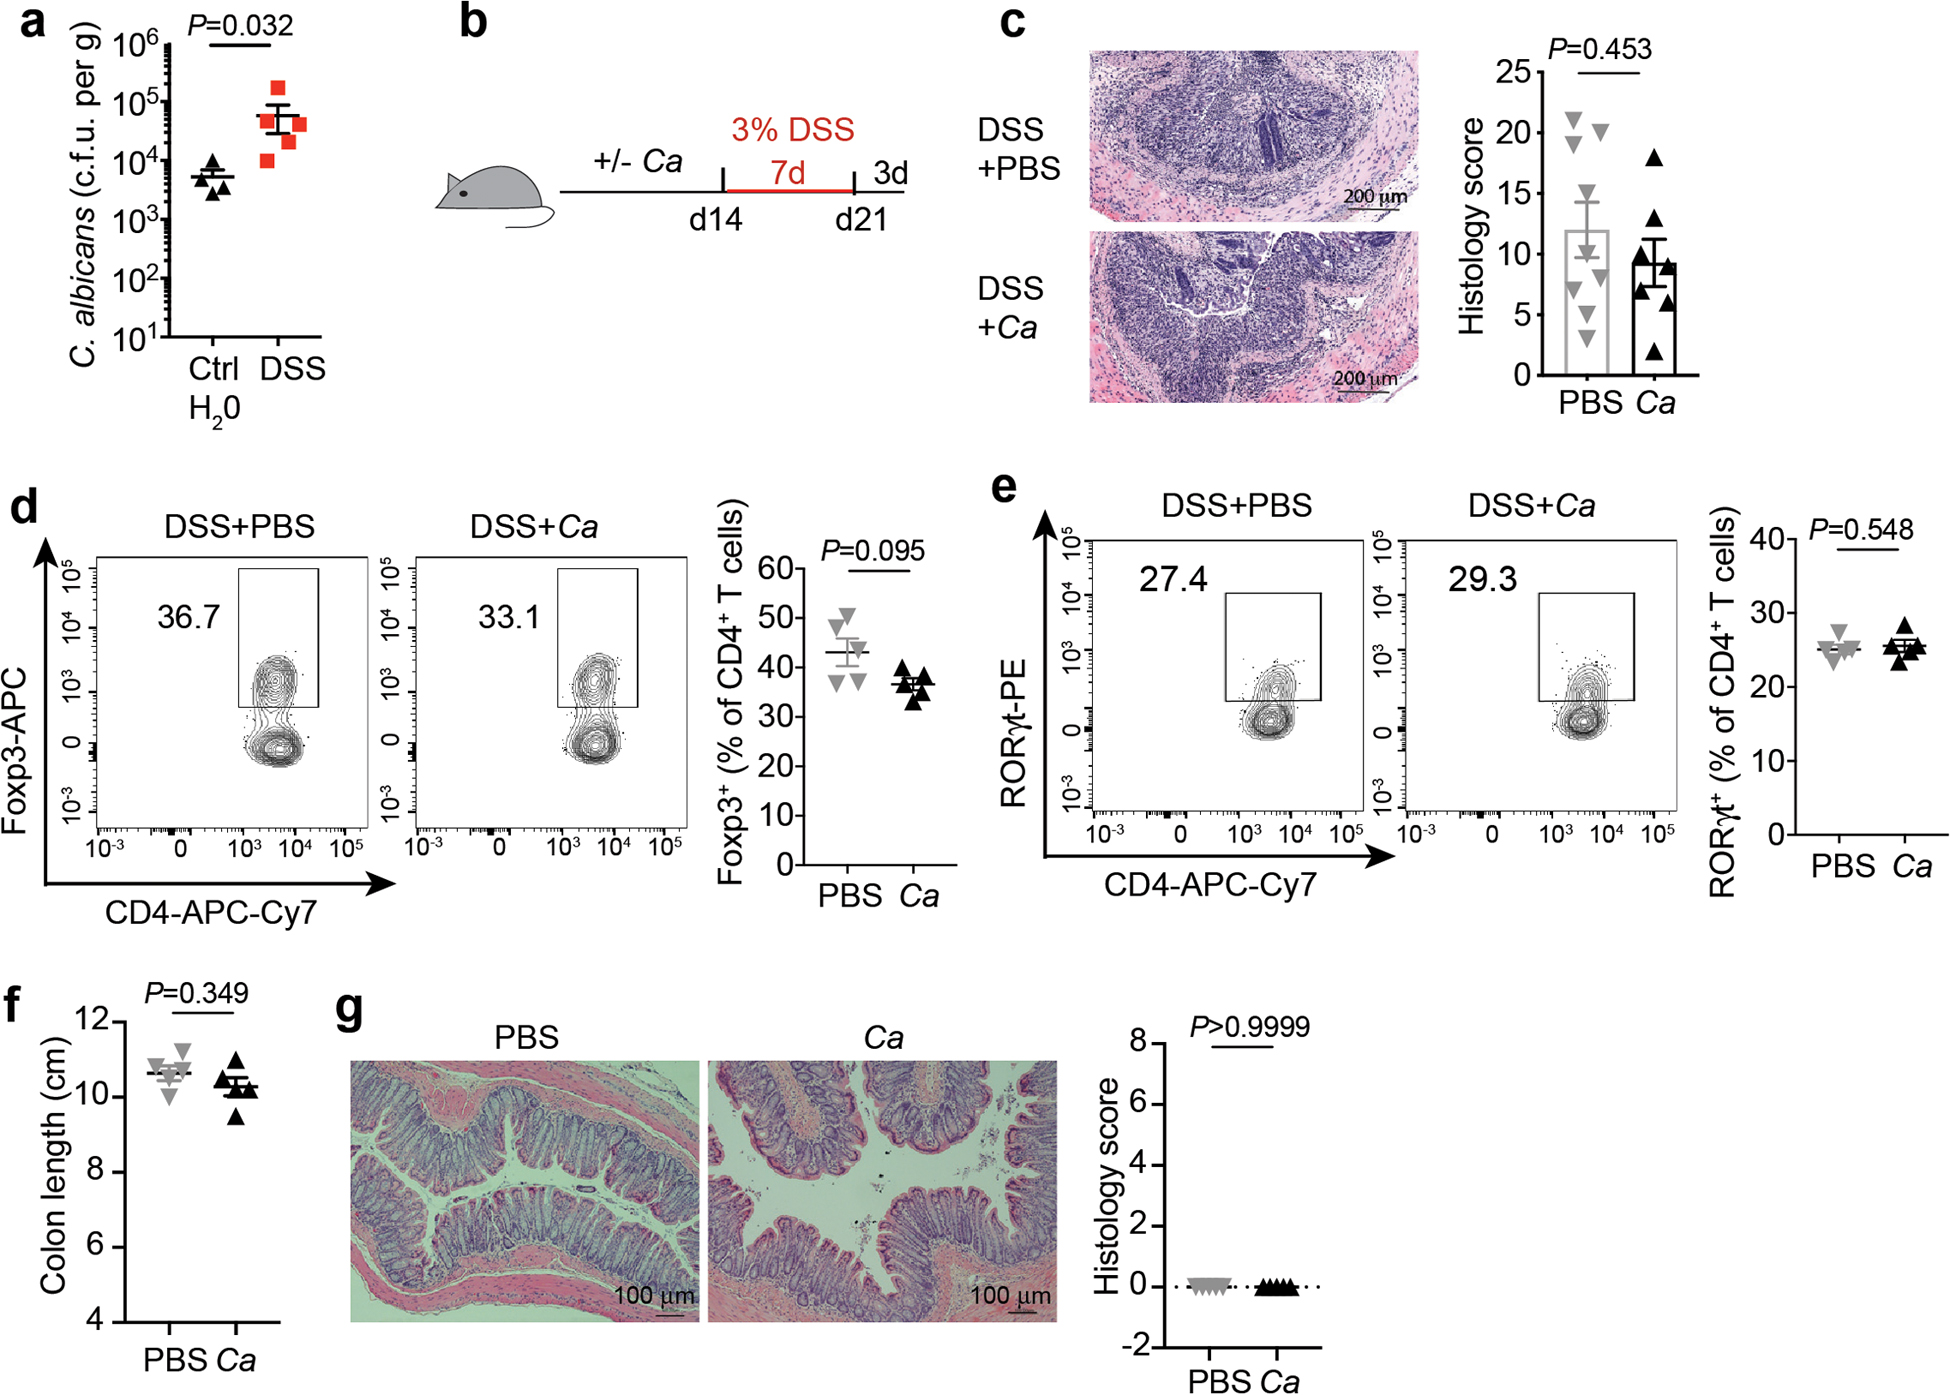
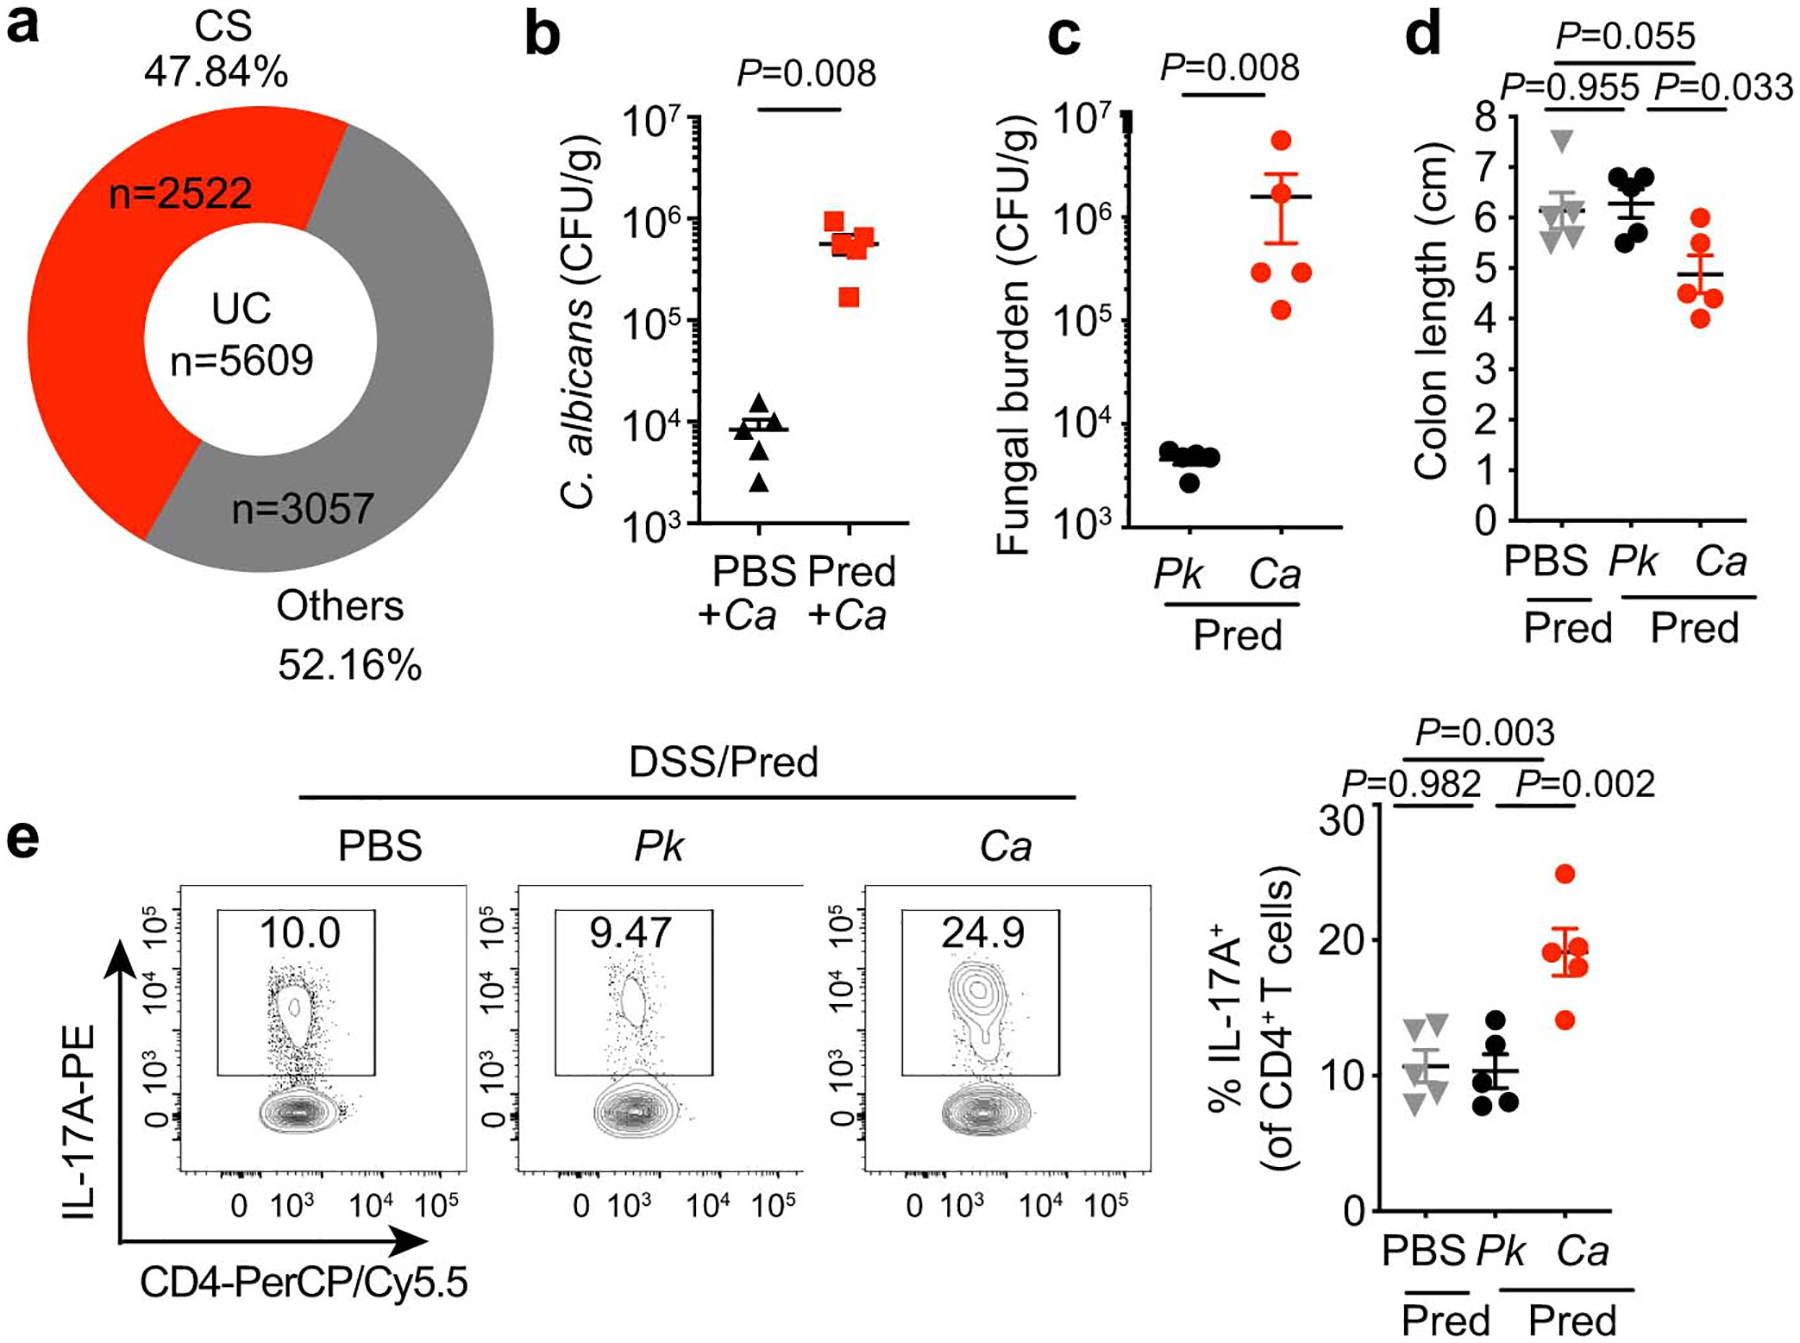
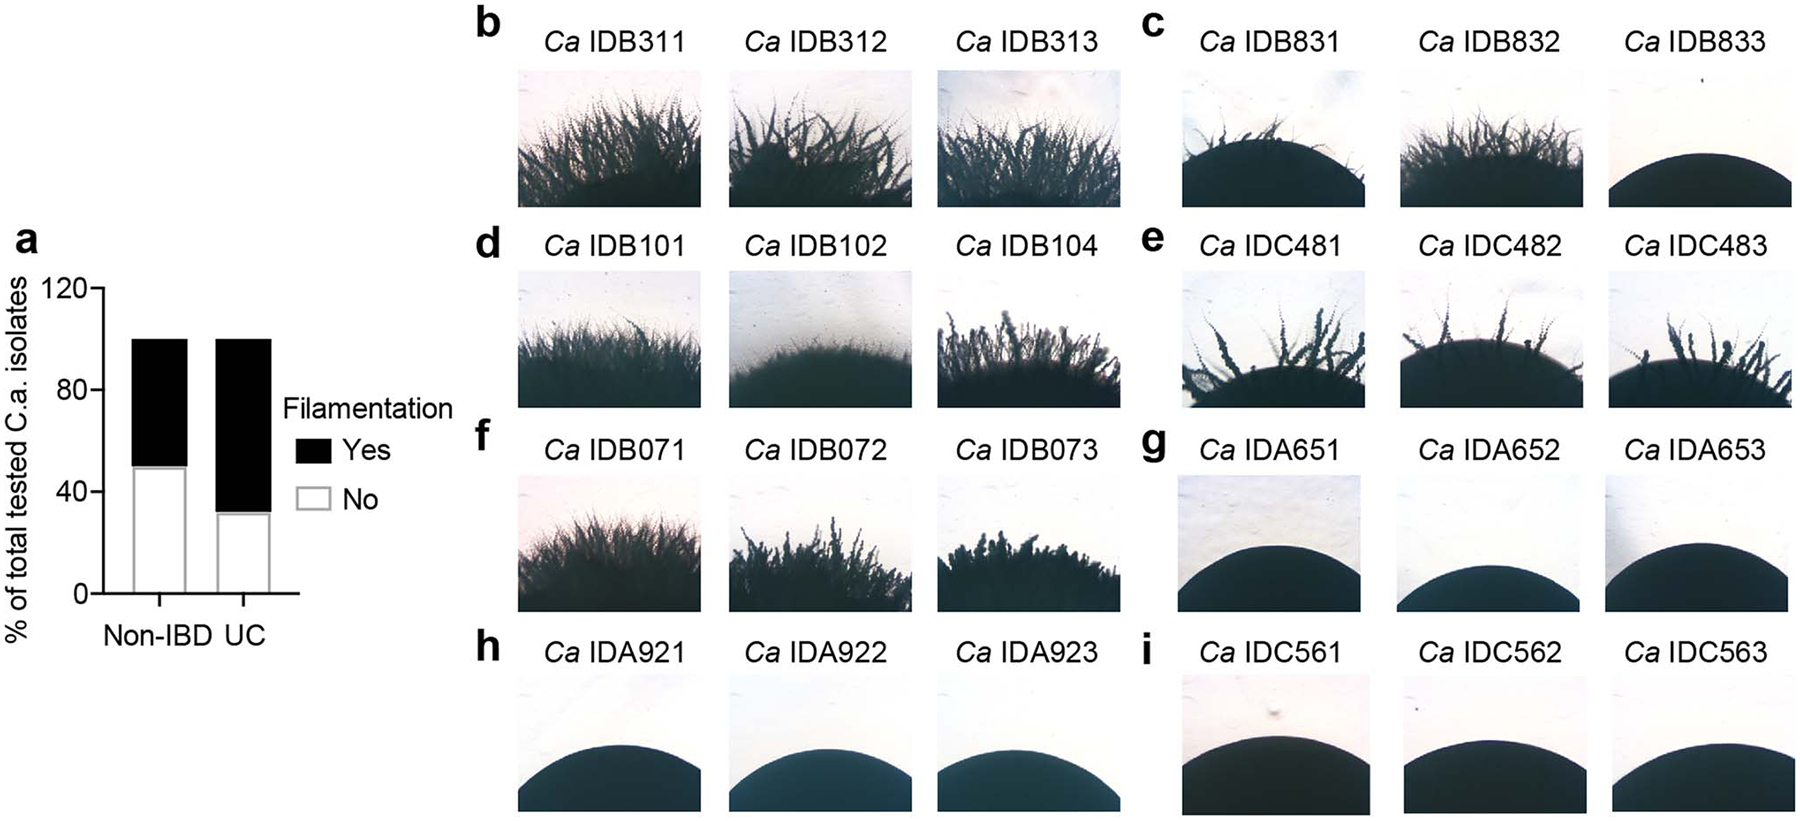
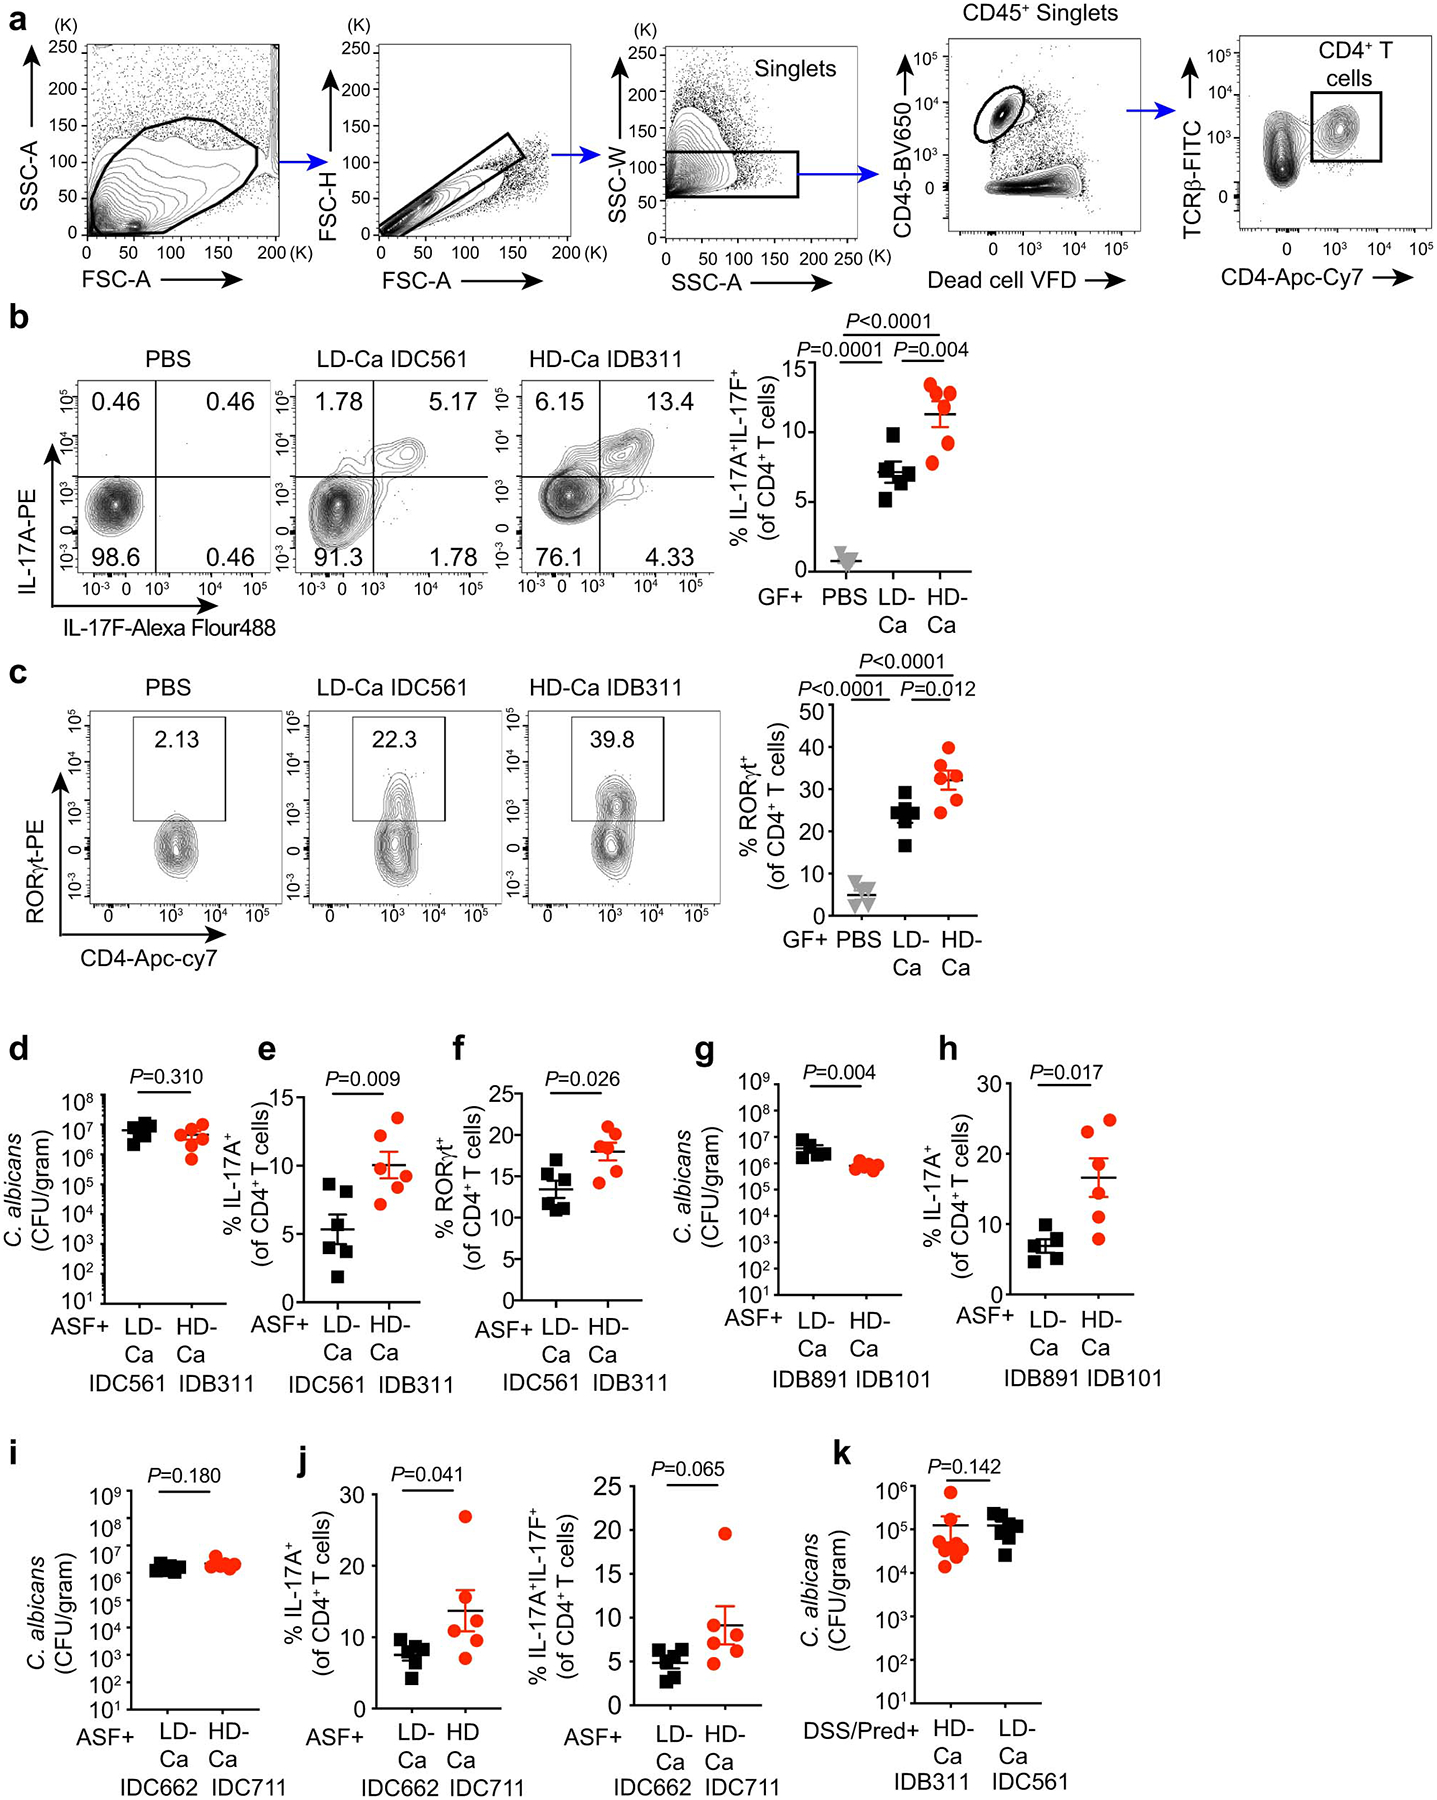
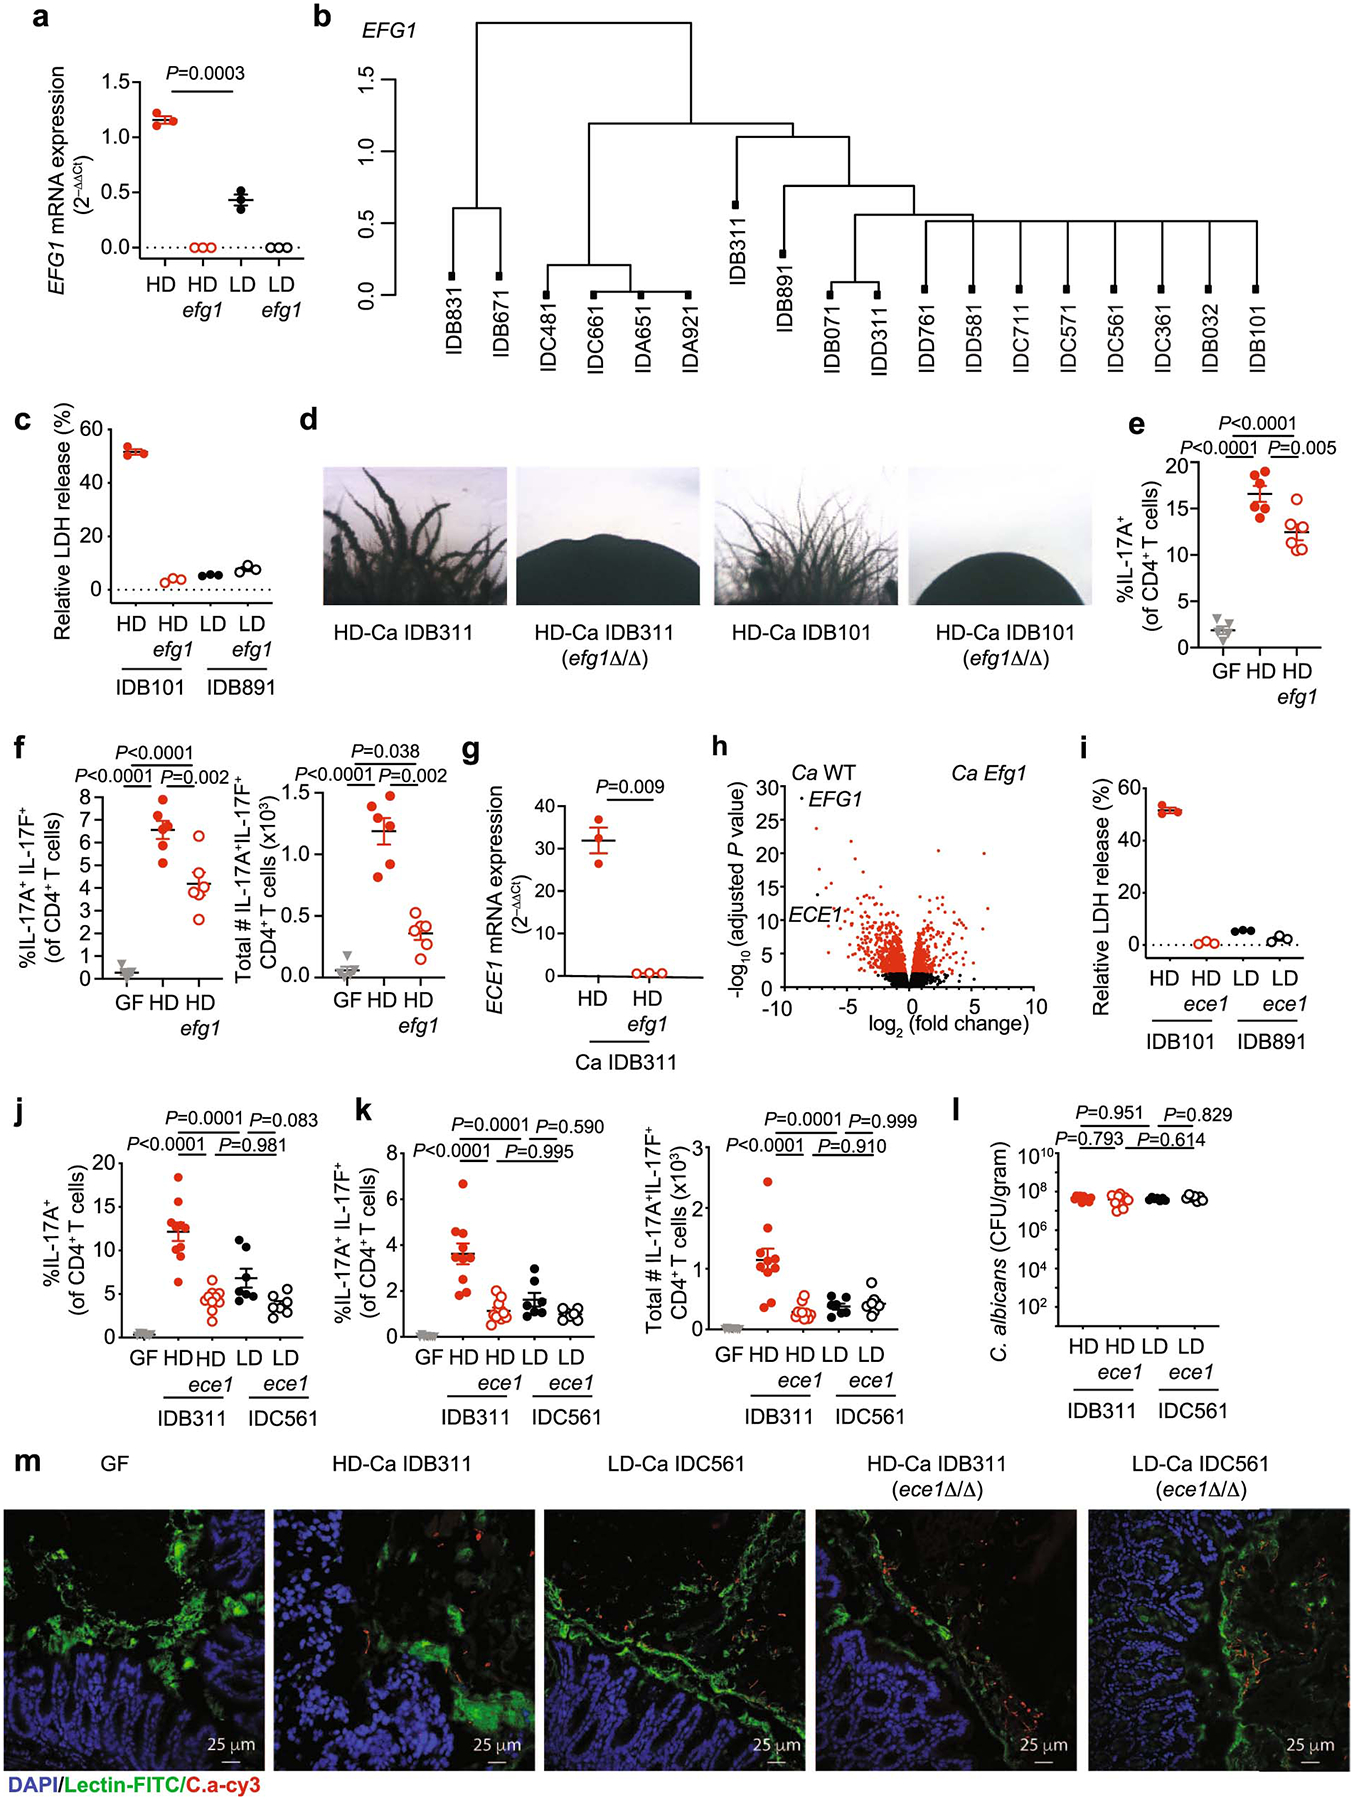
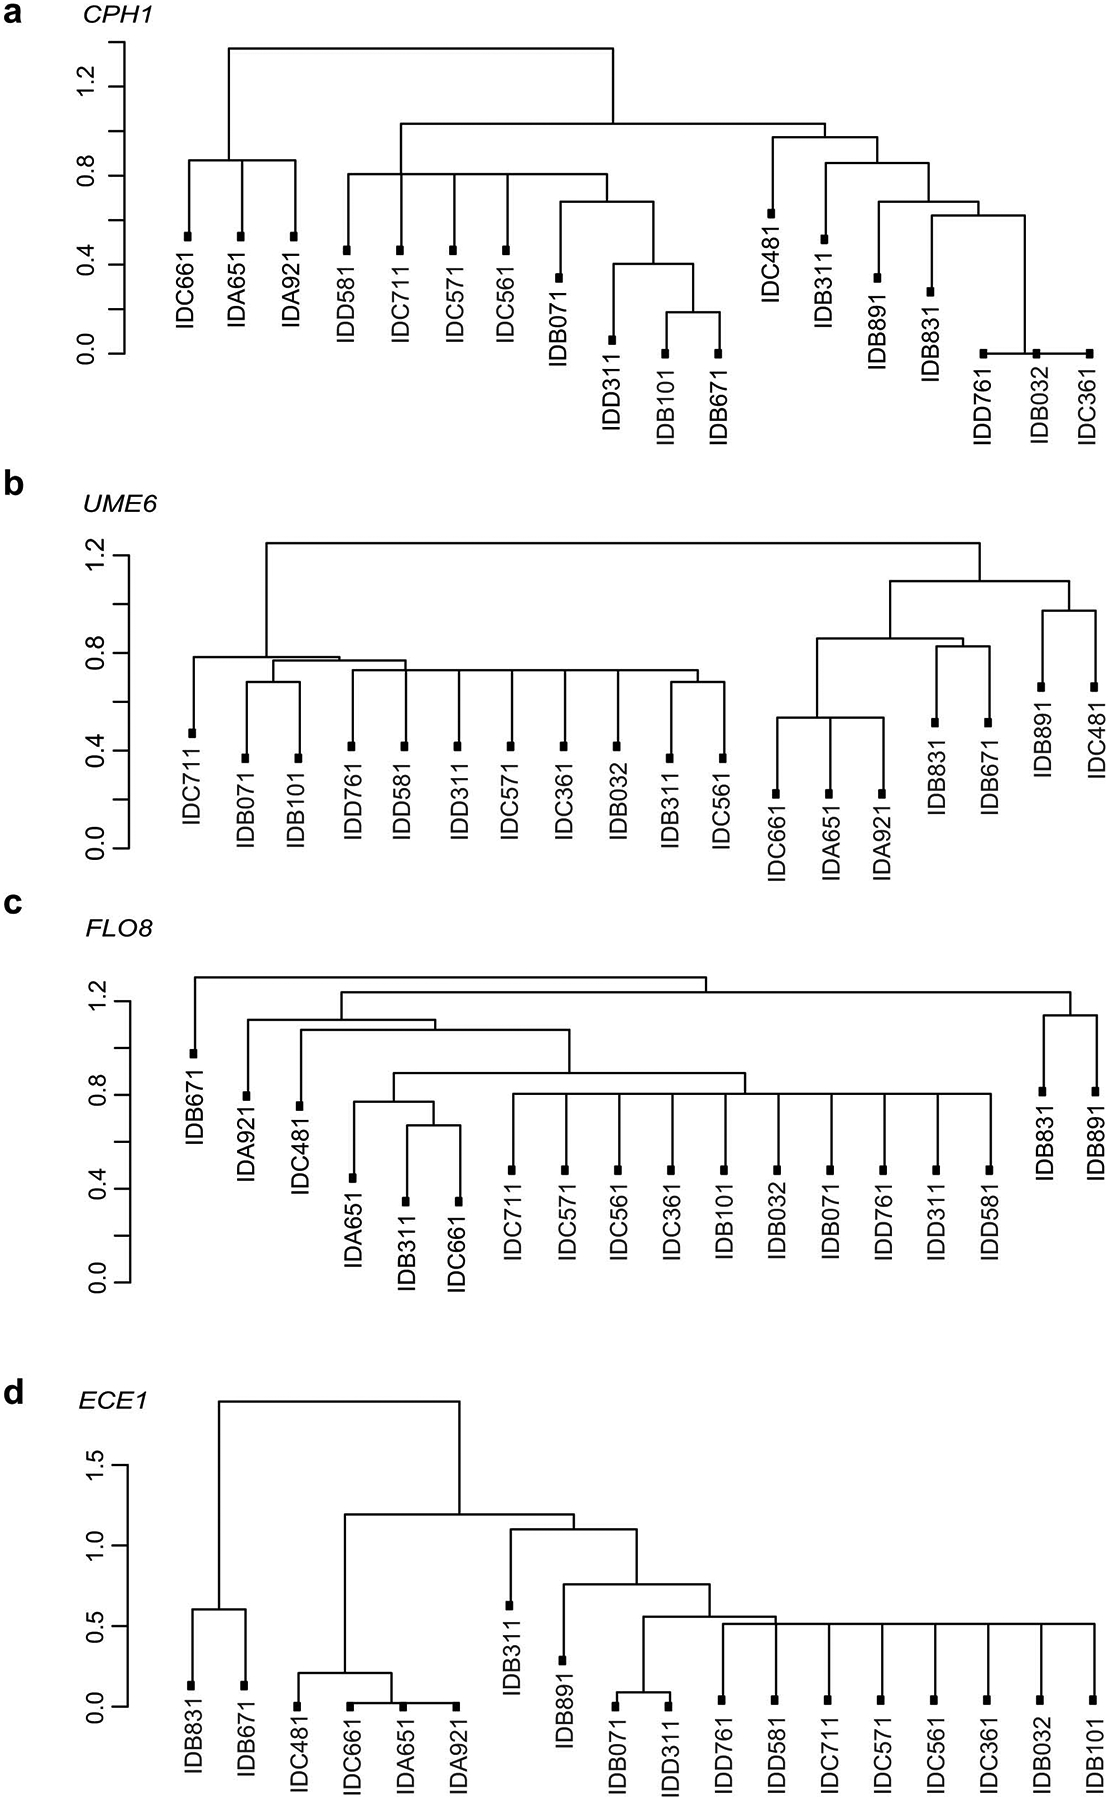
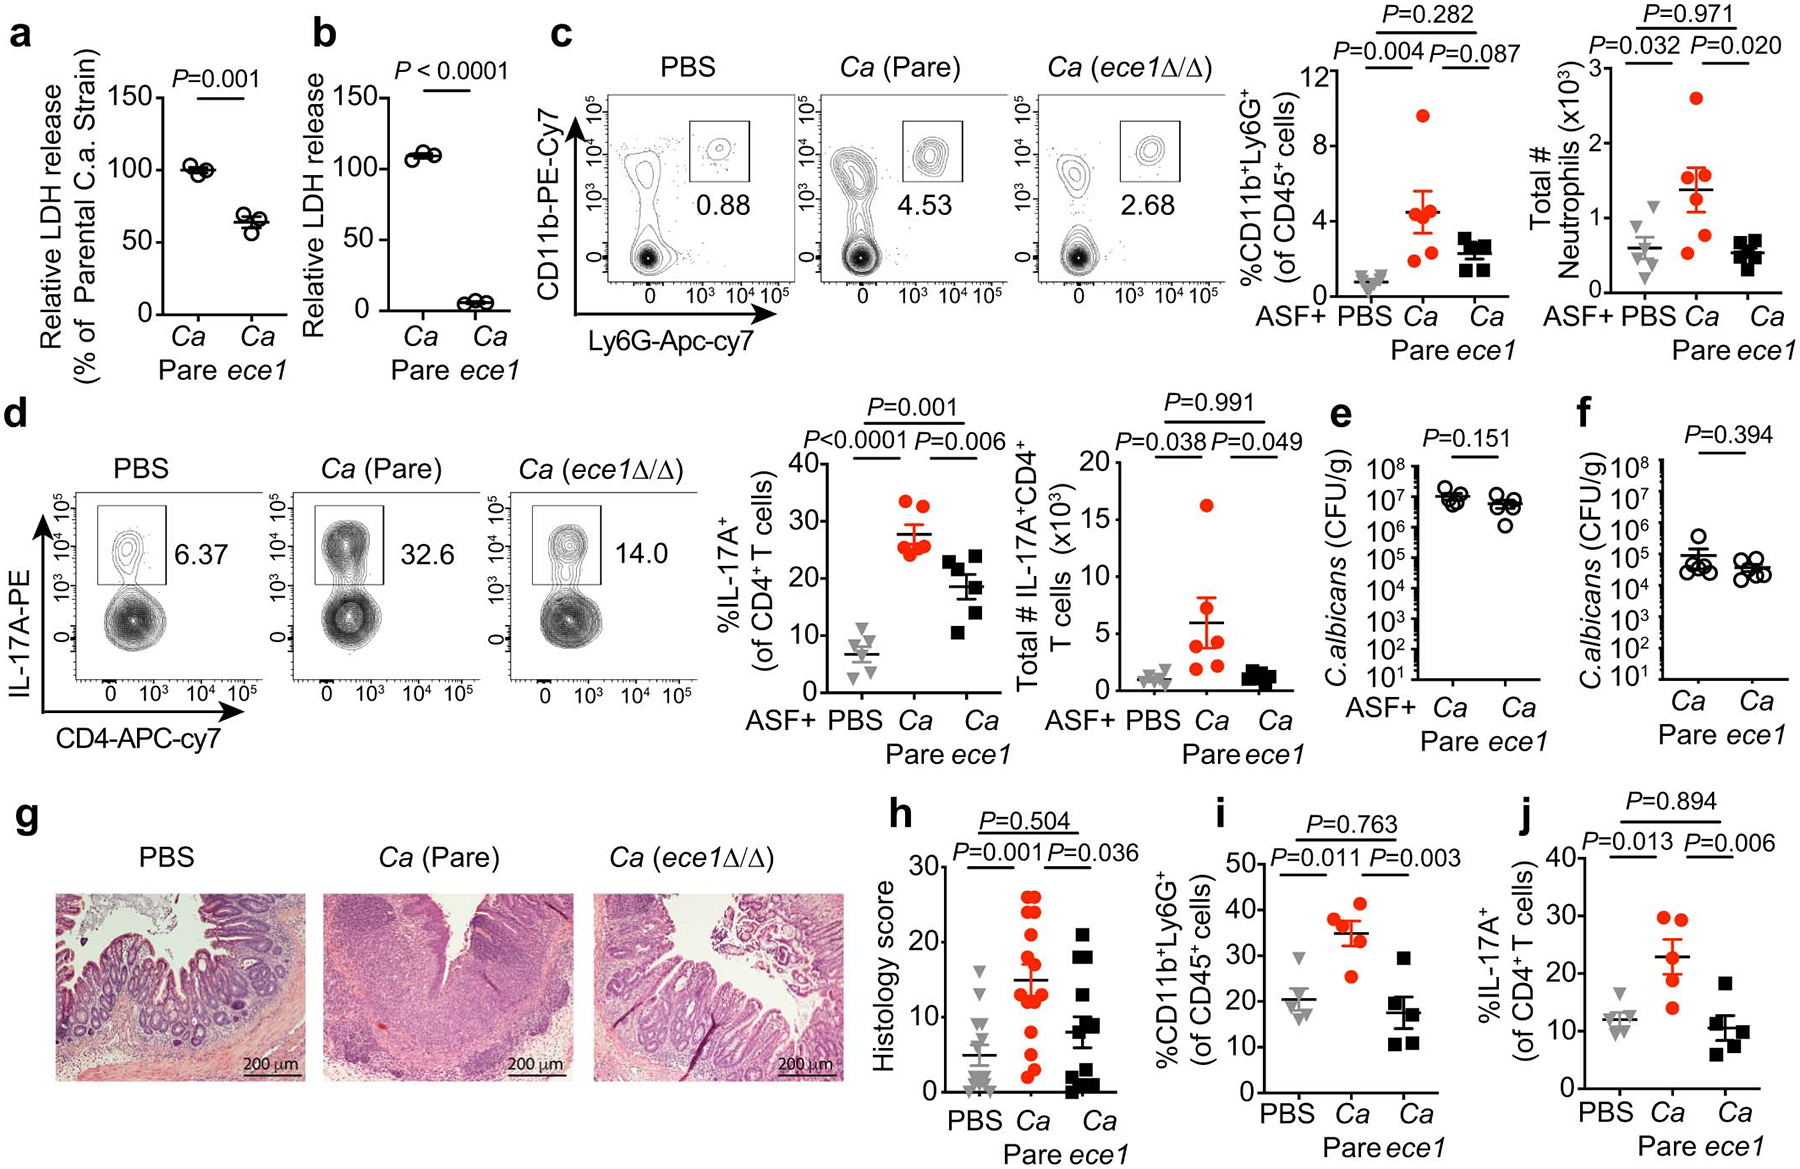
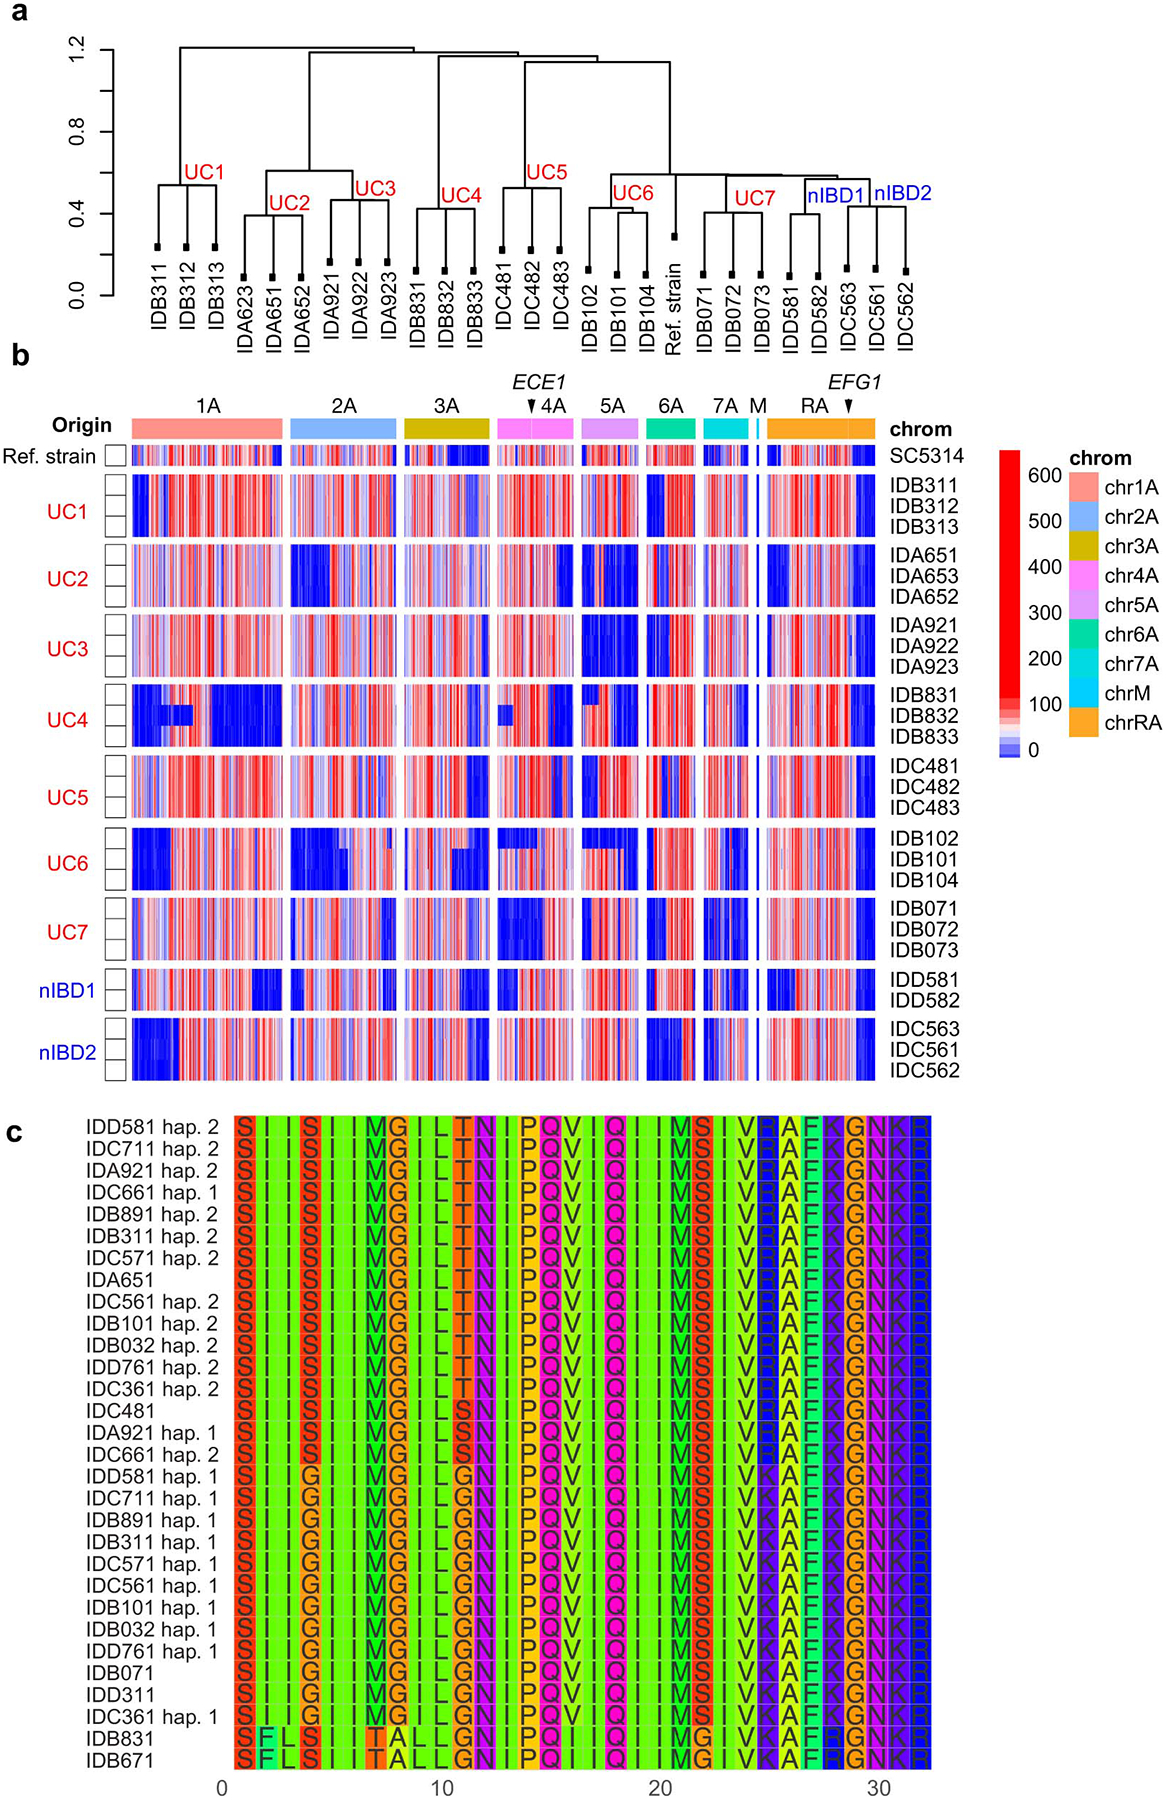
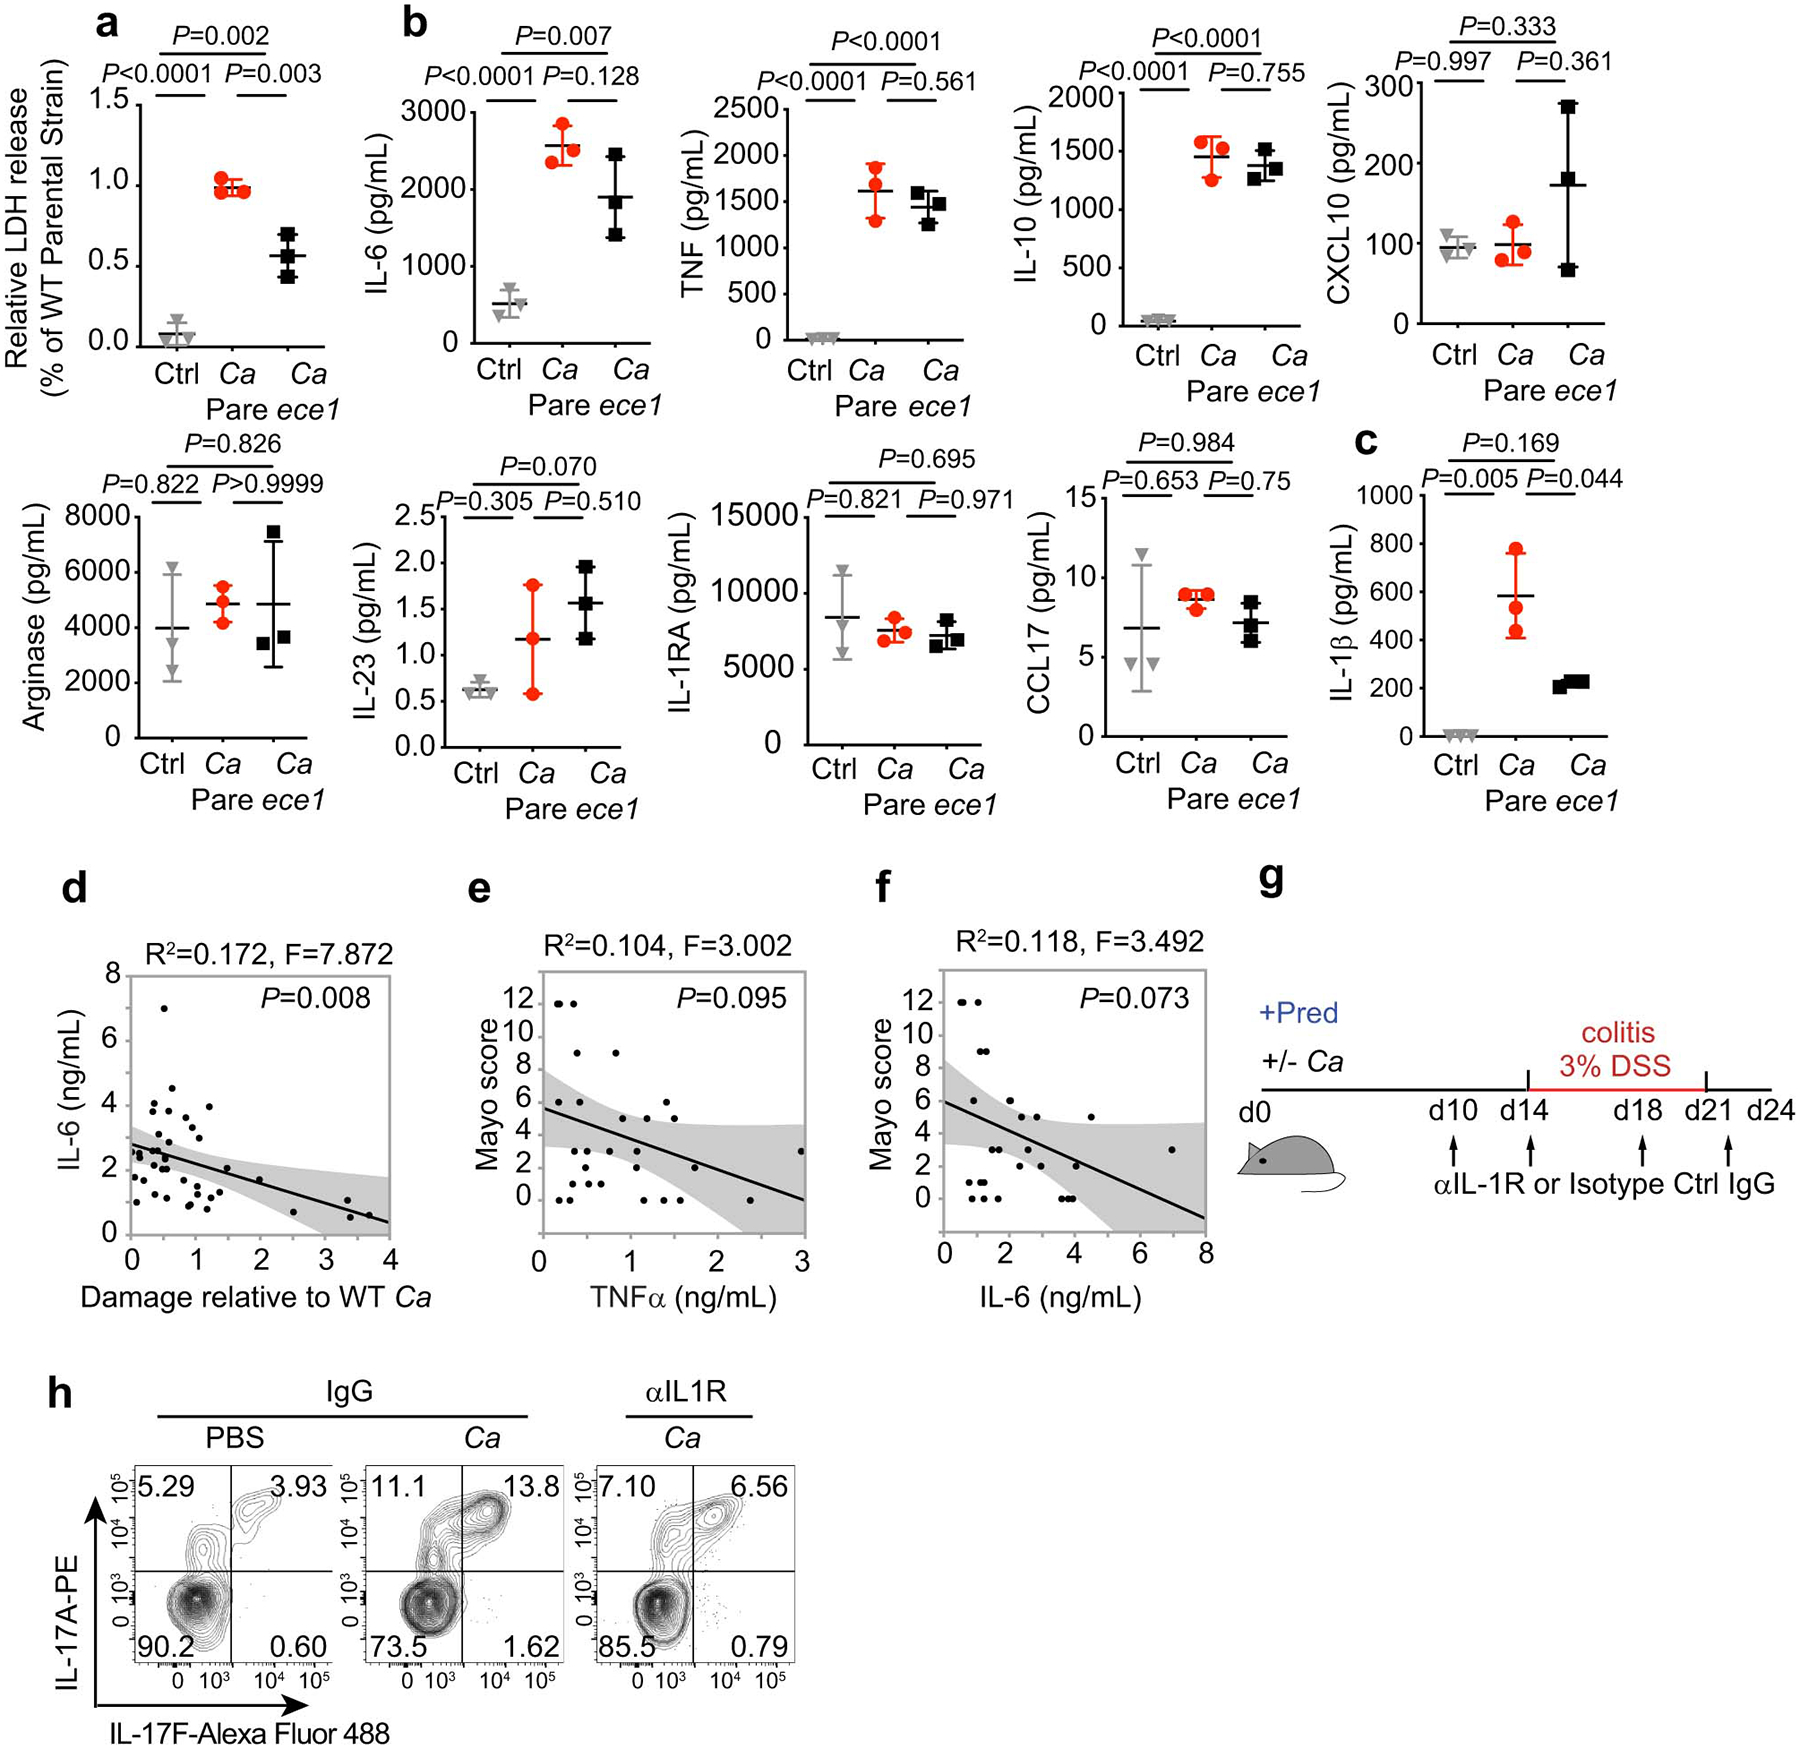
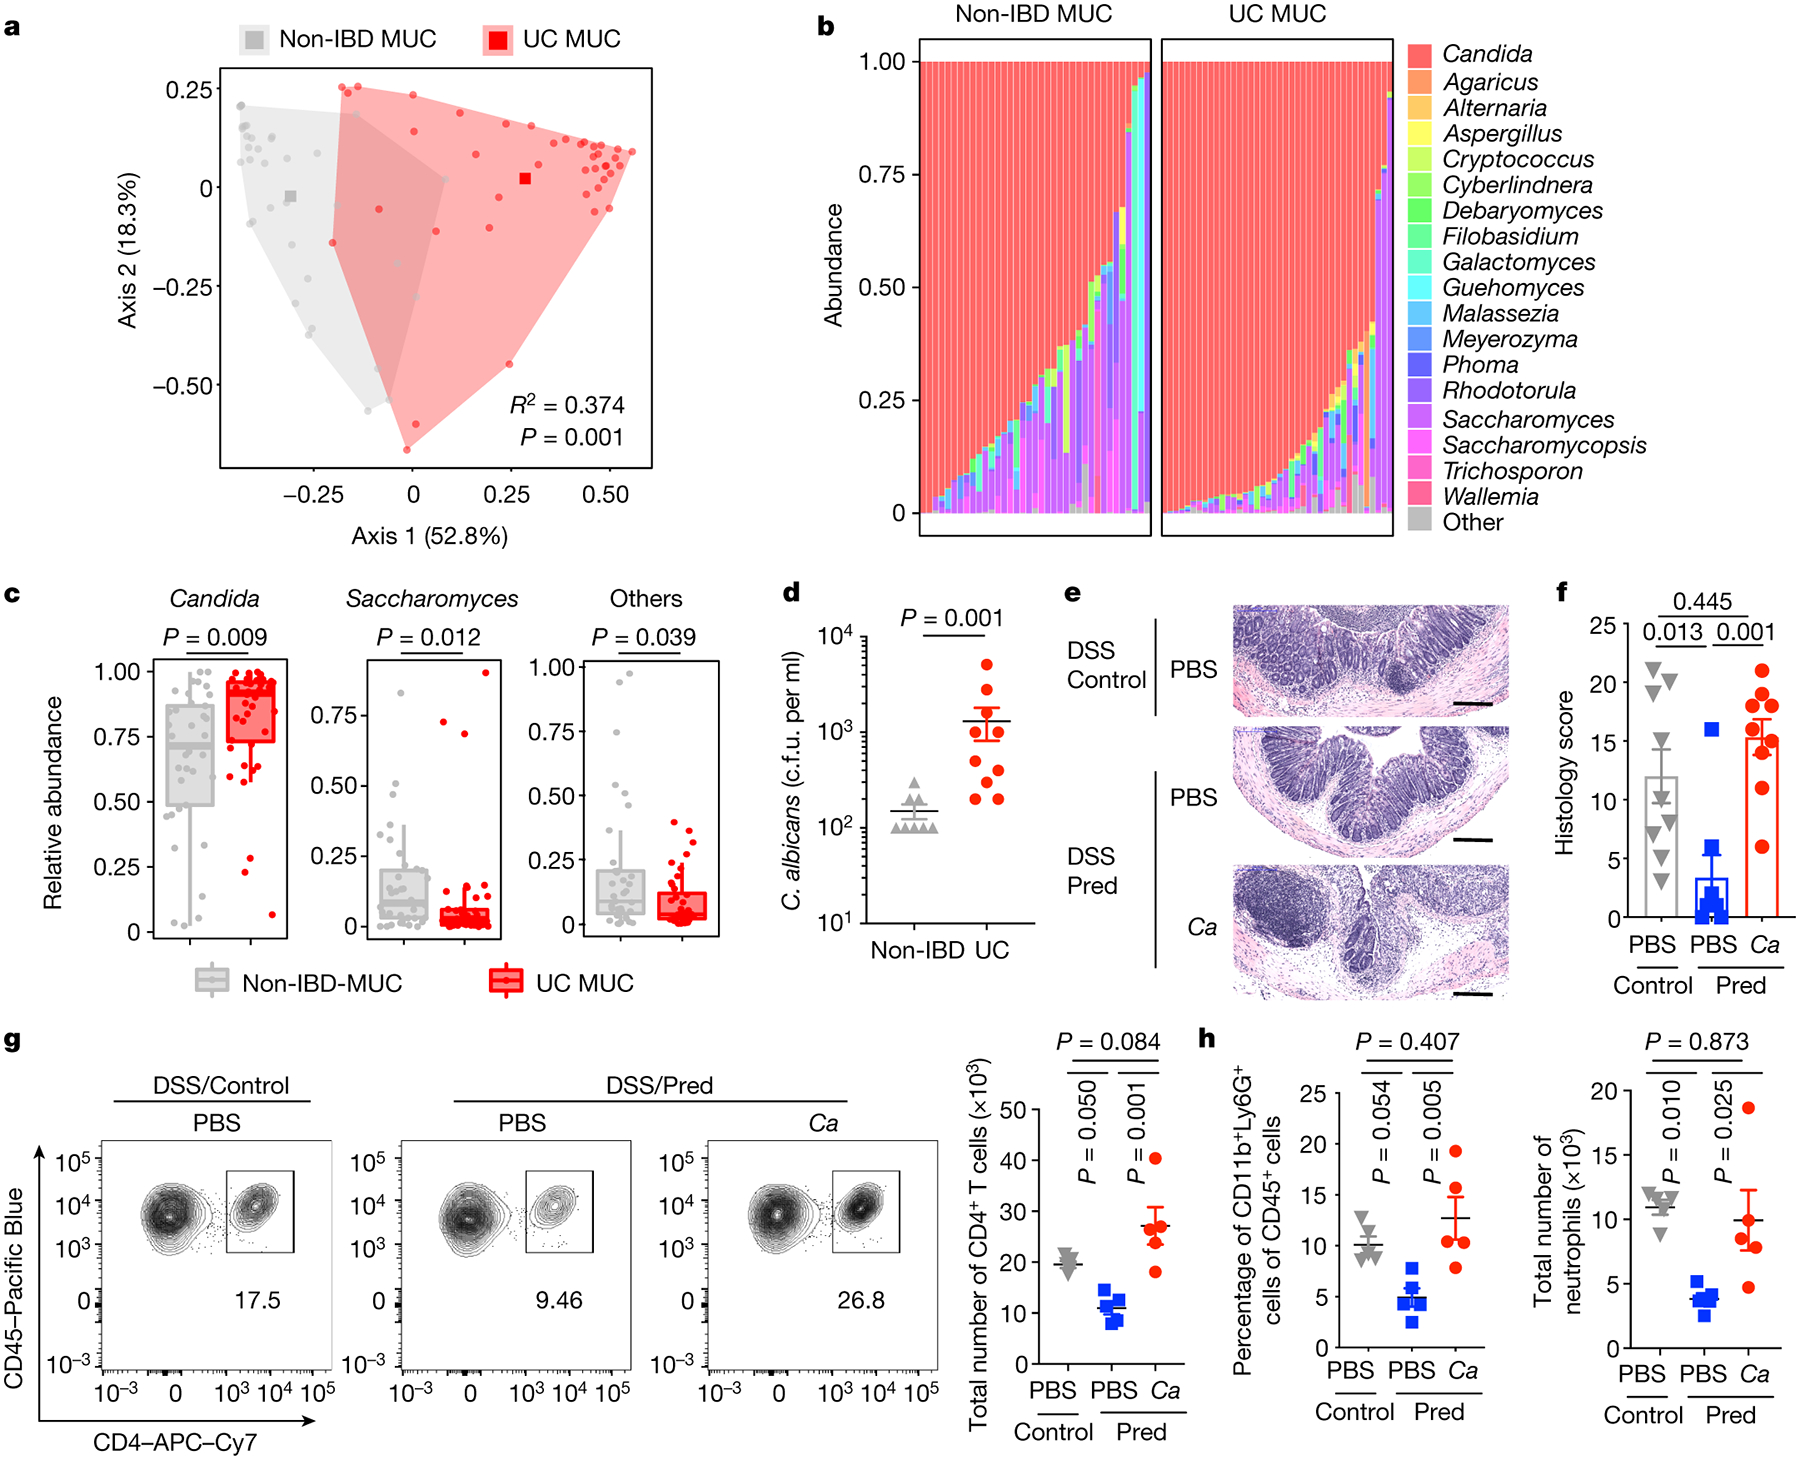
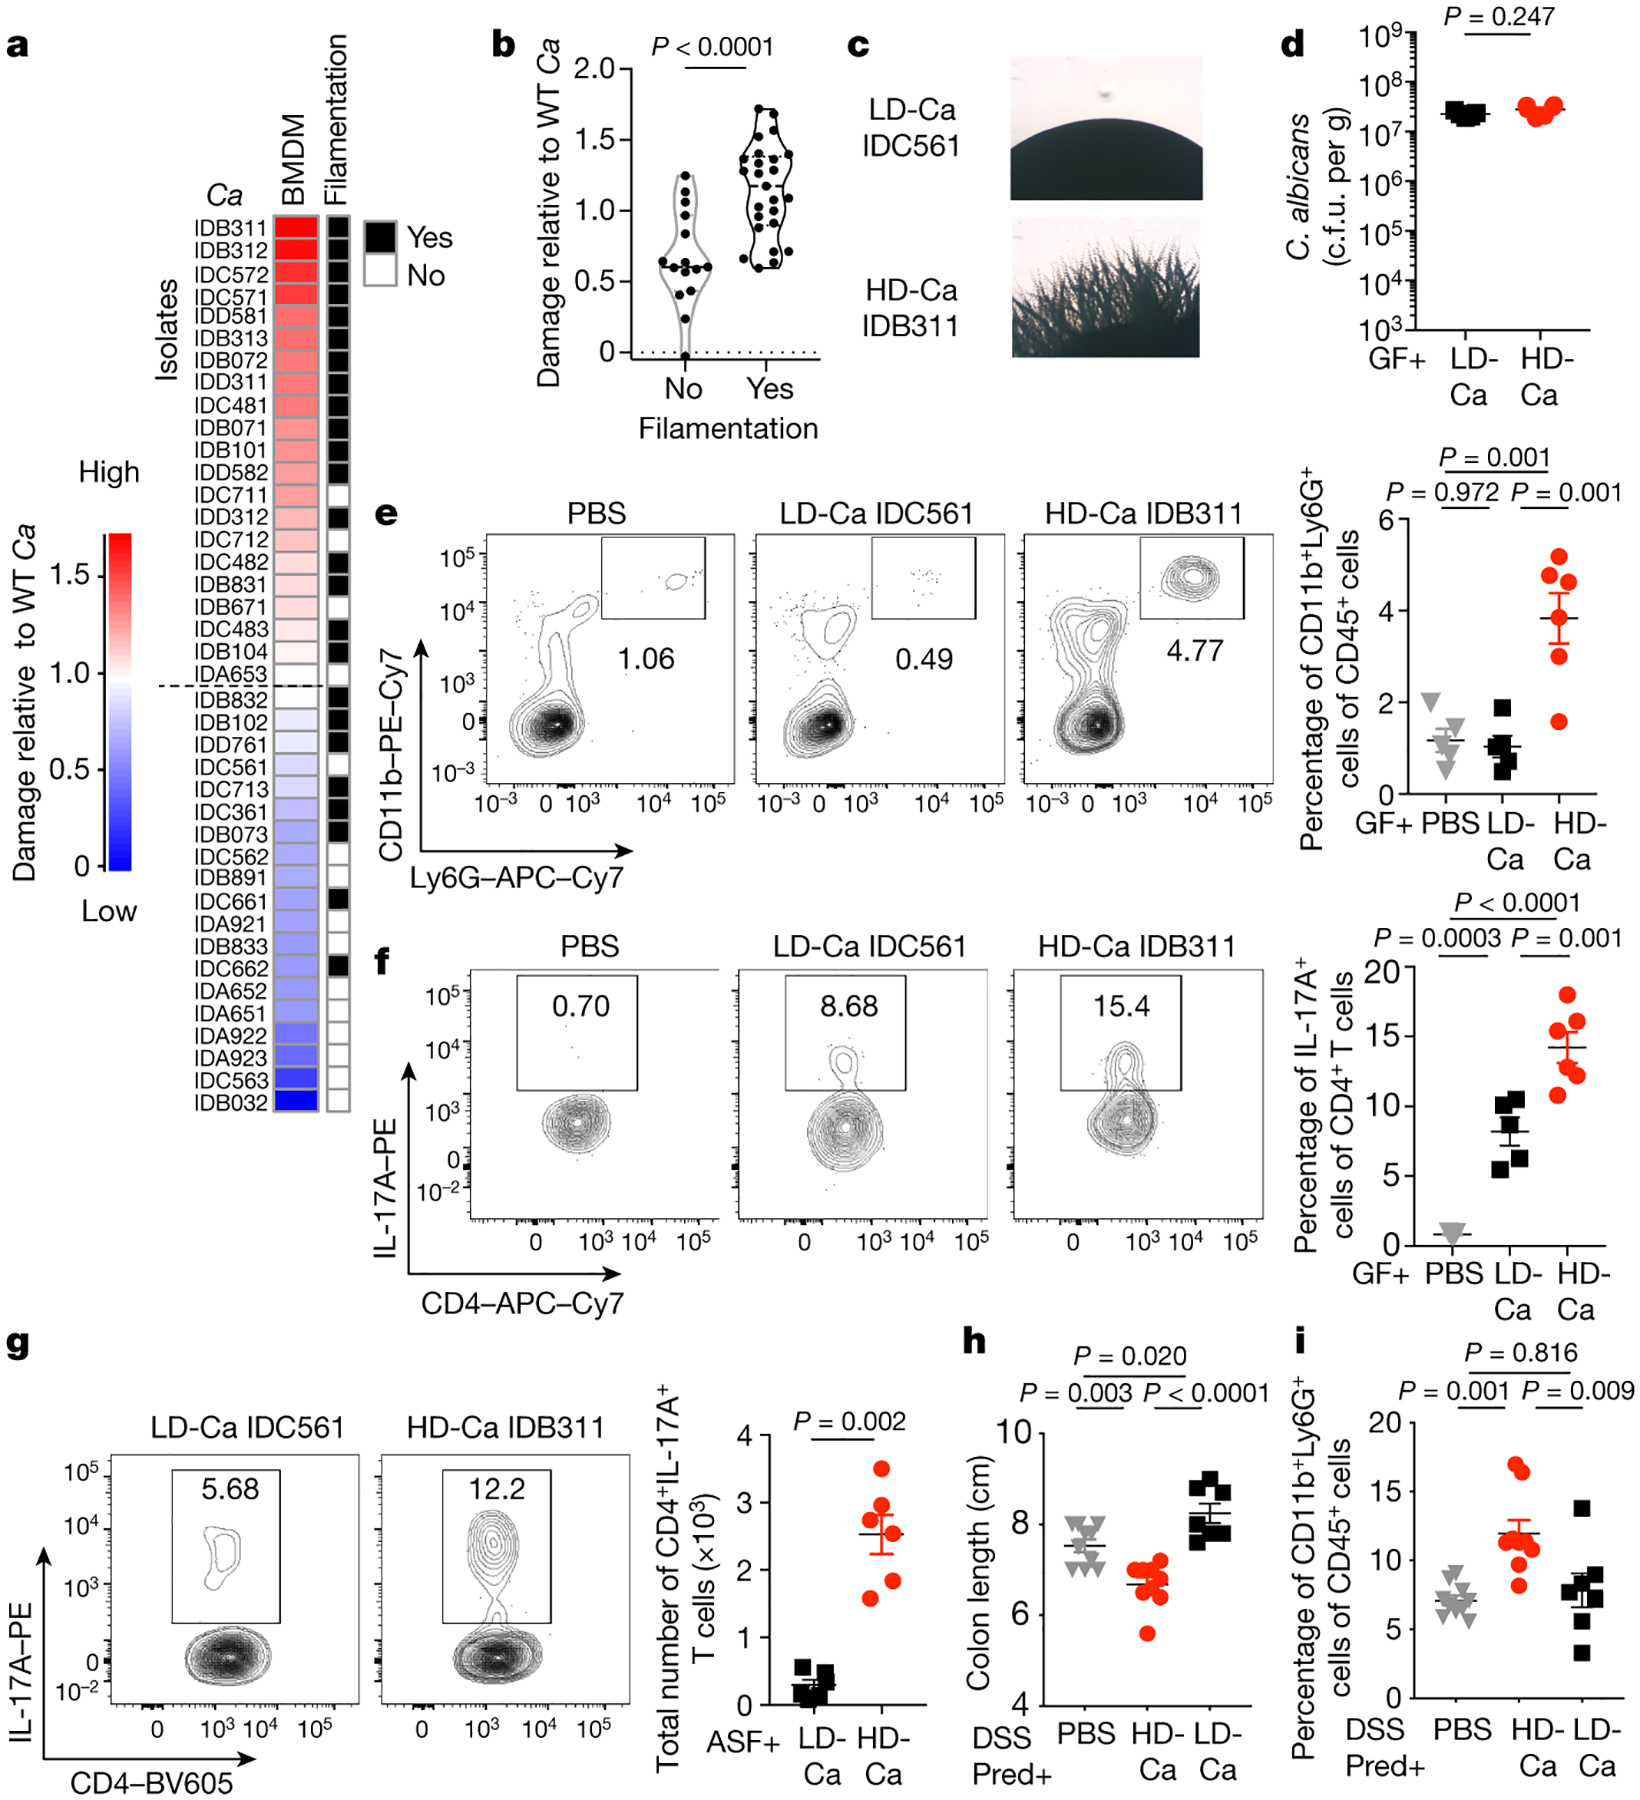
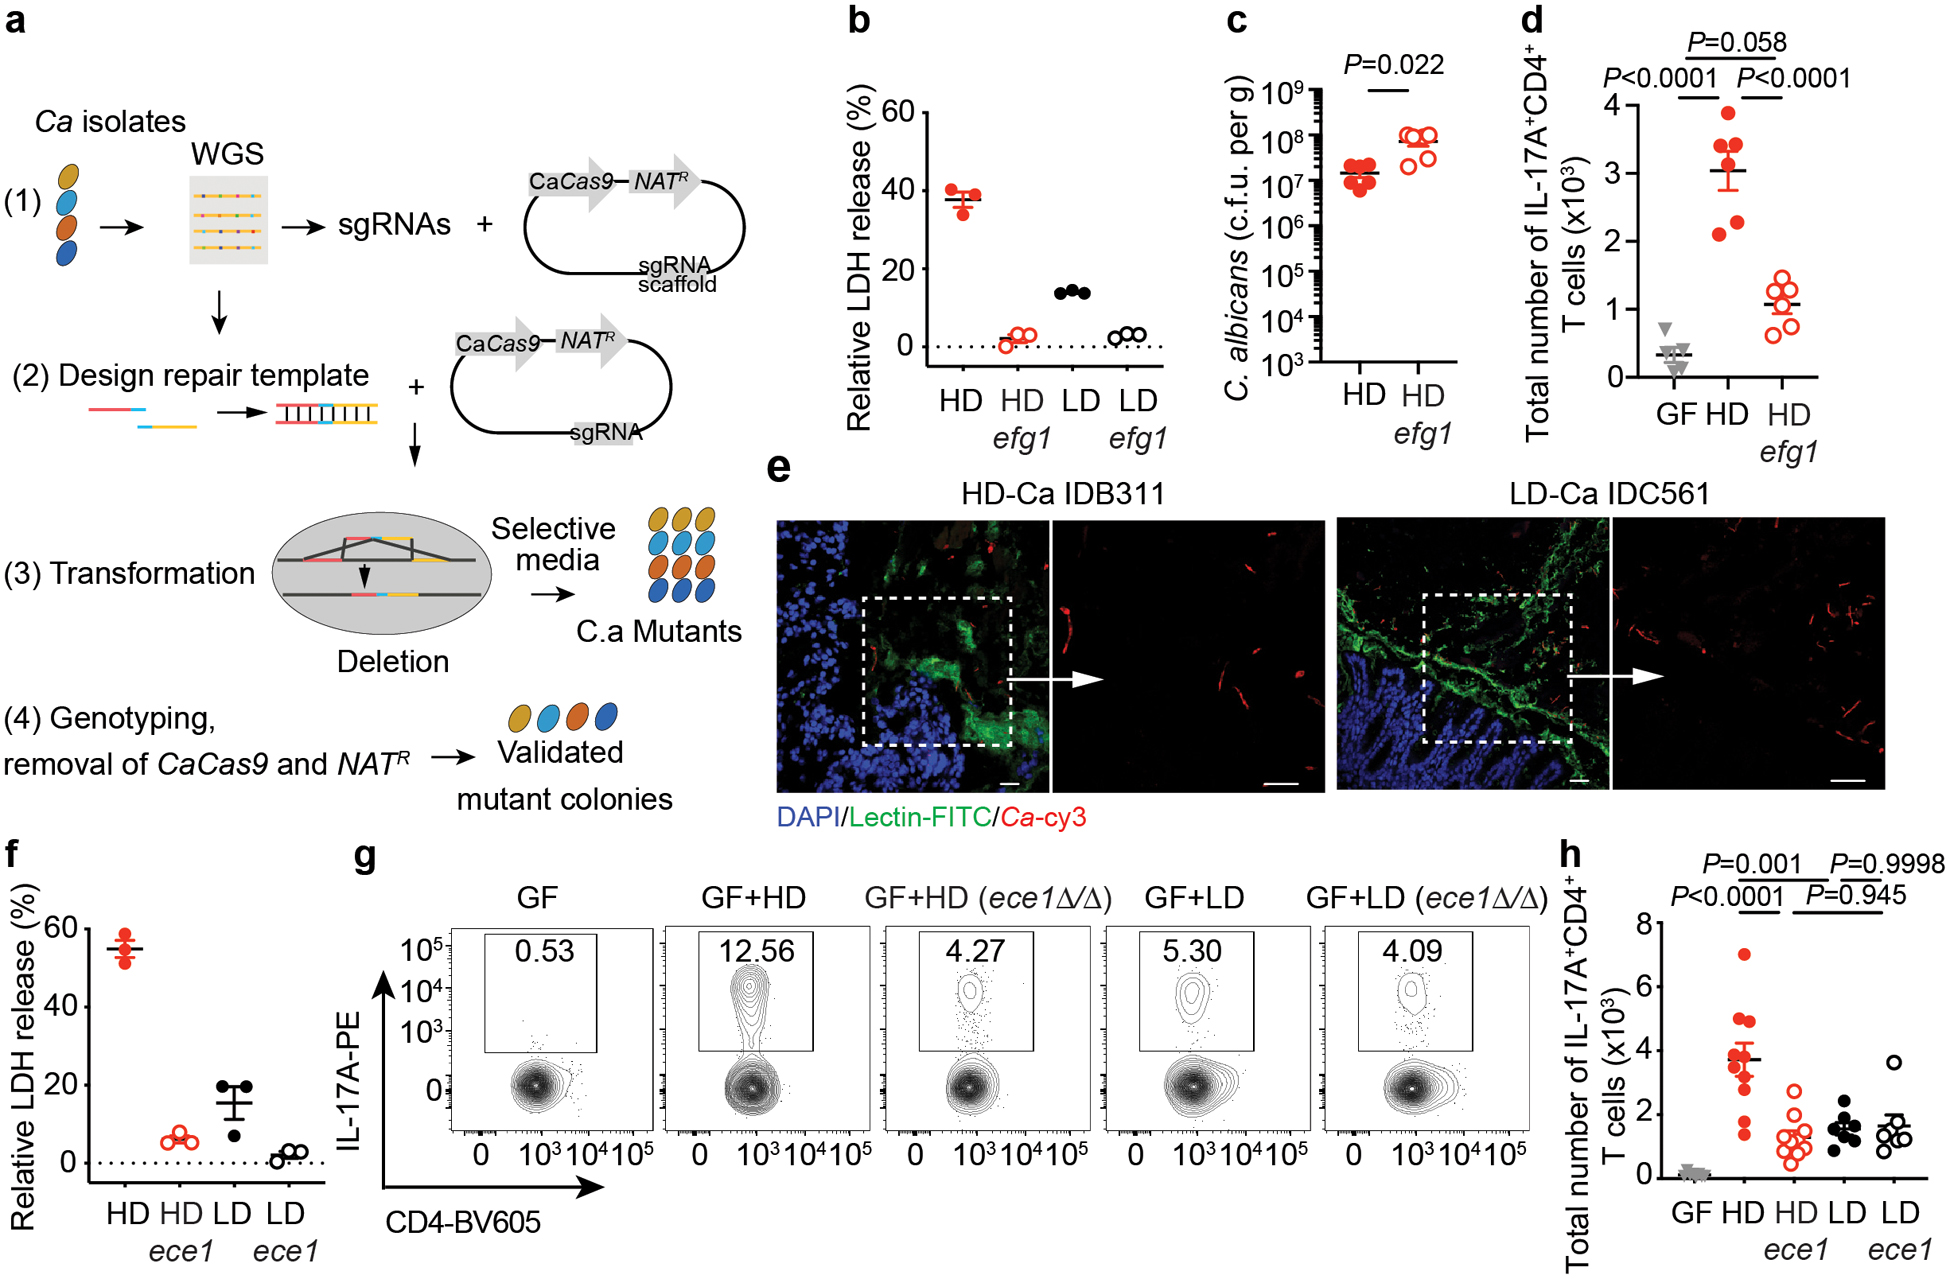
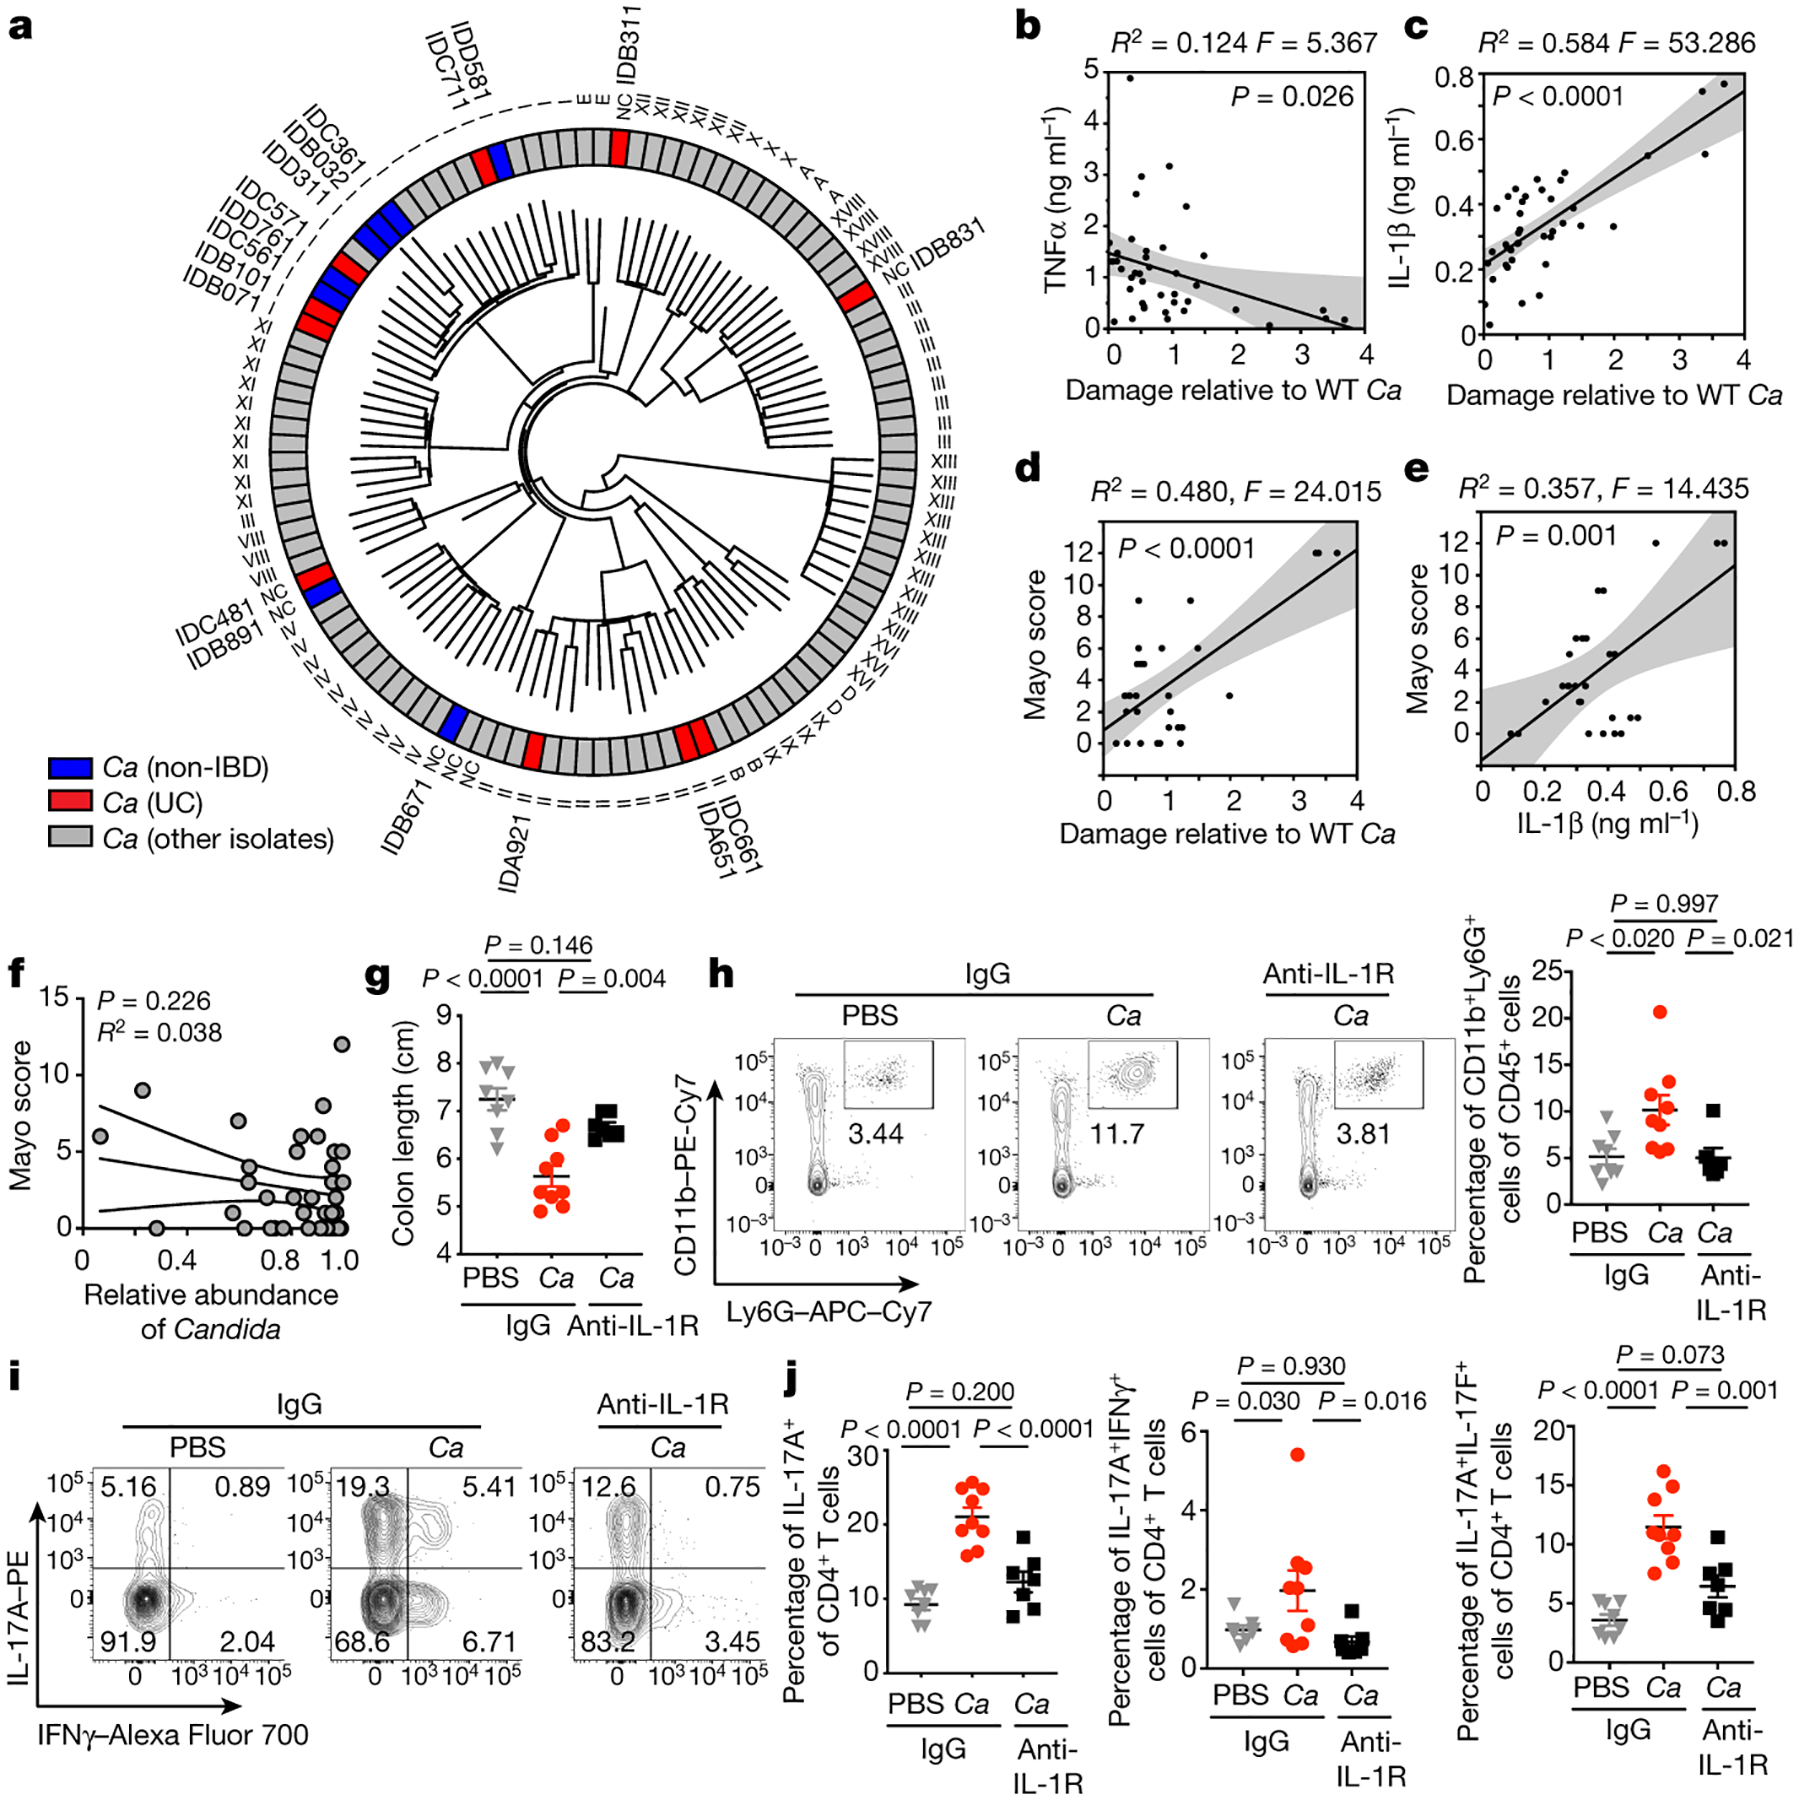
The fungal microbiota (mycobiota) is an integral part of the complex multikingdom microbial community colonizing the mammalian gastrointestinal tract and has an important role in immune regulation1-6. Although aberrant changes in the mycobiota have been linked to several diseases, including inflammatory bowel disease3-9, it is currently unknown whether fungal species captured by deep sequencing represent living organisms and whether specific fungi have functional consequences for disease development in affected individuals. Here we developed a translational platform for the functional analysis of the mycobiome at the fungal-strain- and patient-specific level. Combining high-resolution mycobiota sequencing, fungal culturomics and genomics, a CRISPR-Cas9-based fungal strain editing system, in vitro functional immunoreactivity assays and in vivo models, this platform enables the examination of host-fungal crosstalk in the human gut. We discovered a rich genetic diversity of opportunistic Candida albicans strains that dominate the colonic mucosa of patients with inflammatory bowel disease. Among these human-gut-derived isolates, strains with high immune-cell-damaging capacity (HD strains) reflect the disease features of individual patients with ulcerative colitis and aggravated intestinal inflammation in vivo through IL-1β-dependent mechanisms. Niche-specific inflammatory immunity and interleukin-17A-producing T helper cell (TH17 cell) antifungal responses by HD strains in the gut were dependent on the C. albicans-secreted peptide toxin candidalysin during the transition from a benign commensal to a pathobiont state. These findings reveal the strain-specific nature of host-fungal interactions in the human gut and highlight new diagnostic and therapeutic targets for diseases of inflammatory origin.


Conflict of interest statement

Competing interests

Cornell University has filed a provisional patent application covering inventions described in this manuscript. The authors declare no other competing interests.

Figures

Extended Data Fig. 1.
Extended Data Fig. 1.. Relative abundance of intestinal fungal genera in non-IBD and patients with UC.
a, Alpha diversity analysis was analyzed using the Shannon diversity index among fungi communities at the fungal OTU level in colonic mucosa (MUC) enriched samples from non-IBD or ulcerative colitis-affected (UC) individuals. Based on quality control one non-IBD sample was excluded from further mycobiome sequencing and analysis. b, Non-metric multidimensional scaling (NMDS) plot of distance ordination based on Bray–Curtis dissimilarities for fungal ITS1 OTUs in colonic mucosa (MUC) enriched samples from non-IBD or ulcerative colitis-affected (UC) individuals. Analysis of similarities (ANOSIM) statistics. c, Relative genus abundance of intestinal fungal genera. Boxplots in a and c, the lower and upper hinges correspond to the first and third quartiles (the 25th and 75th percentiles). The horizontal line shows the median. a-c, Each dot represents an individual human subject, non-IBD (n=37) or ulcerative colitis-affected (UC, n=40) individuals. Analysis performed with two-sided, non-paired, Mann-Whitney test, Benjamini-Hochberg (BH) corrected for data in a and c.
Extended Data Fig. 2
Extended Data Fig. 2. Intestinal colonization by C. albicans does not cause spontaneous colitis during homeostasis nor does it aggravate DSS-induced colitis.
a, Fecal C. albicans burdens were assessed after 3 days of C. albicans colonization in mice that received either control feeding water (n=4) or DSS water (n=5) for 4 days. Dots represent individual mice. b-g, Mice, after being gavaged with PBS (n=5) or C. albicans (n=5) for 14 days, were induced by 3% DSS water for 7 days. b, Schematic figure of DSS-induced colitis model of mice with intestinal colonization by C. albicans. c, H&E staining and histology score of colon sections. n=9 (DSS+ control PBS) and n=7 (DSS+ C. albicans). The scale bar 200μm. Data in c are pooled from two independent experiments with similar results. d-e, Representative flow cytometry plot and quantification of Foxp3+ (d) and RORγt+ CD4+ T (e) cells. f-g, Mice were gavaged twice per week with PBS (n=5) or C. albicans WT SC5314 (n=5). Mice were sacrificed four months later for colon length (f) and histology evaluation, the scale bar 100μm (g). Each dot represents an individual mouse. Data in a-e are representative of three independent experiments with similar results. Data in f-g representative of two independent experiments with similar results. Data in a, c, and d-g are shown as mean ± s.e.m., unpaired, two-tailed, Mann-Whitney test.
Extended Data Fig. 3.
Extended Data Fig. 3.. C. albicans expands and promotes intestinal inflammation under immunosuppression therapy for UC.
a, Medication data summary for UC patients (n=5609) who visited New York-Presbyterian Hospital from 2016–2018. Corticosteroids (CS, n=2522); Others include Mercaptopurine, Azathioprine, Methotrexate, Tacrolimus, Cyclosporine and Biologics (n=3057). Some individuals were being treated with two or more treatments. b, Fecal C. albicans burdens were measured after 3 days of C. albicans colonization in mice that received either PBS (n=5) or prednisolone daily (10 mg/kg/day, n=5). c-e, WT SPF mice were fed PBS (n=5), Pichia kudriavzevii (P.k, n=5), or Candida albicans (C.a, n=5) while receiving prednisolone treatment (Pred+PBS, Pred+P.k, or Pred+C.a). 3% DSS drinking water was used to induce colitis for 7 days. Mice were sacrificed three days after the DSS water was removed. c, Fecal fungal burdens upon sacrifice. d, Colon length was assessed. e, Representative flow cytometry plots and quantification of the frequency IL-17A+CD4+ T cells in the colons. Results in b-f are shown as mean ± s.e.m. Each dot represents an individual mouse. Data in b-e are representative of three independent experiments with similar results. Unpaired, two-tailed, Mann-Whitney test (b and c) or one-way ANOVA followed by the Tukey’s post hoc test (d and e).
Extended Data Fig. 4.
Extended Data Fig. 4.. Gut-derived C. albicans isolates exhibit different phenotypic responses in a filamentation assay.
a, Gut C. albicans isolates were cultured on Spider agar at 37°C for 5 days followed by assessment of the edge of wrinkled and smooth colonies. Percentage of the filamentation phenotypes of gut C. albicans isolates in Fig. 2a on spider agar. b-i, Filamentation phenotype of representative gut C. albicans isolates used in Fig 2a. b, C. albicans IDB311, IDB312, and IDB313 isolates from UC patient IDB31. c, C. albicans IDB831, IDB832, and IDB833 isolates from UC patient IDB83. d, C. albicans IDB101, IDB102, and IDB104 isolates from UC patient IDB10. e, C. albicans IDC481, IDC482, and IDC483 isolates from UC patient IDC48. f, C. albicans IDB071, IDB072, and IDB073 isolates from UC patient IDB07. g, C. albicans IDA651, IDA652, and IDA653 isolates from UC patient IDA65. h, C. albicans IDA921, IDA922, and IDA923 isolates from UC patient IDA92. i, C. albicans IDC561, IDC562, and IDC563 isolates from non-IBD individual IDC56. Data are representative of three independent experiments with same results.
Extended Data Fig. 5.
Extended Data Fig. 5.. High-damaging strains induce greater proinflammatory immune responses.
a-c, WT germ-free (GF) mice were colonized with C.a strains for three weeks. PBS (n=5), LD/C.a (IDC561, n=5), HD/C.a (IDB311, n=6). a, Gating strategy to analyze CD4+ T cells in colonic lamina propria cells. Representative flow cytometry plots and quantification of CD4+IL-17A+IL-17F+ (b, from left to right) and CD4+RORγt+ cells (c, from left to right) in the colon. d-f, ASF mice were colonized with C.a strains for three weeks. PBS (n=6), LD/C.a (IDC561, n=6), and HD/C.a (IDB311, n=6). d, C. albicans burden in the feces at day 21. e, Frequency of colonic CD4+IL-17A+ Th17 cells. f, Frequency of colonic CD4+RORγt+ cells. g-h, ASF mice were colonized with LD/C.a (IDB891, n=5) or HD/C.a (IDB101, n=6) for three weeks. g, C. albicans burden in the feces at day 21. h, Frequency of CD4+IL-17A+ Th17 cells in the colon were assessed. i-j, ASF mice were colonized with LD/C.a (IDC662, n=6) or HD/C.a (IDC711, n=6) for three weeks. i, C. albicans burden in the feces at day 21. j, Frequencies of CD4+IL-17A+ and CD4+IL-17A+ IL-17F+ Th17 cells in the colon were assessed. k, SPF WT mice were with C.a strains colonized and treated with prednisolone followed by DSS-induced murine colitis. PBS (n=10), HD/C.a IDB311 (n=9) and LD/C.a IDC561 (n=7). Fecal C. albicans burdens were assessed upon sacrifice. Results in b-k are shown as mean ± s.e.m. Each dot represents an individual mouse. Data in b-c are representative of three independent experiments with similar results. Data in d-k are representative of three independent experiments with similar results. Unpaired, two-tailed, Mann-Whitney test (d-k) or one-way ANOVA followed by the Tukey’s post hoc test (b and c).
Extended Data Fig. 6.
Extended Data Fig. 6.. EFG1-dependent candidalysin is required for cell damage in high-damaging C. albicans strains from the human gut.
a, Caco2 cells were infected with live C. albicans for 12 hours, and both the EFG1 expression of C. albicans. HD/C.a IDB311 and LD/C.a IDC561 strains, and respective efg1Δ/Δ (efg1) strains were used in this experiment. Data shown as mean ± s.d. Data points indicate technical well replicates (n=3). Data are representative of three independent experiments with similar results. b, Dendrogram showing SNP-based distances between EFG1 sequences of isolates. Each isolate was obtained from an individual subject from the non-IBD (n=8) or UC patient (n=10) group. c, Caco2 cells were infected with C. albicans and LDH release of Caco2 cells was assessed. HD/C.a IDB101, HD/C.a IDB101 efg1Δ/Δ mutant (efg1), LD/C.a IDB891, and LD/C.a IDB891 efg1Δ/Δ mutant (efg1) were used. d, C. albicans HD/C.a IDB311, HD/C.a IDB101 and the respective EFG1 mutants were cultured on Spider agar at 37°C for 5 days followed by assessment of the filamentation phenotype. Data are representative of two independent experiments with same results. e-f, GF mice were colonized with PBS (GF, n=5), HD/C.a IDB311 (HD, n=6) or HD/C.a IDB311 efg1 (HD efg1, n=6) strains for three weeks. e, Frequencies of IL-17A+CD4+ T cells; f, Frequencies, and total cell numbers of IL-17A+IL-17F+CD4+ T cells, in the colon were assessed by flow cytometry. g, ECE1 gene expression in C. albicans cells were assessed upon EFG1 gene deletion. Data shown as mean ± s.d. Data points indicate technical well replicates (n=3). Data are representative of three independent experiments with similar results. h, Log2 transformed ratio of gene expression between EFG1 mutant and WT C. albicans strain upon colonization of the large intestine represented as a volcano plot. Data were obtained and analyzed from a recent resource dataset from Witchley et al. 2021. i, LDH release were assessed from Caco2 cells. HD/C.a IDB101, LD/C.a IDB891 and respective ECE1 mutant strains were used. Data shown as mean ± s.d. Data points indicate technical well replicates (n=3). Data are representative of three independent experiments with similar results. j-m, GF mice were colonized with C.a strains for three weeks. PBS GF (n=8), HD/C.a IDB311 (HD, n=10), HD ece1 (n=10), LD/C.a IDC561 (LD, n=7), and LD ece1 (n=7). j, Quantification of the frequencies of IL-17A+CD4+ T cells; k, Quantification of the frequencies, and total cell numbers of IL-17A+IL-17F+CD4+ T cells in the colon. l, Fecal C. albicans burden were measured at day 21. Each dot represents an individual mouse. m, HD and LD C. albicans strains both colonize the intestine and form a mixture of yeast and hyphal morphotypes. Fluorescence in situ hybridization (FISH) was utilized to visualize the morphology of C. albicans HD/C.a IDB311, LD/C.a IDC561, and respective ECE1 mutant strains (HD/C.a IDB311 ece1Δ/Δ and LD/C.a IDC561 ece1Δ/Δ) in the colon tissue after 21 days of mono-colonization of C. albicans. The nuclei of colonic epithelial cells were stained with DAPI (blue), colonic mucin was stained with a FITC- conjugated Ulex europaeus agglutinin (UEA-I, lectin) (green), and C. albicans was stained with a Cy3-coupled pan-fungal-specific probe (red). The colon tissue of germ-free mice was used as a control. The scale bar 25 μm. Results in e-f and j-l are shown as mean ± s.e.m.. Data in e-f are representative of three independent experiments with similar results. Data in j-m are representative of two independent experiments with similar results. Unpaired, two-tailed, Mann-Whitney test (a, g), One-way ANOVA followed by the Tukey’s post hoc test (e, f, j, k, l).
Extended Data Fig. 7.
Extended Data Fig. 7.. Genomic comparative analysis of genetic polymorphisms in CPH1, UME6, FLO8 and ECE1 among high- and low-damaging strains.
a-c, Dendrogram showing SNP-based distances between CPH1 (a), UME6 (b), FLO8 (c) and ECE1 (d) sequences of isolates. Each isolate was obtained from an individual subject from the non-IBD (n=8) or UC patient (n=10) group.
Extended Data Fig. 8.
Extended Data Fig. 8.. Gut C. albicans promotes intestinal pro-inflammatory immunity through candidalysin.
a-b, Cell damage by C. albicans. mBMDM (a) and Caco2 cells (b) were incubated with live C. albicans (MOI=5) wild-type parental (C.a Pare) or C. albicans ece1Δ/Δ (C.a ece1) strains for 16 hours and LDH release in the supernatants was measured. Results are shown as mean ± s.d. Data points indicate technical well replicates (n=3). Data are representative of three independent experiments. Unpaired, two-tailed, student test. c-e, ASF mice were colonized with C.a. Pare or C.a ece1 strains for three weeks. n=6 mice in each group. c-d, Frequency and total cell numbers of CD11b+Ly6G+ neutrophils (c, from left to right) and IL-17A+CD4+ T cells (d, from left to right) in the colon. e, Fecal C. albicans burdens were measured at day 21. f-j, WT SPF mice were colonized with or without C.a Pare or C.a ece1 strain, DSS colitis was induced followed by treatment with prednisolone. f, Fecal C. albicans burden were measured upon sacrifice. g, representative H&E colon section. The scale bar 200μm. h, Histology scores. PBS (n=14), C.a Pare (n=15), and C.a ece1 (n=13). Data are pooled from two independent experiment with similar results. i, Frequency of cLP neutrophils. j, IL-17A+CD4+ T cells were assessed upon sacrifice. Results in c-f and h-j are shown as mean ± s.e.m. Each dot represents an individual mouse. Data in c-f and i-j are representative of two independent experiments with similar results. Unpaired, two-tailed, Mann-Whitney test (e, f) or one-way ANOVA followed by the Tukey’s post hoc test (c, d, h, i, j).
Extended Data Fig. 9.
Extended Data Fig. 9.. C. albicans clonal expansion, and microevolution occur in the human gut.
a, Dendrogram showing genome-wide SNP-based distances among two or three human gut C. albicans isolates obtained from the same individual subject. Strains isolated from non-IBD subjects (nIBD), UC patients (UC), and refence strain C. albicans SC5314 (Ref. Strain). b, Heatmap showing genome-wide density of heterozygous SNPs from two or three human gut C. albicans isolates obtained from the same individual subject. Strains isolated from non-IBD subjects (nIBD), UC patients (UC), and refence strain C. albicans SC5314 (Ref. Strain) are labeled. Color density indicates the number of heterozygous SNPs detected in each 10 kbp window of an isolate’s genome. Arrows point to the genomic locations of ECE1 and EFG1 genes. c, Multiple sequence alignment of candidalysin (SK1 peptide) amino acid sequences across multiple isolates of C. albicans. Each isolate was obtained from an individual subject from the non-IBD or UC patient group. Four isoforms of candidalysin across strains show no association/clustering of specific isoform with HD or LD strain. Two haplotypes are shown for isolates that are heterozygous in this region.
Extended Data Fig. 10.
Extended Data Fig. 10.. Immune mediators released by macrophage upon infection with gut -derived C. albicans strains.
a, LDH release measured in culture supernatants of hMDM after infection with C. albicans parental strain (Pare), C.a ece1D/ece1/ D (C.a ece1) and an untreated group (Ctrl) for 16 hours. b, Macrophage-released mediators measured by cytometric bead assays from cultures in Extended Data Fig. 10a. c, IL-1β release measured in culture supernatants of LPS-primed hMDMs infected with C. albicans parental strain, C.a ece1, and in uninfected group. Parallel experiments were performed with a. Results a-c are shown as mean ± s.d. Data are representative of three independent experiments with similar results. d-f, Cytokine release in culture supernatants of unprimed human monocyte-derived macrophages (hMDMs) after incubation with live gut derived-C. albicans isolates (MOI=5). d, IL-6 cytokine production was measured by ELISA. hMDM damage measured (LDH assay) in the same experiment was correlated with specific cytokine release. e-f, Correlation between TNF-α and IL-6 cytokine from hMDM induced by patient-specific gut C. albicans and Mayo score in corresponding UC patients (n=10). Dot is shown as an average value of three technical repeats, Data are representative of three independent experiments with similar results. The simple linear regression was performed, where P-value calculated by a F test. g-h, Mice colonized with or without HD/C.a IBD311 were treated with prednisolone (Pred) followed by DSS-mediated induction of colitis. Each mouse further treated with 1 mg anti-IL-1R1 IgG (αIL1R) or isotype IgG (IgG) at the time point indicated in the schematic figure of experimental layout (g). IgG+PBS (n=8), IgG+C.a (n=9) and αIL-1R1+C.a (n=7). h, Representative flow cytometry plots of IL-17A+IL-17F+CD4+ T cells. Data in d-h are representative of three independent experiments with similar results. One-way ANOVA followed by the Tukey’s post hoc test (a-c).
Figure 1.
Figure 1.. C. albicans expands in UC patient colonic mucosa and promotes inflammation in a murine model of colitis.
a, Principal coordinate analysis (PCoA) plot of distance ordination for fungal ITS1 OTUs in colonic mucosa (MUC) samples from non-IBD or UC individuals. Analysis of similarities (ANOSIM) statistics. b, Relative abundance of detected fungal genera. c, Relative abundance of Candida spp., Saccharomyces spp. and other less represented fungal genera (“others”); The lower and upper hinges correspond to the first and third quartiles (the 25th and 75th percentiles). The horizontal line shows the median. a-c, Each dot represents an individual human subject, non-IBD (n=37) and UC (n=40) individuals. d, Fungal colonies from each individual subject were identified by MALDI-TOF, and viable C. albicans colony forming units (cfu) per mL of lavage sample were determined. Results are shown as mean ± s.e.m. non-IBD (n=8) and UC (n=10) individuals. e-h, Mice were fed PBS or C. albicans SC5314, then treated with PBS or prednisolone before DSS-mediated induction of colitis. e-f, H&E staining and histology score of colon sections. Ctrl PBS (n=9), Pred+PBS (n=8), Pred+C.a (n=9). Data in f are pooled from two independent experiments with similar results. g-h, Representative flow cytometry plots and quantification of the frequency and total cell number of colonic lamina propria (cLP) CD4+ T cells (g, from left to right) and CD11b+Ly6G+ neutrophils (h, from left to right), n=5 in each group (g and h). f-h, Results are shown as mean ± s.e.m. Each dot represents an individual mouse. Data in g-h are representative of two independent experiments with similar results. Unpaired, two-tailed, Mann-Whitney test (c and d) or one-way ANOVA followed by the Tukey’s post hoc test (f, g and h).
Figure 2.
Figure 2.. Cell damage and proinflammatory immunity induced by human gut-derived C. albicans is strain-dependent.
a, mBMDM were infected with C. albicans (C.a) isolates (three isolates per individual; MOI=5) for 16 hours, and cytotoxicity (LDH release as compared to SC5314) was measured. Data are shown as an average value of three technical repeats. b, Filamentation phenotype of each isolate was determined in a spider agar assay and compared the capacity of C. a isolates to induce damage of mBMDM (LDH assay). Results are shown as mean ± s.e.m. a-b, Data are representative of three independent experiments with similar results. c, Representative images of LD/C.a; IDC561 and HD/C.a; IDB311. d-f, WT germ-free (GF) mice were colonized with C.a strains for three weeks. PBS (n=5), LD/C.a (IDC561, n=5), HD/C.a (IDB311, n=6). d, Fecal C. albicans burden was measured at day 21. e-f, Representative flow cytometry plots and quantification of CD11b+Ly6G+ neutrophils and CD4+IL-17A+ Th17 cells in the colon. g-i, ASF mice were colonized with C.a strains for three weeks. PBS (n=6), LD/C.a (IDC561, n=6), and HD/C.a (IDB311, n=6). g, Total numbers of colonic CD4+IL-17A+ Th17 cells. h-i, SPF WT mice were with C.a strains colonized and treated with prednisolone followed by DSS-induced murine colitis. PBS (n=10), HD/C.a IDB311 (n=9) and LD/C.a IDC561 (n=7). h, Colon length. i, Frequencies of CD11b+Ly6G+ neutrophils in the colon. Data in d-i are shown as mean ± s.e.m. Each dot represents an individual mouse. Data are representative of three (c-f) or two (g-i) independent experiments with similar results. Unpaired, two-tailed, Mann-Whitney test (b, d and g) or one-way ANOVA followed by the Tukey’s post hoc test (e, f, h and i).
Figure 3.
Figure 3.. HD C. albicans promotes intestinal pro-inflammatory immunity through the Efg1-Ece1-dependent factor candidalysin.
a, Schematic view of CRISPR/Cas9-mediated mutagenesis in C. albicans (C.a) isolates as described in Methods. b, Caco2 cells were infected with C.a for 12 hours, and the LDH release was assessed. HD and LD strains, and respective efg1Δ/Δ (efg1) knockouts were used. c-d, GF mice were colonized with C.a strains for three weeks. PBS GF (n=5), HD/C.a IDB311 (HD, n=6), and HD/C.a IDB311 efg1 (HD efg1, n=6). c, Fecal C. a burden was assessed at day 21. d, Total cell numbers of IL-17A+CD4+ T cell in the colon. e, GF mice were colonized with HD/C.a IDB311 (n=10) and LD/C.a IDC561 (n=7) strains. FISH-stained C.a in the colon. Left, DAPI-stained colonic epithelial cell (blue), FITC-UEA-1-stained mucus layers (green), and rRNA Cy3-probe-stained C.a (red). Right, C.a morphotypes. Scale bar 25 μm. f, LDH release from Caco2 cells infected with C.a was assessed. HD/C.a IDB311, LD/C.a IDC561 strains, and respective ECE1 mutant strains were used. g-h, GF mice were colonized with C.a strains for three weeks. PBS GF (n=8), HD/C.a IDB311 (HD, n=10), HD ece1 (n=10), LD/C.a IDC561 (LD, n=7), and LD ece1 (n=7). g-h, Representative flow cytometry plots and total cell numbers of IL-17A+CD4+ T cells in the colon. Data in b and f are shown as mean ± s.d. Data points indicate technical well replicates (n=3) and are representative of three independent experiments with similar results. Data in c, d and g-h are shown as mean ± s.e.m. Each dot represents an individual mouse. Data are representative of three (c-d) or two (e-h) independent experiments with similar results. Unpaired, two-tailed, Mann-Whitney test (b, c, and f) or one-way ANOVA followed by the Tukey’s post hoc test (d, and h).
Figure 4.
Figure 4.. Capacity of patient-specific C. albicans strains to induce IL-1β reflects UC disease severity and anti-IL-1R antibody treatment ameliorates disease in mice.
a, Dendrogram based on whole genome sequence similarity of 18 newly sequenced gut C. albicans (C.a) isolates, together with 94 C. a strains collected worldwide. Strains isolated from non-IBDs (blue), UC (red), or other isolates (gray) are color labeled. Clade labels are shown as defined in Ropars et al. or labelled “NC” (no clade assigned). b-c, TNF-α and IL-1β release in culture supernatants of unprimed (b) or LPS-primed (c) hMDMs after incubation with C.a isolates (MOI=5). Cytokine release was measured by ELISA. hMDM LDH release was correlated with cytokine release (b-c). d, Correlation between hMDM damage by patient-specific gut C.a and Mayo score (UC, n=10). e, Correlation between the IL-1α production in hMDMs incubated with patient-specific C. albicans and Mayo score (n=10). f, Correlation between the relative abundance of Candida in UC patient samples and Mayo score. UC (n=40) individuals. b-e, Dot is shown as an average value of three technical repeats, Data are representative of three independent experiments with similar results. The simple linear regression was performed, where P-value calculated by a F test. g-j, Mice colonized with or without HD/C.a IBD311 were treated with prednisolone (Pred) followed by DSS-induced murine colitis, and further treated with anti-IL-1R1 IgG (〈IL1R) or isotype IgG (IgG). IgG+PBS (n=8), IgG+C.a (n=9) and anti-IL-1R1+C.a (n=7). g, Colon length, h, Frequencies of CD11b+Ly6G+ neutrophils in the colon, i-j, Representative flow cytometry plots and frequencies of IL-17A+, IL-17A+IFNγ+ and IL-17A+IL-17F+CD4+ T cells in the colon. Results are shown as mean ± s.e.m. Each dot represents an individual mouse. Data in b-e and g-j are representative of three independent experiments with similar results. One-way ANOVA followed by the Tukey’s post hoc test (g, h and j). One-way ANOVA followed by the Tukey’s post hoc test.

Comment in

Similar articles

Cited by

References

    1. Human Microbiome Project, C. Structure, function and diversity of the healthy human microbiome. Nature 486, 207–14 (2012). - PMC - PubMed
    1. Lloyd-Price J et al. Multi-omics of the gut microbial ecosystem in inflammatory bowel diseases. Nature 569, 655–662 (2019). - PMC - PubMed
    1. Chehoud C et al. Fungal Signature in the Gut Microbiota of Pediatric Patients With Inflammatory Bowel Disease. Inflammatory bowel diseases 21, 1948–56 (2015). - PMC - PubMed
    1. Hoarau G et al. Bacteriome and Mycobiome Interactions Underscore Microbial Dysbiosis in Familial Crohn’s Disease. mBio 7, e01250–16 (2016). - PMC - PubMed
    1. Liguori G et al. Fungal Dysbiosis in Mucosa-associated Microbiota of Crohn’s Disease Patients. Journal of Crohn’s & colitis 10, 296–305 (2016). - PMC - PubMed