. 2022 Mar;603(7902):654-660.
doi: 10.1038/s41586-022-04492-9. Epub 2022 Mar 16.

Reproducible brain-wide association studies require thousands of individuals

Affiliations

Reproducible brain-wide association studies require thousands of individuals

Scott Marek et al. Nature. 2022 Mar.

Erratum in

  • Publisher Correction: Reproducible brain-wide association studies require thousands of individuals.
    Marek S, Tervo-Clemmens B, Calabro FJ, Montez DF, Kay BP, Hatoum AS, Donohue MR, Foran W, Miller RL, Hendrickson TJ, Malone SM, Kandala S, Feczko E, Miranda-Dominguez O, Graham AM, Earl EA, Perrone AJ, Cordova M, Doyle O, Moore LA, Conan GM, Uriarte J, Snider K, Lynch BJ, Wilgenbusch JC, Pengo T, Tam A, Chen J, Newbold DJ, Zheng A, Seider NA, Van AN, Metoki A, Chauvin RJ, Laumann TO, Greene DJ, Petersen SE, Garavan H, Thompson WK, Nichols TE, Yeo BTT, Barch DM, Luna B, Fair DA, Dosenbach NUF. Marek S, et al. Nature. 2022 May;605(7911):E11. doi: 10.1038/s41586-022-04692-3. Nature. 2022. PMID: 35534626 Free PMC article. No abstract available.

Abstract

Magnetic resonance imaging (MRI) has transformed our understanding of the human brain through well-replicated mapping of abilities to specific structures (for example, lesion studies) and functions1-3 (for example, task functional MRI (fMRI)). Mental health research and care have yet to realize similar advances from MRI. A primary challenge has been replicating associations between inter-individual differences in brain structure or function and complex cognitive or mental health phenotypes (brain-wide association studies (BWAS)). Such BWAS have typically relied on sample sizes appropriate for classical brain mapping4 (the median neuroimaging study sample size is about 25), but potentially too small for capturing reproducible brain-behavioural phenotype associations5,6. Here we used three of the largest neuroimaging datasets currently available-with a total sample size of around 50,000 individuals-to quantify BWAS effect sizes and reproducibility as a function of sample size. BWAS associations were smaller than previously thought, resulting in statistically underpowered studies, inflated effect sizes and replication failures at typical sample sizes. As sample sizes grew into the thousands, replication rates began to improve and effect size inflation decreased. More robust BWAS effects were detected for functional MRI (versus structural), cognitive tests (versus mental health questionnaires) and multivariate methods (versus univariate). Smaller than expected brain-phenotype associations and variability across population subsamples can explain widespread BWAS replication failures. In contrast to non-BWAS approaches with larger effects (for example, lesions, interventions and within-person), BWAS reproducibility requires samples with thousands of individuals.


Conflict of interest statement

E.A.E., D.A.F and N.U.F.D. have a financial interest in NOUS Imaging Inc. and may financially benefit if the company is successful in marketing FIRMM motion-monitoring software products. O.M.-D., E.A.E., A.N.V., D.A.F. and N.U.F.D. may receive royalty income based on FIRMM technology developed at Washington University School of Medicine and Oregon Health and Sciences University and licensed to NOUS Imaging Inc. D.A.F. and N.U.F.D. are co-founders of NOUS Imaging Inc. and E.A.E. is a former employee of NOUS Imaging. These potential conflicts of interest have been reviewed and are managed by Washington University School of Medicine, Oregon Health and Sciences University and the University of Minnesota. The other authors declare no competing interests.

Figures

Fig. 1
Fig. 1. Effect sizes and sampling variability of univariate brain-wide associations.
ABCD Study sample data (n = 3,928). a, b, Effect sizes were estimated using standard correlations (bivariate linear r). Brain-wide association histograms (normalized to per panel maximum bin) of cortical thickness with cognitive ability (left, green) and psychopathology (right, purple) at all levels of analysis (vertex, ROI and network; for separated levels of analysis see Supplementary Fig. 2a, b) (a), and RSFC with cognitive ability (left, green) and psychopathology (right, purple) at all levels of analysis (edge, network and component) (b). c, d, The largest brain-wide associations (ROI, top 10%) for cortical thickness with cognitive ability (left, green) and psychopathology (right, purple) (c), and RSFC with cognitive ability (left, green) and psychopathology (right, purple) (d). e, f, Sampling variability (1,000 resamples per sample size in logarithmically spaced bins: n = 25, 33, 50, 70, 100, 135, 200, 265, 375, 525, 725, 1,000, 1,430, 2,000, 2,800 and 3,604 (3,928 for cortical thickness)) of the largest brain-wide association for each brain–behavioural phenotype pair, for cortical thickness with cognitive ability (left, green) and psychopathology (right, purple) (e), and RSFC with cognitive ability (left, green) and psychopathology (right, purple) (f). Solid lines represent the mean across 1,000 resamples. Shading represents the minimum to maximum correlation range across subsamples, for a given sample size. Grey dashed line represents the 95% confidence interval and the black dashed line represents the 99% confidence interval. f, g, Examples of two n = 25 subsamples, in which inaccurate default mode network (DMN) correlations were observed for cortical thickness with cognitive ability (left, green) and psychopathology (right, purple) (g), and RSFC with cognitive ability (left, green) and psychopathology (right, purple) (h). Black dashed line denotes linear fit from full sample. Source data
Fig. 2
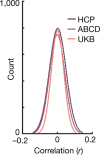
Fig. 2. Effect sizes of brain-wide associations are consistent across the largest neuroimaging study samples.
Univariate BWAS effect sizes from correlations (linear bivariate r) between fluid intelligence and edge-wise RSFC are shown for HCP, ABCD and UKB study samples. The ABCD (n = 3,928) and UKB (n = 32,572) datasets were subsampled (with replacement) 100 times to match the HCP sample size (n = 900), revealing consistent effect sizes (medians: HCP |r| = 0.03, ABCD |r| = 0.03, UKB |r| = 0.02). See Extended Data Fig. 5 for UKB resampling to both ABCD and HCP sample sizes. Source data
Fig. 3
Fig. 3. Statistical errors and reproducibility of univariate brain-wide associations.
Data from ABCD Study sample (n = 3,928; see Supplementary Fig. 9 for UKB). a, False negative rates (relative to full sample; see Methods, ‘False positives, false negatives and power’) for correlations (bivariate linear r) between psychological phenotypes and brain features (cortical thickness: vertex-wise; RSFC: edge-wise) as a function of sample size and two-tailed P value (P value thresholding was identical in full sample and subsamples; same P values used in cf). b, Magnitude error rates for three levels of effect size inflation (50%, 100% and 200%) as a function of sample size and statistical threshold (P < 0.05 and P < 10−7 (Bonferroni-corrected); P value threshold was the same in full sample and subsamples). c, Sign error rates reported as the percentage of subsamples with the opposite sign as the full sample, as a function of sample size and P value. d, Statistical power of subsamples relative to full sample (same sign, both significant) as a function of sample size and P value. e, Probability of replicating (same sign, both significant) a univariate brain–phenotype association out-of-sample across P values (note: data end at n ≈ 2,000, as the replication sample is half of the full sample). Replication rates follow the square of power. f, False positive rates of subsamples relative to the full sample as a function of sample size and P value. Source data
Fig. 4
Fig. 4. Multivariate brain-wide associations.
af, In-sample brain–behavioral phenotype associations as a function of out-of-sample associations and sample size. Mean multivariate brain–behavioral phenotype associations across 100 bootstrap samples at n = 200 (red dots) and for the full sample (black dots). Grey dashed lines represent the significance threshold for out-of-sample correlations (>99% confidence interval of permutations), determined on the full sample (see Methods, ‘Multivariate out-of-sample replication’). Data are from the ABCD Study; full sample sizes: cortical thickness n = 1,814; RSFC n = 1,964. a, b, For SVR, out-of-sample association strength is reported as the correlation between predicted and observed phenotype scores (rpred) using models trained on the discovery set. SVR of cortical thickness (a) and RSFC (b), with cognitive ability (green, left) and psychopathology (purple, right). c, d, For CCA, out-of-sample association strength is reported as the correlation of phenotypic and brain scores in the first canonical variate pair (rCV1) when discovery set weights are applied to the replication set. CCA of cortical thickness (c) and RSFC (d), with all NIH Toolbox (green, left) and CBCL (purple, right) subscales. e, Differences between out-of-sample (SVR: rpred; CCA: rCV1) and corresponding in-sample associations by multivariate method (left), imaging modality (middle) and behavioural phenotype (right); normalized to per-panel maximum. On average, out-of-sample associations (mean r = 0.17) were smaller (∆r = −0.29; 63% reduction) than in-sample associations (mean r = 0.46), similar to replication effect size reductions in cancer biology and psychology. f, SVR out-of-sample association (rpred) as a function of univariate effect size (r; top 1% for each phenotype) across the 41 phenotypes (bivariate linear r = 0.79, orange line). Source data
Extended Data Fig. 1
Extended Data Fig. 1. Distributions of brain-wide association effect sizes by imaging modality and behavioral phenotype.
Histograms of all (a) cortical thickness and (b) resting-state functional connectivity (RSFC) associations, with demographic, cognitive, and mental health/personality variables. Correlations (r; linear bivariate) between brain measures and behavioral phenotypes were computed at multiple levels of scale (cortical thickness: vertices, regions of interest (ROIs), networks; RSFC: ROI-ROI pairs (edges), principal components, networks). The ordering of subgraphs follows the ordering of measures in the legend. All data shown are from the ABCD Study (n = 3,928).
Extended Data Fig. 2
Extended Data Fig. 2. Impact of sociodemographic covariates on brain-wide association effect sizes.
The influence of sociodemographic covariates (race, gender, parental marital status, parental income, hispanic versus non-hispanic ethnicity, family, data collection site) on BWAS (brain-wide association studies) effect sizes was examined in the ABCD Study dataset (n = 3,587 with complete cases for this analysis) through the model comparison strategy developed by the ABCD Data Analysis and Informatics Core and used in the Data Exploration and Analysis Portal (deap.nimhda.org). The percentages of variance explained by fixed effects in multilevel models (pseudo-R2) were calculated with the MuMIn package in R (1.43.17) and square root transformed to approximate an absolute-value BWAS correlation (|r|). The estimated BWAS effect sizes (|r|) prior to covariate adjustment are plotted on the x-axis and those after sociodemographic covariate adjustment on the y-axis. Values below the identity line indicate a reduction in effect size after covariate adjustment, values above an increase in effect size. BWAS models with and without covariate adjustment always included cognitive ability or psychopathology as the outcome variable and nested random effects of family and data collection site, in order to maximize comparability for subsequent fixed effects model comparisons. BWAS effect sizes without covariate adjustment were taken from models that only included these random effects, the brain feature of interest (cortical thickness [vertex]/RSFC [edge]) as a single fixed effect, and the psychological phenotype (cognitive ability/psychopathology). BWAS effect sizes without covariate adjustment estimated the unique, covariate-adjusted effect linking the brain feature of interest to the psychological phenotype by comparing a model with sociodemographic fixed effects but no brain feature fixed effect, to one with both the sociodemographic fixed effects and the brain feature. The difference in pseudo-R2 (subsequently transformed to |r|) represents the additional fixed-effect variance the brain feature explained beyond the sociodemographic covariates.
Extended Data Fig. 3
Extended Data Fig. 3. Brain-wide association effect sizes derived from functional MRI (fMRI) task activations are similar to resting-state functional connectivity (RSFC).
(a) Cognitive ability (NIH Toolbox total composite score) plotted as a function of dorsal attention network working memory task activation (z). Note that this correlation with fMRI task activation (r = 0.34) is much larger than the largest replicated univariate effect size for RSFC. (b) Cognitive ability plotted as a function of working memory task accuracy. Individual differences in cognitive ability (phenotype of interest) are strongly correlated with individual differences in working memory (r = 0.54). Thus, task-specific effects (behavioral performance) confound links between brain function and the phenotype of interest (e.g. cognitive ability). (c) Residualizing the behavioral phenotype of interest (cognitive ability) with respect to individual differences in working memory task accuracy (task-specific effect) produces an association between task fMRI and cognitive ability (r = 0.14) similar to the (d) the association between dorsal attention network RSFC and cognitive ability (r = 0.11). Data shown are from the HCP Study (n = 844).
Extended Data Fig. 4
Extended Data Fig. 4. Split-half reliability of resting-state functional connectivity (RSFC) in HCP, ABCD and UKB study samples.
Distribution of within-person split-half reliability of ROI (333 cortical ROIs from Gordon et al.) connectivity matrices derived from RSFC data. The UKB data contain a single 6 min. resting-state run; the ABCD Study collected 4 x 5 min. runs (20 min. total), and the HCP collected 4 x 15 min. runs of resting-state data (60 min. total).
Extended Data Fig. 5
Extended Data Fig. 5. Effect size distributions for HCP, ABCD, UKB studies and expected sampling variability.
To determine whether smaller effect sizes in larger samples can be explained by the expected reduction of sampling variability, we estimated sampling variability (grey) for the full range of BWAS (brain-wide association studies) effect sizes observed in UKB (edge-wise resting-state functional connectivity [RSFC]; cognitive ability) as a function of sample size (x-axis). As in our primary ABCD analyses, UKB effects were resampled using a bootstrap procedure (1,000 iterations per edge). The actual distributions of the HCP, ABCD, and UKB BWAS effect sizes were then visualized relative to the expected sampling variability in UKB across sample sizes (grey). Consistent with an inflation of BWAS effect sizes due to sampling variability, relatively larger BWAS effect sizes in HCP (n = 900) and ABCD (n = 3,928) align with effect sizes in subsamples of the UKB data at corresponding sample sizes.
Extended Data Fig. 6
Extended Data Fig. 6. Comparison of single- and multi-site BWAS (brain-wide association studies) sampling variability.
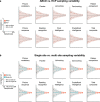
(a) Sampling variability of resting-state functional connectivity (RSFC) associations with the NIH Toolbox subscales in equally-sized samples (n = 877) from HCP (grey) and ABCD (red). Effect sizes (center of error bands) were matched across datasets (r = 0.06) to isolate sampling variability for a given effect. (b) Sampling variability of RSFC associations with the NIH Toolbox subscales in a single-site ABCD sample (site 16; n = 603; teal) and every other ABCD site (n = 3,325; red). Effect sizes (center of error bands) were matched across datasets (r = 0.06).
Extended Data Fig. 7
Extended Data Fig. 7. Relationship between power and statistical threshold.
Statistical power (1 – false negative rate) is plotted as a function of the P value (two-tailed; < 0.05, < 10−2, < 10−3, < 10−4, < 10−5, < 10−6, < 10−7) used for significance testing in the denoised ABCD Study sample (n = 3,928). P < 0.05 represents an uncorrected threshold, whereas P < 10−7 represents a Bonferroni correction. More stringent control for multiple comparisons decreases power and increases sample size requirements.
Extended Data Fig. 8
Extended Data Fig. 8. Inflation of univariate BWAS (brain-wide association studies) effect sizes (top 1% largest) by imaging modality and behavioral phenotype.
Better out-of-sample replication is indexed by a smaller difference between the discovery and replication datasets effect sizes (right side of histogram). Negative values indicate that an association was inflated in the discovery dataset, relative to what was observed in the replication dataset. Out-of-sample reductions in effect sizes greater than 100% reflect sign errors. The leftward shift of cortical thickness relative to resting-state functional connectivity (RSFC), and for psychopathology relative to cognitive ability indicates worse univariate BWAS reproducibility.
Extended Data Fig. 9
Extended Data Fig. 9. Influence of sample size on the robustness of brain-wide associations.
Trajectories of sampling variability (99% confidence interval; orange), statistical error rates (cumulative sum of false negatives, false positives, magnitude errors, sign errors; yellow), and support vector regression (SVR) out-of-sample association strength (as % of full in-sample association; dark red) as a function of sample size. Sample size (n ~ 4,000) represents a full sample (discovery + replication datasets of ~2,000 each). Data shown are from ABCD Study.
Extended Data Fig. 10
Extended Data Fig. 10. Sampling variability is nearly identical when considering singletons vs. all participants.
Data were from the ABCD Study sample. Sampling variability (y-axis) as a function of sample size (x-axis; n = 25, 35, 45, 60, 80, 100, 145, 200, 256, 350, 460, 615, 825, 1,100, 1,475, 2,000) for all participants (black) and singletons only (twins and siblings excluded; green). Sampling variability was quantified as the difference between the upper and lower 95% confidence interval across 1,000 bootstraps (resampled with replacement) across all 77,421 resting-state functional connectivity (RSFC; edges) associations with cognitive ability. The effect size magnitudes were likewise nearly identical in size-matched resamples (singletons-only [n = 2,528]: median |r| = 0.017; siblings-included [n = 2,528]: median |r| = 0.020).

Comment in

References

    1. Raichle ME, et al. A default mode of brain function. Proc. Natl Acad. Sci. USA. 2001;98:676–682. doi: 10.1073/pnas.98.2.676. - DOI - PMC - PubMed
    1. Wagner AD, et al. Building memories: remembering and forgetting of verbal experiences as predicted by brain activity. Science. 1998;281:1188–1191. doi: 10.1126/science.281.5380.1188. - DOI - PubMed
    1. Buckner RL, et al. Detection of cortical activation during averaged single trials of a cognitive task using functional magnetic resonance imaging. Proc. Natl Acad. Sci. USA. 1996;93:14878–14883. doi: 10.1073/pnas.93.25.14878. - DOI - PMC - PubMed
    1. Szucs D, Ioannidis JP. Sample size evolution in neuroimaging research: an evaluation of highly-cited studies (1990-2012) and of latest practices (2017-2018) in high-impact journals. Neuroimage. 2020;221:117164. doi: 10.1016/j.neuroimage.2020.117164. - DOI - PubMed
    1. Button KS, et al. Power failure: why small sample size undermines the reliability of neuroscience. Nat. Rev. Neurosci. 2013;14:365–376. doi: 10.1038/nrn3475. - DOI - PubMed

Grants and funding