. 2022 Dec 20;33(2):469-485.
doi: 10.1093/cercor/bhac078.

Novelty-induced frontal-STN networks in Parkinson's disease

Affiliations

Novelty-induced frontal-STN networks in Parkinson's disease

Rachel C Cole et al. Cereb Cortex. .

Abstract

Novelty detection is a primitive subcomponent of cognitive control that can be deficient in Parkinson's disease (PD) patients. Here, we studied the corticostriatal mechanisms underlying novelty-response deficits. In participants with PD, we recorded from cortical circuits with scalp-based electroencephalography (EEG) and from subcortical circuits using intraoperative neurophysiology during surgeries for implantation of deep brain stimulation (DBS) electrodes. We report three major results. First, novel auditory stimuli triggered midfrontal low-frequency rhythms; of these, 1-4 Hz "delta" rhythms were linked to novelty-associated slowing, whereas 4-7 Hz "theta" rhythms were specifically attenuated in PD. Second, 32% of subthalamic nucleus (STN) neurons were response-modulated; nearly all (94%) of these were also modulated by novel stimuli. Third, response-modulated STN neurons were coherent with midfrontal 1-4 Hz activity. These findings link scalp-based measurements of neural activity with neuronal activity in the STN. Our results provide insight into midfrontal cognitive control mechanisms and how purported hyperdirect frontobasal ganglia circuits evaluate new information.

Keywords: cognitive control; neuronal coherence; neuronal spiking; oddball task; prefrontal cortex.


Figures

Fig. 1
Fig. 1
Novelty slows responses more for PD participants than controls. A) The cross-modal oddball distractor task consisted of trials with an arrow preceded by either a standard tone (80% of trials) or a novel sound (10%; of note, 10% of trials used a novel visual stimulus; these trials were not analyzed). The arrow required a left “q” or right “p” key press, based on the direction. B) Reaction time for control and PD participants; each dot represents an individual’s median RT and the thick horizontal bar represents group medians. Novel oddball stimuli disproportionately distracted PD participants. Compared to control participants, PD participants responded more slowly to the arrow on trials when a novel sound was presented relative to a standard tone. * indicates a significant main effect of sound type (standard vs novel) on reaction time. # indicates a significant interaction between sound type and group (control vs PD) on reaction time via a linear mixed-effects model. C) Novelty-related slowing across blocks for control and PD participants; * indicates a significant main effect of block on reaction time. # indicates a significant interaction between block and group (control vs PD) on reaction time via a linear mixed-effects model. D) Cognitive function as measured by the Montreal Cognitive Assessment (MoCA) did not significantly correlate with novelty-related slowing (as a percentage relative to reaction time on standard trials). E) UPDRS Part 3 did not significantly correlate with novelty-related slowing (again as a percent) in PD participants.
Fig. 2
Fig. 2
Novelty boosts midfrontal ~ 4-Hz power, which is attenuated in PD. A) Average event-related potentials for trials with standard tones (top row) and novel sounds (bottom row) for controls (blue line) and PD participants (red line). B) Time–frequency power spectrograms for standard tones (top panels), novel sounds (middle panels), and novel– standard (bottom panels) for control and C) PD, and D) Subtraction of control–PD. The red box in D (middle panel) represents the delta-band region-of-interest (ROI) (1–4), while the blue box represents the theta-band ROI (4–7 Hz) 300–400 ms after the cue. Sounds and cues indicated above panel; approximate median RT indicated by vertical white line. E) Topographical representation of the comparison of theta power between controls and PD participants (control–PD) for standard tones (top panel) and novel sounds (middle panel). Data from 50 PD and 35 control participants.
Fig. 3
Fig. 3
1–4 Hz delta rhythms are linked with novelty-related slowing, and 4–7 Hz theta rhythms are attenuated in PD. A) Power in a priori delta tf-ROI (1–4 Hz; 300–400 ms after cue) for control and PD participants; each dot represents an individual’s mean power and the thick horizontal bars represent group medians. A linear mixed-effects model revealed a significant main effect of sound type (novel vs standard), denoted by *. B) Power in a priori theta tf-ROI (4–7 Hz; 300–400 ms after cue) for control and PD participants. A linear mixed-effects model revealed a significant interaction between sound type and group on power in this ROI, denoted by #, and a significant main effect of sound type (novel vs standard), denoted by *. Compared to control participants, PD participants experienced a smaller increase in theta power on trials when a novel sound was presented relative to a standard tone. C) For the delta tf-ROI, there was a significant relationship between novelty-related slowing (as a percent change relative to reaction time on standard trials) and delta power across all participants, but D) for the theta tf-ROI, this relationship did not achieve significance. Data from 85 participants (35 control and 50 PD).
Fig. 4
Fig. 4
Intraoperative recordings of novelty-related responses. A) Auditory 3-tone oddball task performed by patients with PD in operating room during deep brain stimulation surgery. Patients responded to standard tones (50% of trials) and novel sounds (20% of trials) with a right-hand response using a hand-held Kinesis pedal; an additional trial type with a constant stimulus required a left response and was not analyzed. B) Reaction times for standard tones and novel oddball sounds; each dot represents individual median reaction times, and thicker horizontal lines represent group median reaction times. No significant differences for reaction times between groups were found. Data from 18 PD patient-volunteers during intraoperative neurophysiology.
Fig. 5
Fig. 5
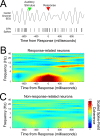
Recording simultaneously from frontal lobe and STN during surgery. A) Schematic of surgical recording with three frontal scalp-based electrodes (center, right, and left channels), and STN microelectrode recordings. B) Time–frequency plots of activity from the center channel for standard and novel sounds in the auditory 3-tone oddball task. Data from 18 PD patient-volunteers undergoing DBS implantation surgery. Sounds indicated above panel and by white dotted line; approximate RT indicated by vertical white line. D) Waveforms from a single STN neuron indicating that neuronal waveforms of voltage vs time were stable over ~6 min. E) Response-locked perievent raster of neuronal firing from an exemplar neuron; the top panel is a periresponse raster, with each row representing one trial and each tick representing an action potential. The bottom panel represents a perievent histogram of firing rate around all responses.
Fig. 6
Fig. 6
STN neurons had prominent response modulations. A) Average z-scored activity of all 54 STN neurons around responses; neurons are sorted by the loading of the first principal component (PC1). B) Trial-by-trial generalized linear models of firing rate vs auditory stimuli and response revealed that STN neurons were more strongly modulated by response than auditory stimuli; *indicates significance via a χ2 test. C) Principal component analysis (PCA), a data-driven approach to identify neuronal patterns across an ensemble, revealed that principal components 1 and 2 (PC1 and PC2) explained 63% of variance among STN ensembles. D) PC1 and PC2 were modulated around response. Data from 54 STN neurons in 17 PD patient-volunteers.
Fig. 7
Fig. 7
Most response-related neurons in the subthalamic nucleus were modulated by novelty. A) Example raster of neuronal spiking from one novelty-modulated neuron on trials with novel auditory stimuli (red) or standard auditory stimuli (black). B) We recorded from 54 STN neurons. Of these, 17 STN neurons had response-modulations. About 16 of these 17 neurons were modulated by novelty and response (30% of the total), and 1 was modulated by response only (2% of the total). Data recorded in 17 patient-volunteers.
Fig. 8
Fig. 8
Response-related STN neurons had low-frequency coherence with frontal EEG. A) An example time series from a single trial of center channel EEG and STN spiking activity; the auditory stimuli is denoted via a green triangle, and response is denoted via a red triangle. This neuron becomes coherent immediately with midfrontal low-frequency oscillations after the auditory stimuli and prior to response. B) Across all 17 response-related STN neurons, there was significantly more 1–4 Hz spike-field coherence with center-channel EEG electrodes than for C) 37 nonresponse-related STN neurons. Spike-field coherence is scaled with 1 representing the 95% confidence-interval for coherence for comparison across neurons. Data from 54 STN neurons in 17 PD patient-volunteers.

References

    1. Alegre M, Lopez-Azcarate J, Obeso I, Wilkinson L, Rodriguez-Oroz MC, Valencia M, Garcia-Garcia D, Guridi J, Artieda J, Jahanshahi M, et al. The subthalamic nucleus is involved in successful inhibition in the stop-signal task: a local field potential study in Parkinson’s disease. Exp Neurol. 2013:239(1):1–12. 10.1016/j.expneurol.2012.08.027. - DOI - PubMed
    1. Andrés P, Parmentier FBR, Escera C. The effect of age on involuntary capture of attention by irrelevant sounds: a test of the frontal hypothesis of aging. Neuropsychologia. 2006:44(12):2564–2568. 10.1016/j.neuropsychologia.2006.05.005. - DOI - PubMed
    1. Benjamini Y, Yekutieli D. The control of the false discovery rate in multiple testing under dependency. Ann Stat. 2001:29(4):1165–1188 https://www.jstor.org/stable/2674075.
    1. Bentley JN, Irwin Z, Black SD, Roach ML, Vaden RJ, Gonzalez CL, Khan AU, El-Sayed GA, Knight RT, Guthrie BL, et al. Subcortical intermittent Theta-Burst Stimulation (iTBS) increases theta-power in Dorsolateral Prefrontal Cortex (DLPFC). Front Neurosci. 2020:14(January):1–10. 10.3389/fnins.2020.00041. - DOI - PMC - PubMed
    1. Bočková M, Chládek J, Jurák P, Halámek J, Baláž M, Rektor I. Involvement of the subthalamic nucleus and globus pallidus internus in attention. J Neural Transm. 2011:118(8):1235–1245. 10.1007/s00702-010-0575-4. - DOI - PubMed

Publication types