. 2022 Apr 13;96(7):e0199521.
doi: 10.1128/jvi.01995-21. Epub 2022 Mar 17.

The Human Liver-Expressed Lectin CD302 Restricts Hepatitis C Virus Infection

Affiliations

The Human Liver-Expressed Lectin CD302 Restricts Hepatitis C Virus Infection

Birthe Reinecke et al. J Virol. .

Abstract

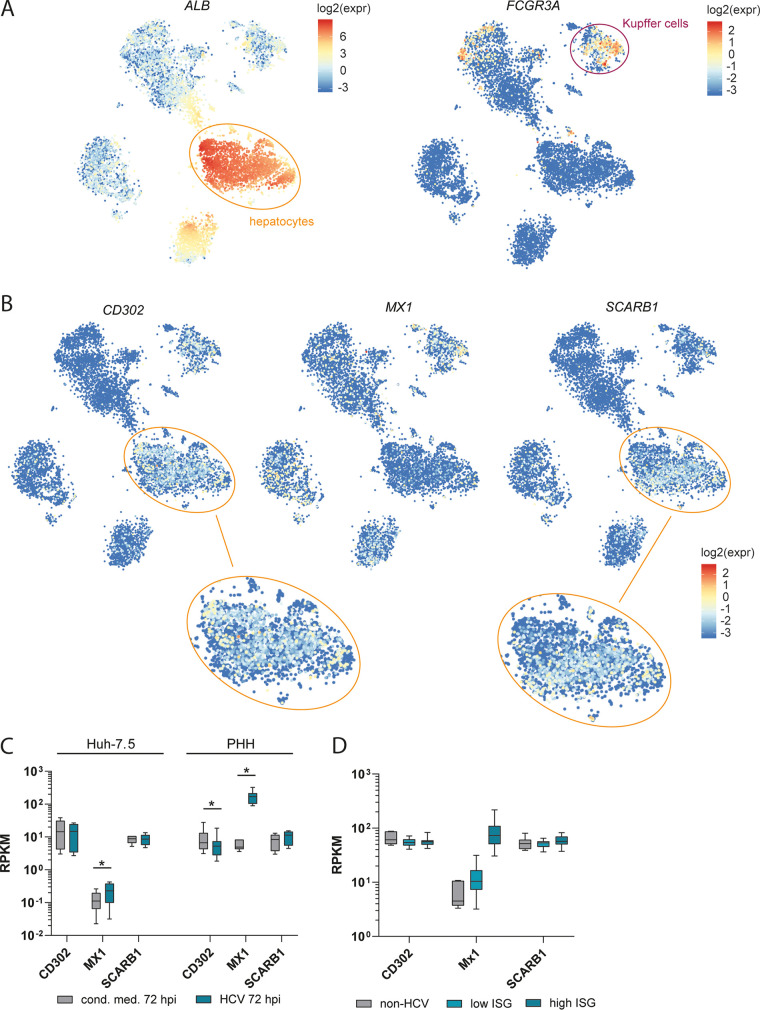
C-type lectin domain-containing proteins (CTLDcps) shape host responses to pathogens and infectious disease outcomes. Previously, we identified the murine CTLDcp Cd302 as restriction factor, limiting hepatitis C virus (HCV) infection of murine hepatocytes. In this study, we investigated in detail the human orthologue's ability to restrict HCV infection in human liver cells. CD302 overexpression in Huh-7.5 cells potently inhibited infection of diverse HCV chimeras representing seven genotypes. Transcriptional profiling revealed abundant CD302 mRNA expression in human hepatocytes, the natural cellular target of HCV. Knockdown of endogenously expressed CD302 modestly enhanced HCV infection of Huh-7.5 cells and primary human hepatocytes. Functional analysis of naturally occurring CD302 transcript variants and engineered CD302 mutants showed that the C-type lectin-like domain (CTLD) is essential for HCV restriction, whereas the cytoplasmic domain (CPD) is dispensable. Coding single nucleotide polymorphisms occurring in human populations and mapping to different domains of CD302 did not influence the capacity of CD302 to restrict HCV. Assessment of the anti-HCV phenotype at different life cycle stages indicated that CD302 preferentially targets the viral entry step. In contrast to the murine orthologue, overexpression of human CD302 did not modulate downstream expression of nuclear receptor-controlled genes. Ectopic CD302 expression restricted infection of liver tropic hepatitis E virus (HEV), while it did not affect infection rates of two respiratory viruses, including respiratory syncytial virus (RSV) and the alpha coronavirus HVCoV-229E. Together, these findings suggest that CD302 contributes to liver cell-intrinsic defense against HCV and might mediate broader antiviral defenses against additional hepatotropic viruses. IMPORTANCE The liver represents an immunoprivileged organ characterized by enhanced resistance to immune responses. However, the importance of liver cell-endogenous, noncytolytic innate immune responses in pathogen control is not well defined. Although the role of myeloid cell-expressed CTLDcps in host responses to viruses has been characterized in detail, we have little information about their potential functions in the liver and their relevance for immune responses in this organ. Human hepatocytes endogenously express the CTLDcp CD302. Here, we provide evidence that CD302 limits HCV infection of human liver cells, likely by inhibiting a viral cell entry step. We confirm that the dominant liver-expressed transcript variant, as well as naturally occurring coding variants of CD302, maintain the capacity to restrict HCV. We further show that the CTLD of the protein is critical for the anti-HCV activity and that overexpressed CD302 limits HEV infection. Thus, CD302 likely contributes to human liver-intrinsic antiviral defenses.

Keywords: hepatitis C virus; hepatitis E virus; lectin; mechanism; polymorphism; transcript variant.


Conflict of interest statement

The authors declare no conflict of interest.

Figures

FIG 1
FIG 1
Ectopic expression of CD302 restricts infection by HCV chimeras representing genotypes 1 to 7. (A, Left) Huh-7.5 cells stably overexpressing CD302 or the empty control vector were infected with Jc1 wild type (WT), a GT2a J6-JFH1 chimera. Supernatants of these cells were collected 72 h postinfection (hpi), and infectious viruses present in these supernatants were titrated by using a limiting dilution assay. (A, Middle) The same cell lines were infected with an HCV Renilla luciferase reporter virus (JcR2a), and Renilla luciferase (Rluc) counts were determined at 72 hpi. Huh-7.5 cells ectopically expressing a firefly luciferase (Fluc) gene and stably overexpressing CD302 or the empty control vector were infected with JcR2a and Fluc, and Rluc counts were determined at 72 hpi (A, Right). Data represent means and standard deviation (SD) of three independent biological replicates normalized to the empty vector control. P values are shown and calculated with one-tailed t test for each panel. TCID50/mL, 50% tissue culture infectious dose. (B) Huh-7.5 cells stably overexpressing CD302 or an empty control vector were infected with luciferase-expressing HCV chimeras (GT 1 to 7), and Rluc counts were determined at 72 hpi. Data represent means and SD of three biological replicates. P values are shown as determined by multiple t tests with correction for multiple comparisons (FDR [q] < 0.05 for each comparison). The background of the assay was defined as mean of uninfected cells at 1.5 × 103 Rluc counts. (C) Protein structure of CD302 as predicted by the AlphaFold model (48). pLDDT, predicted local distance difference test. (D and E) Detection of CD302 protein expression in given cell lines as determined by confocal microscopy (D) and FACS (E). (E, Top) CD302 protein expression at the cell surface with different controls. (E, Bottom) Comparison between cell surface staining and total cellular expression measured in detergent-permeabilized cells.
FIG 2
FIG 2
Endogenous and HCV-dependent mRNA expression of CD302 in primary human liver cells. (A and B) T-distributed stochastic neighbor-embedding (t-SNE) plots highlighting mRNA expression of given genes across all cells of healthy human liver tissue (31). The color of each cell represents the gene expression according to the corresponding legend as log2 value of the expression. (A) Orange and magenta circles depict hepatocyte and Kupffer cell compartments, respectively (as defined previously [31]). (A, Left) ALB gene expression, a hepatocyte marker. (A, Right) FCGR3A gene expression, a marker for Kupffer cells. (B, Top) t-SNE plots depict SCARB1, MX1, and CD302 mRNAs with single cell resolution. (B, Bottom) Hepatocyte compartments of SCARB1 and CD302 expression plots are enlarged. (C) Bulk transcriptional profiling of Huh-7.5 cells and PHHs. Box plot shows the expression of given mRNAs in Huh-7.5 cells and PHHs at 72 hpi with HCV (GT2a J6-JFH1 chimera Jc1) or upon treatment with conditioned medium (cond.med.) (13). *, FDR P < 0.05, determined by CLC Workbench (Qiagen). RPKM, reads per kilobase per million. (D) Gene expression levels in liver biopsy samples. Liver biopsy specimens derived from patients infected with HCV or non-HCV controls (32). HCV-infected samples were grouped into samples of low or high IFN-stimulated gene (ISG) responders depending on the expression of an ISG subset.
FIG 3
FIG 3
Endogenously expressed CD302 limits HCV infection of human hepatocytes. (A) Absolute quantification of CD302 transcript copy numbers in cell lines, PHHs, and total liver. RNA from murine hepatocytes and equine liver was used as controls for primer specificity. A plasmid containing the CD302 open reading frame (ORF) was serially diluted to generate a standard curve for RT-qPCR. (B) CD302 silenced or control esiRNA-treated Huh-7.5 cells were infected with the GT2a J6 JcR2a reporter virus. Luciferase activity was measured 48 h later and is shown relative to the values detected in control esiRNA-treated infected cells. Means and SD of three biological replicates are given. Cells were pretreated with esiRNAs for 48 h before inoculation. (C) FACS analysis of CD302 cell surface expression 48 h after transfection with given esiRNAs. Cells stained with the control IgG antibody instead of an anti-CD302 antibody served as control. (D and E) CD302 silencing followed by HCV infection of primary human hepatocytes (PHHs). Ruxolitinib-treated PHHs were transfected with CD302 targeting or control esiRNAs for 48 h and were subsequently infected with Jc1 wt at an MOI of 1 to 1.4 for 72 h. (D) De novo infectious virus production into the culture fluid was quantified by using a limiting dilution infection assay with Huh-7.5 cells as target cells. Mean values of TCID50/mL of experiments with four independent human donors are given. P values shown above bars were determined by one-tailed t test from n = 4 biological replicates. (E) Relative CD302 mRNA expression was measured by RT-qPCR. Cell lysates were collected at the time point of virus inoculation (48 h post-esiRNA transfection). Relative CD302 expression was calculated by the 2−ΔΔCT method.
FIG 4
FIG 4
Impact of natural CD302 genetic variation on HCV restriction. (A) Overview of SNPs in the Exome Aggregation Consortium (ExAC) cohort. Gene schematic visualizes the location of intron-exon boundaries in the hg19 genome assembly. Gray, black, or blue circles mark SNPs at their genome position and depending on their minor allele frequency (MAF). All assayed SNPs represent nonsynonymous mutations. (B) Amino acid changes induced by assayed SNPs. Brackets next to the SNP number refer to the amino acid change and its position in the encoded protein. Vertical black lines highlight locations of SNP-induced mutations in the protein. SP, signal peptide; CTLD, C-type lectin domain; S, spacer; TM, transmembrane domain; CPT, cytoplasmic tail. Right panel displays CPT amino acid sequences of wild type (top) compared to indel 5 (bottom). (C) Comparable HCV restriction ability of CD302 variants and the wild-type protein. Cells ectopically expressing the indicated variants were infected with GT2a J6 JcR2a for 72 h, and luciferase signal was measured. (D) Protein expression in overexpressing cells analyzed by FACS.
FIG 5
FIG 5
HCV restriction of CD302 transcript variants and their expression in primary human hepatocytes. (A) Overview of encoded proteins from different CD302 transcript variants (tv). Dashed arrows indicate missing amino acids as displayed above compared to the full-length protein (tv1). SP, signal peptide; CTLD, C-type lectin-like domain; S, spacer; TM, transmembrane domain; CPT, cytoplasmic tail. (B) Transcript expression levels in different PHH donors (D1 to D7) with or without HCV infection ex vivo (13). Plus signs above heatmap indicate whether a sample was infected with HCV and at which time point samples were taken for further analysis. (C and D) Transcript variants differently restrict HCV infection. Huh-7.5 cells overexpressing the different transcript variants were infected with GT2a J6 JcR2a for 72 h, and luciferase counts were measured. Overexpression of proteins in Huh-7.5 cells was measured by FACS. (E) Overview of protein composition of different deletion mutants. Dashed arrows indicate deleted amino acids as displayed above compared to the full-length protein (tv1). (F to H) Deletion of functional domains impact protein function. Either the CTLD or the CPT was deleted, and their restriction ability was compared to the WT protein upon ectopic expression in Huh-7.5 cells. HA-tagged variants were generated to confirm protein expression and functional relevance. Protein expression upon overexpression in Huh-7.5 cells was measured by FACS. Adjusted P values are indicated above bars and were determined by one-way analysis of variance (ANOVA) with Tukey test to correct for multiple comparisons. (I) Relative mRNA transcript dysregulation mediated by ectopic human CD302 or murine Cd302 expression. Cell lysates were collected from different Huh-7.5 cell passages ectopically expressing either an empty lentivirus, human CD302, or murine Cd302. Genes were selected based on their degree of dysregulation as previously reported (20). Changes in gene expression are relative to empty control cells and were determined via RT-qPCR and the 2−ΔΔCT method.
FIG 6
FIG 6
Effect of CD302 on different steps of the HCV life cycle. (A) Lentiviral pseudoparticles harboring J6 envelope proteins were produced and used to infect indicated overexpressing cell lines. At 72 hpi, firefly luciferase measurement was performed. Adjusted P values are indicated above the bars and calculated by one-way ANOVA with Dunnett’s test for multiple comparisons based on normalized values as presented in the graph. (B) For pseudoparticle production, HEK 293T cells were cotransfected with J6 E1E2 and CD302 or empty vector expression plasmids. Pseudoparticles were used to infect Huh-7.5 cells for 72 h. The P values are presented above bars and were determined by a one-tailed t test based on normalized values as presented in the graph. (A and B) Fluc counts were normalized to pseudoparticles produced with an empty vector (pcDNA/-env) instead of the J6 E1E2-encoding plasmid. (C) JFH1 subgenomic replicon or its replication-deficient ΔGDD mutant were electroporated into overexpressing Huh-7.5 cells and Fluc counts measured after 4, 24, 48, and 72 h postelectroporation (hpe). Fluc counts were normalized to 4-h time point. (D) Transcript RNA encoding full-length JcR2a was electroporated into Huh-7.5 (empty) and (CD302) cells, and half of the seeded cells were treated with 2′CMA inhibiting replication (data not shown). Cells were harvested at several time points post electroporation, and Rluc was measured. P-values are shown as determined by multiple t-test with correction for multiple comparisons (FDR (Q) < 0.05 only at 24 hpe). (E) Supernatants from electroporated cells were harvested at time points shown in panel D and used to infect Huh-7.5 (Fluc) cells for 72 h. (A to E) Results show 3 to 4 biological replicates.
FIG 7
FIG 7
Influence of ectopic CD302 expression on other viruses. (A) Huh-7.5 overexpression cell lines were infected with a luciferase expressing RSV-A virus (51) at an MOI of 0.1 for 4 h. Forty-eight hours postinfection, cells were lysed, and Fluc counts were measured. Results from three independent experiments are given. (B) Huh-7.5 (empty and CD302) cells were infected with human coronavirus 229E (HCoV-229E) for 48 h until luciferase measurement. The mean and SD of three biological replicates are shown. (C, Left) Protein expression in HepG2/3CA cells either expressing CD302 or an empty vector control. (C, Right) Corresponding HEV genotype (gt) 3 infection measured as focus-forming units (FFU) per well. The graph shows three biological replicates with mean and SD. The P-value is indicated above the bars and was determined by a two-tailed t test. dpi, days post infection.

References

    1. World Health Organization. 2017. Global viral hepatitis report, 2017. World Health Organization, Geneva, Switzerland.
    1. Midgard H, Bjøro B, Mæland A, Konopski Z, Kileng H, Damås JK, Paulsen J, Heggelund L, Sandvei PK, Ringstad JO, Karlsen LN, Stene-Johansen K, Pettersson JH-O, Dorenberg DH, Dalgard O. 2016. Hepatitis C reinfection after sustained virological response. J Hepatol 64:1020–1026. 10.1016/j.jhep.2016.01.001. - DOI - PubMed
    1. Pawlotsky JM. 2016. Hepatitis C virus resistance to direct-acting antiviral drugs in interferon-free regimens. Gastroenterology 151:70–86. 10.1053/j.gastro.2016.04.003. - DOI - PubMed
    1. Pineda JA, Nunez-Torres R, Tellez F, Mancebo M, Garcia F, Merchante N, Perez-Perez M, Neukam K, Macias J, Real LM, HEPAVIR Group of The Andalusian Society of Infectious Diseases (SAEI). 2015. Hepatitis C virus reinfection after sustained virological response in HIV-infected patients with chronic hepatitis C. J Infect 71:571–577. 10.1016/j.jinf.2015.07.006. - DOI - PubMed
    1. Spearman CW, Dusheiko GM, Hellard M, Sonderup M. 2019. Hepatitis C. Lancet 394:1451–1466. 10.1016/S0140-6736(19)32320-7. - DOI - PubMed