. 2022 Oct 1;163(10):2021-2030.
doi: 10.1097/j.pain.0000000000002598. Epub 2022 Jan 28.

Craving of prescription opioids among veterans with chronic pain

Affiliations

Craving of prescription opioids among veterans with chronic pain

Tiffany Toor et al. Pain. .

Abstract

The United States faces a crisis because of the high prevalence of chronic pain, concurrent opioid use disorder, and overdose deaths. Prescription opioids remain a primary driver of opioid-related deaths. Craving is a core symptom of addiction, yet the degree to which craving plays a role in prescription opioid use among patients with chronic pain is unknown. Understanding the degree to which craving should be considered in patients with chronic pain is critical for developing effective interventions for supporting patients through opioid tapering. The current work combines data collected from (1) 2152 veterans screened for eligibility at a pain specialty care clinic at the San Francisco VA Health Care System and (2) medical records obtained from the VA Corporate Data Warehouse. We found that prescription opioid craving among veterans with chronic pain was low, with 66.4% of the sample reporting no craving and 33.6% reporting craving. We also found that craving had a small association with morphine equivalent daily dose and pain severity but was more strongly associated with depression. Craving of prescription opioids among veterans with chronic pain is complex. Findings are discussed in relation to chronic pain symptoms, psychiatric comorbidities, and demographics.


Conflict of interest statement

The authors present no conflicts of interest.

Figures

Figure 1:
Figure 1:
Consort Diagram of Study Flow
Figure 2:
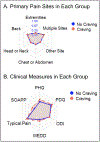
Figure 2:. Graphical Representation of Patient Reported Outcomes.
A. Primary Pain Sites in Each Group (Top) shows that primary pain sites do not significantly differ among the craving groups (c.f. text for further details). Numbers (e.g., 0.33, 0.67) refer to percentages of each group responding with a particular pain site. Multiple Sites refers to patients that responded with more than one response to their primary pain site. Other Site refers to patients that responded with their primary pain site being other than head, neck, back, chest, abdomen, or extremities; B. Clinical Measures in Each Group (Bottom) shows some between group variation in clinical and psychological measures (c.f. text and Figure 3 for further details). The axes of each clinical measure represent their independent scales (e.g., pain levels range from 0–10; SOAPP-R scores range from 0–70). PHQ-9, Patient Health Questionnaire-9. MEDD, Morphine Equivalent Daily Dose. PDQ, Pain Disability Questionnaire. Typical.Pain, typical pain level reported. ODI, Oswestry Disability Index. SOAPP-R, Screener and Opioid Assessment for Patients with Pain -Revised.
Figure 3:
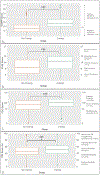
Figure 3:. Boxplots Diagrams of Patient Reported Outcomes.
Score averages for each of the craving groups on (A) Screener and Opioid Assessment for Patients with Pain -Revised (SOAPP-R); (B) Patient Health Questionnaire-9 (PHQ-9); (C) Pain Disability Questionnaire (PDQ); (D) and Oswestry Disability Index (ODI) collected at the time of screening by the SFVAHCS Pain Service. Groups were determined based on each subject’s response to SOAPP-R Question 11, “How often have you felt a craving for medication?” The no craving (N-CRV) group consisted of subjects that answered “Never [0]”. The craving (CRV) group consisted of subjects that answered “Seldom [1]”, “Sometimes [2]”, “Often [3]”, or “Very Often [4]”. Error bars indicate SD. Clinical anchors for each scale are shown on the right. Note: *<0.05, ** <0.01, *** < 0.001.
Figure 4:
Figure 4:. Bar Chart of Relative Importance of Variables in Decision Tree Classification Model.
PHQ-9, Patient Health Questionnaire-9. PDQ, Pain Disability Questionnaire. Post MEDD, Morphine Equivalent Daily Dose from up to 6 months after the subject’s assessment date. Pre MEDD, Morphine Equivalent Daily Dose from up to 6 months prior to the subject’s assessment date. Typical.Pain, typical pain level reported.

References

    1. Ahmadi J, Kampman KM, Oslin DM, Pettinati HM, Dackis C, Sparkman T. Predictors of treatment outcome in outpatient cocaine and alcohol dependence treatment. Am J Addict 2009;18(1):81–86. - PMC - PubMed
    1. Anagnostis C, Gatchel RJ, Mayer TG. The Pain Disability Questionnaire: A New Psychometrically Sound Measure for Chronic Musculoskeletal Disorders. Spine 2004;29(20):2290–2302 2210.1097/2201.brs.0000142221.0000188111.0000142220f. - PubMed
    1. Anamkath NS, Palyo SA, Jacobs SC, Lartigue A, Schopmeyer K, Strigo IA. An Interdisciplinary Pain Rehabilitation Program for Veterans with Chronic Pain: Description and Initial Evaluation of Outcomes. Pain Res Manag 2018;2018:3941682. - PMC - PubMed
    1. Anton RF, Moak DH, Latham PK. The obsessive compulsive drinking scale: A new method of assessing outcome in alcoholism treatment studies. Arch Gen Psychiatry 1996;53(3):225–231. - PubMed
    1. Association AP. Diagnostic and statistical manual of mental disorders (DSM-5®): American Psychiatric Pub, 2013. - PubMed

Publication types