. 2022 Apr 4;219(4):e20202304.
doi: 10.1084/jem.20202304. Epub 2022 Mar 17.

Synaptic pruning of murine adult-born neurons by microglia depends on phosphatidylserine

Affiliations

Synaptic pruning of murine adult-born neurons by microglia depends on phosphatidylserine

Chihiro Kurematsu et al. J Exp Med. .

Abstract

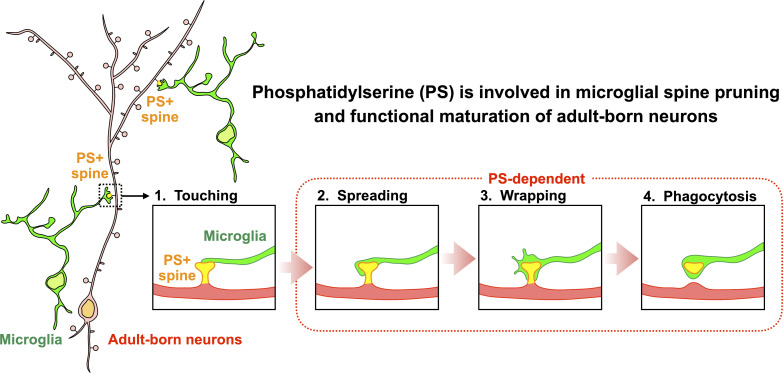
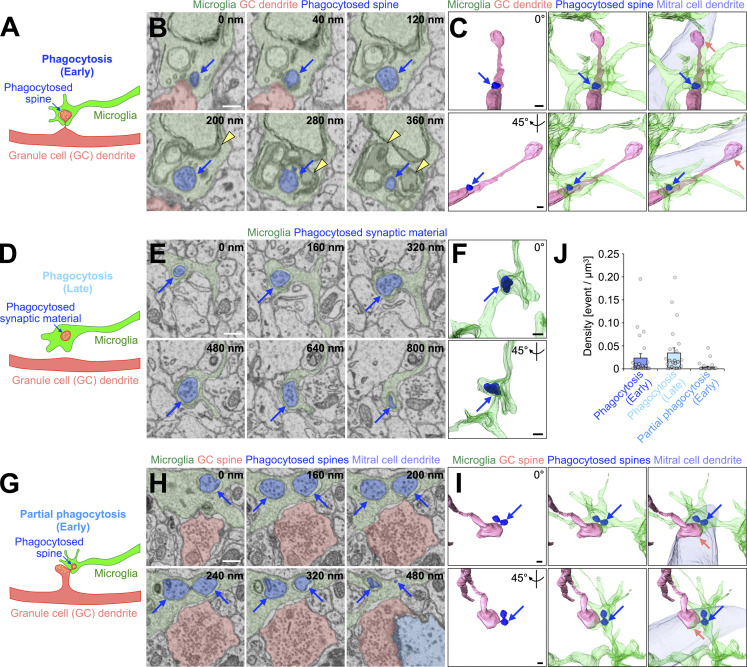
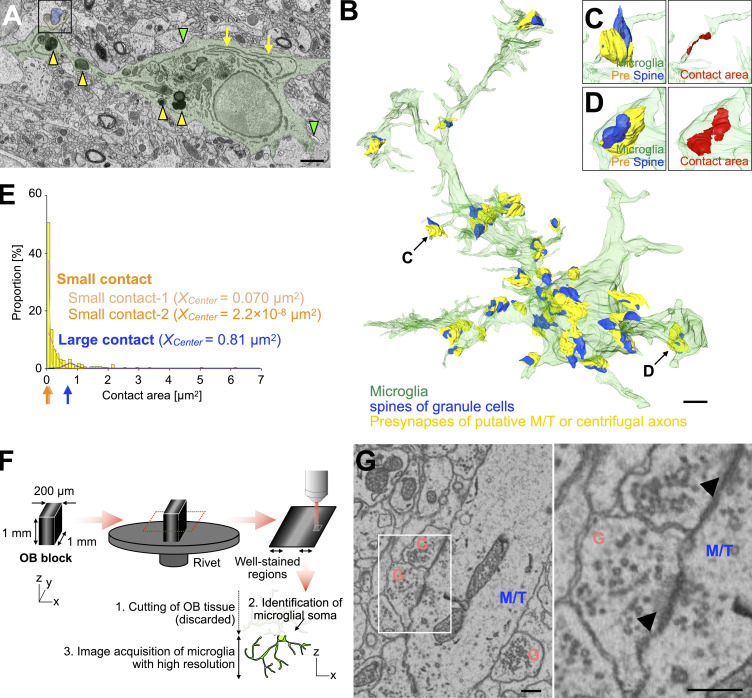
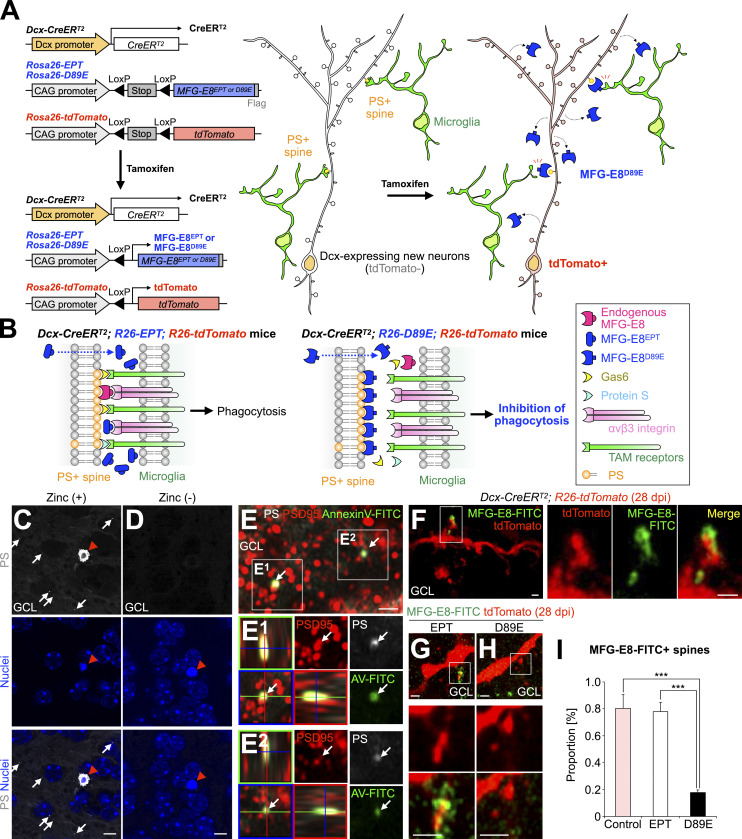
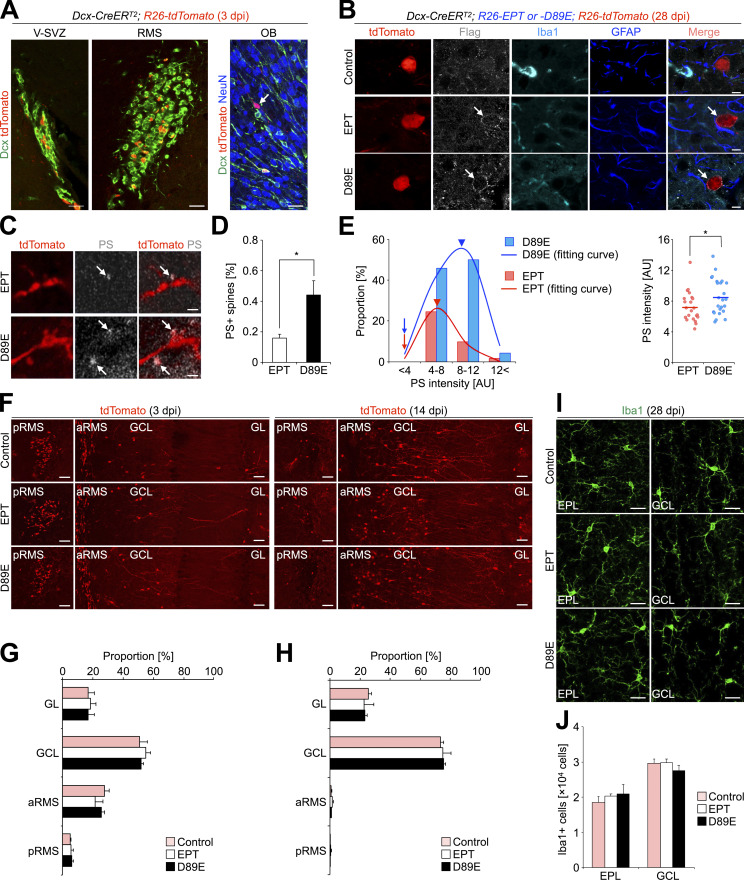
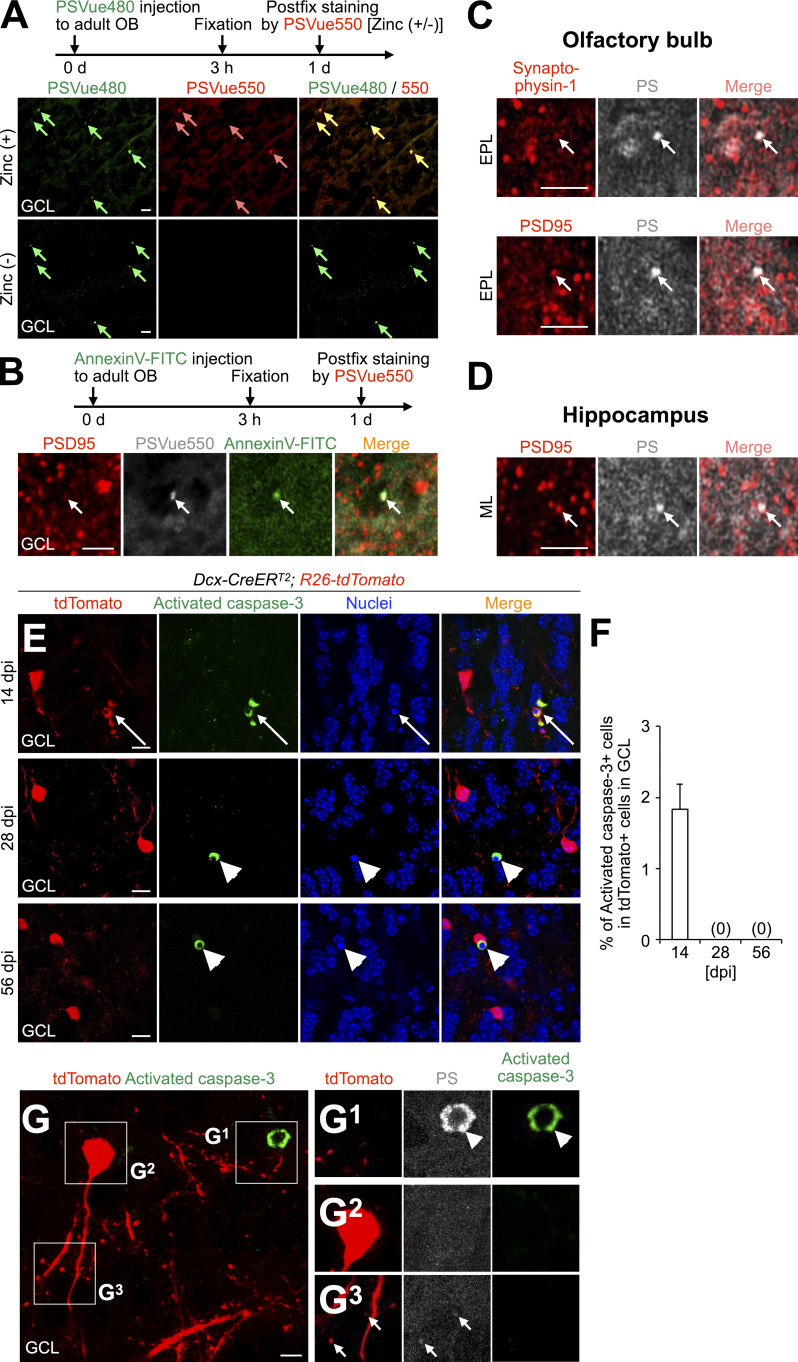
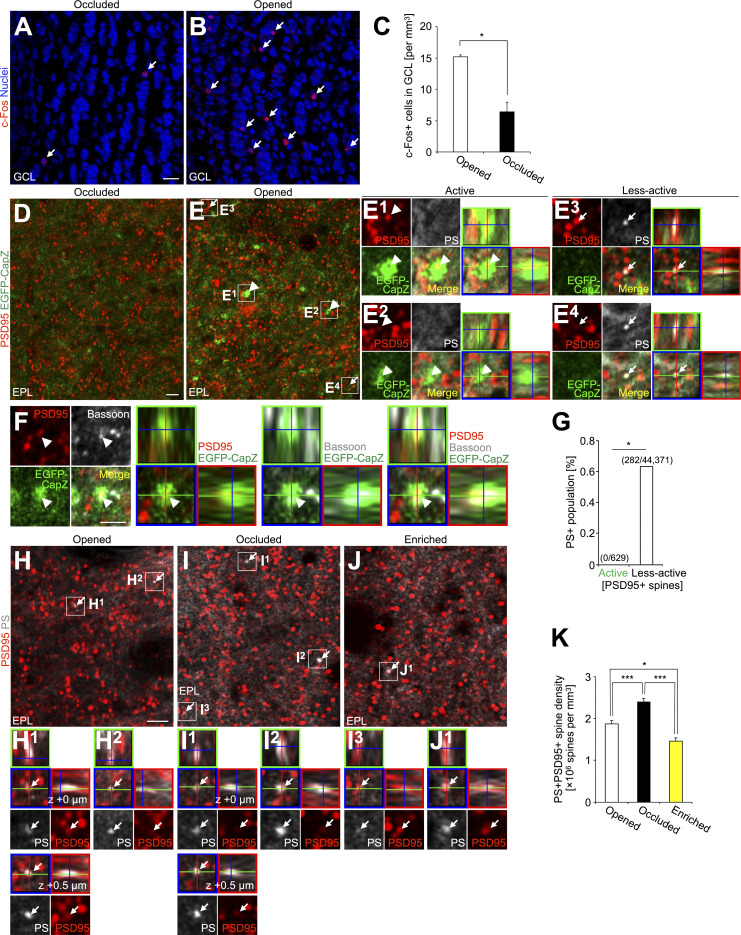
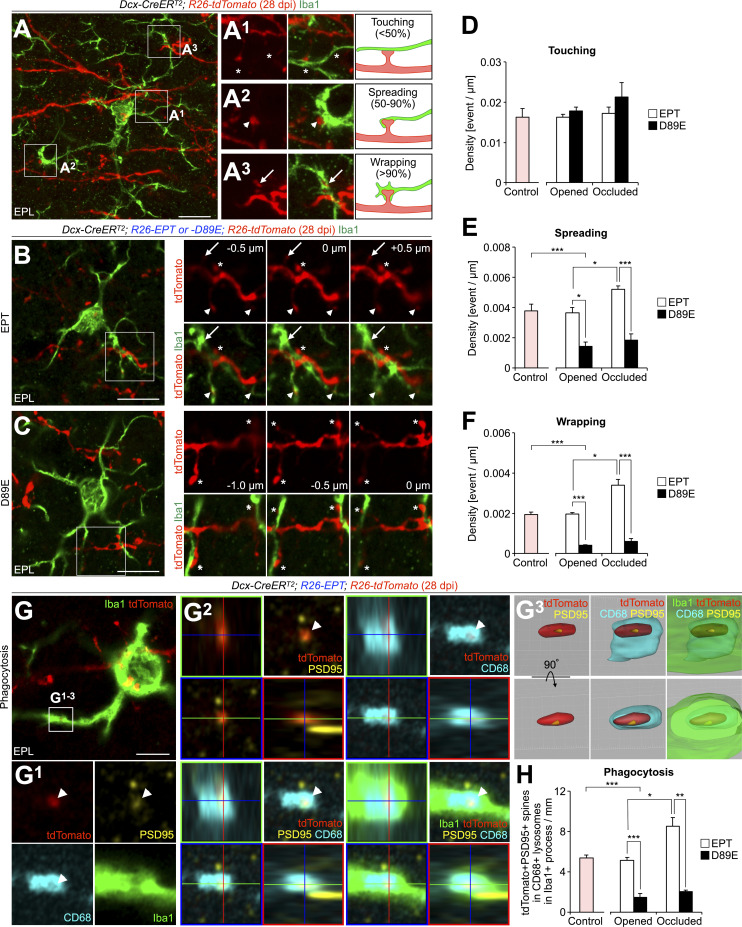
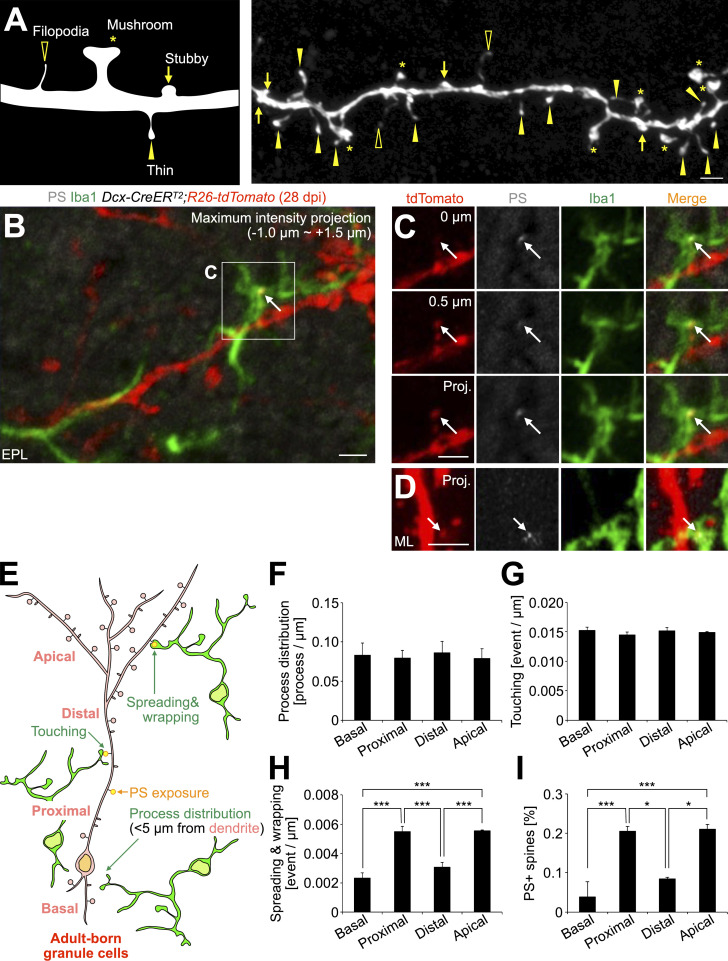
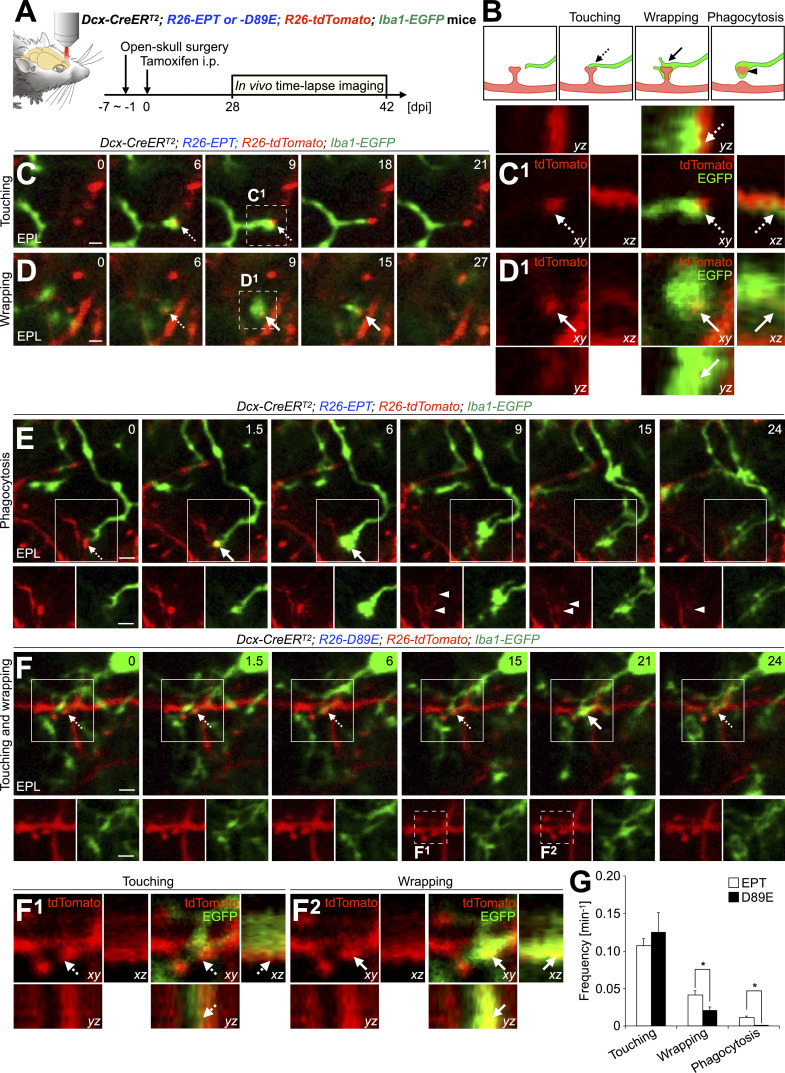
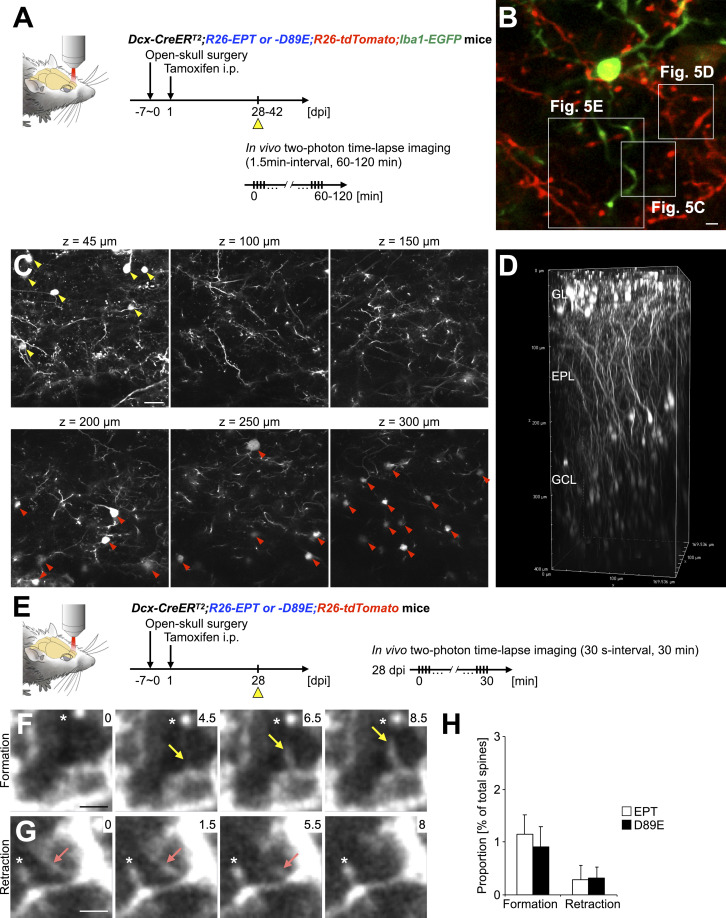
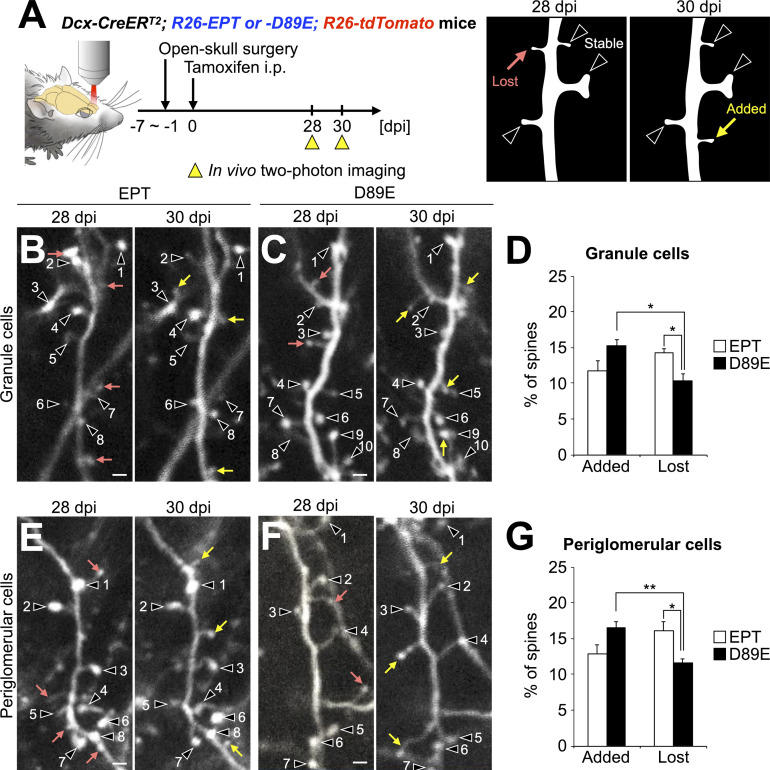
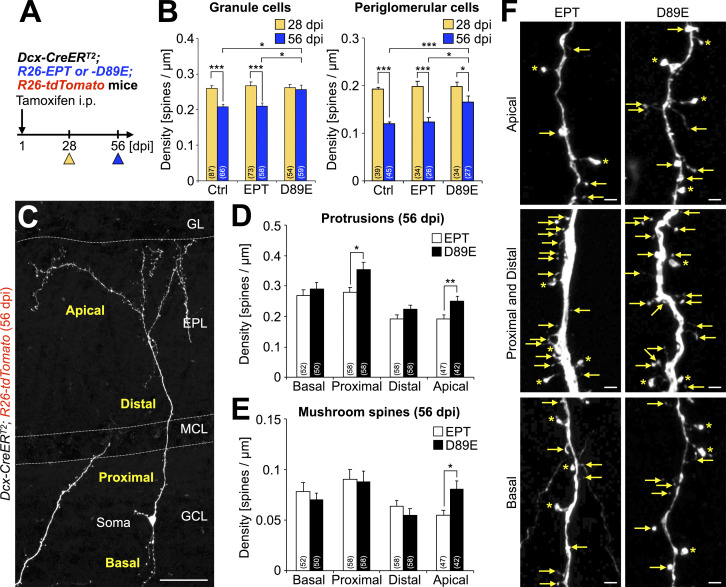
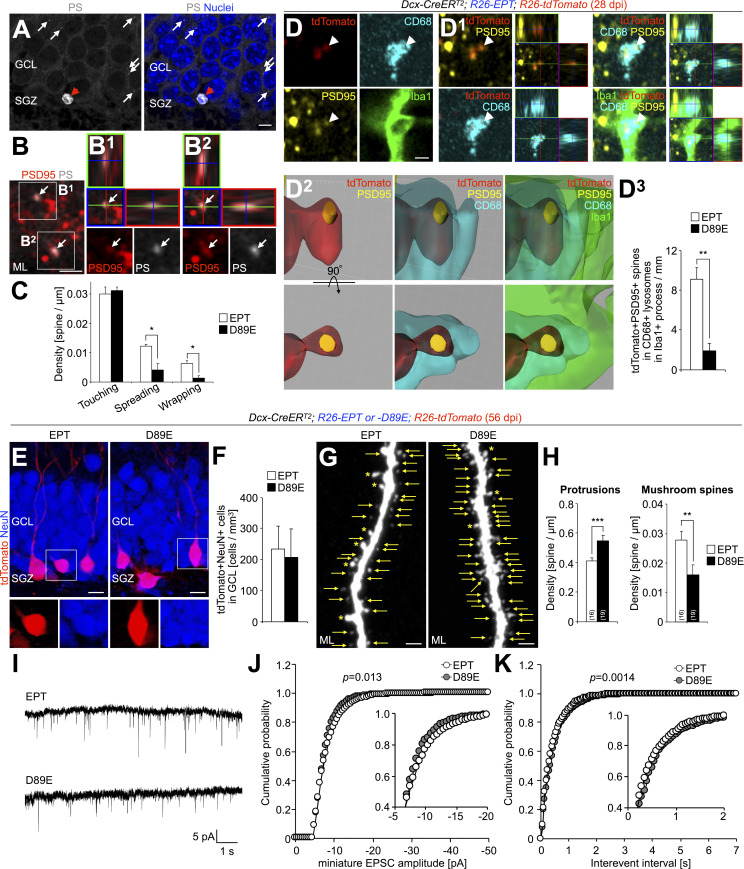
New neurons, continuously added in the adult olfactory bulb (OB) and hippocampus, are involved in information processing in neural circuits. Here, we show that synaptic pruning of adult-born neurons by microglia depends on phosphatidylserine (PS), whose exposure on dendritic spines is inversely correlated with their input activity. To study the role of PS in spine pruning by microglia in vivo, we developed an inducible transgenic mouse line, in which the exposed PS is masked by a dominant-negative form of milk fat globule-EGF-factor 8 (MFG-E8), MFG-E8D89E. In this transgenic mouse, the spine pruning of adult-born neurons by microglia is impaired in the OB and hippocampus. Furthermore, the electrophysiological properties of these adult-born neurons are altered in MFG-E8D89E mice. These data suggest that PS is involved in the microglial spine pruning and the functional maturation of adult-born neurons. The MFG-E8D89E-based genetic approach shown in this study has broad applications for understanding the biology of PS-mediated phagocytosis in vivo.


Conflict of interest statement

Disclosures: The authors declare no competing interests exist.

Figures

None
Graphical abstract
Figure 1.
Figure 1.
Microglia phagocytose a subset of granule cell spines in the adult OB. (A–I) Representative illustrations (A, D, and G), SBF-SEM images (B, E, and H), and 3D reconstructions (C, F, and I) of microglia (n = 23 cells from three mice, pooled from eight independent experiments) in the process of “phagocytosis (early)” (A–C), “phagocytosis (late)” (D–F), or “partial phagocytosis (early)” (G–I). Blue arrows (A–I) indicate phagocytosed spines (A–C and G–I) or synaptic material (D–F). Yellow arrowheads (B) and circles (A, D, and G) indicate lysosomes and synaptic vesicles, respectively. Microglia (A–I, green), granule cells (A–C and G–I, pink), phagocytosed spine/synaptic material (B, C, E, F, H, and I, blue), and mitral cells (C, H, and I, light blue) are also shown. Pink arrows (C and I) indicate dendrodendritic synapses between granule cell spines and mitral cell dendrites. Interactive 3D models of microglial phagocytosis shown in A–C and G–I are shown at https://sketchfab.com/3d-models/phagocytosis-of-spine-by-microglia-7f168d4801e1444fb1f14750bbad7175 and https://sketchfab.com/3d-models/partial-phagocytosis-of-spine-by-microglia-b3b4332f1bc74dea86ae81965a3d23d3, respectively. (J) Event per microglial volume (density) of phagocytosis (early), phagocytosis (late), or partial phagocytosis (early) (n = 23 cells from three mice, pooled from eight independent experiments). Each dot indicates data from one cell. Scale bars in B, C, E, F, H, and I, 400 nm. Data shown are mean ± SEM.
Figure S1.
Figure S1.
Quantitative analysis of microglia-synapse contacts and high-resolution imaging of dendrodendritic synapses in the OB by SBF-SEM. (A) Representative SBF-SEM image of microglia (green) in the GCL of the adult OB (n = 22 cells from three mice, pooled from five independent experiments). Yellow arrows, green arrowheads, and yellow arrowheads indicate long endoplasmic reticulum, extracellular space, and lysosomes, respectively. 3D reconstruction image of a synapse in the boxed area is shown in D. (B) 3D reconstruction of microglia in the GCL (semi-transparent green) shown in A and its associated synapses. While spines on distal, proximal, and basal dendrites of granule cells in the GCL form synapses to receive excitatory inputs from axonal terminals of mitral/tufted (M/T) cells in the OB and projection neurons in higher olfactory centers, those on apical dendrites in the EPL form dendrodendritic synapses with secondary dendrites of M/T cells (see Figs. 1 and S1 G). Presynaptic structures of putative M/T or centrifugal axons and spines of granule cells in the GCL are indicated by yellow and blue, respectively. (C–E) Representative three-dimensional reconstruction of small (C) and large (D) microglia-synapse contacts and distribution of microglia-synapse contact areas in the GCL (E) and corresponding gaussian fitting curves (E, trimodal distribution, AIC = 169.9, also see Materials and methods). The trimodal distribution consists of two distributions for small contacts (light orange and orange) and one distribution for large contacts (blue) and shows the minimum Akaike’s information criterion (AIC) in fitting curve analysis (E, see Materials and Methods). Arrows in E under the x axis indicate the center value (Xcenter) of each fitting curve (small contact-1, light orange, Xcenter = 0.070 µm2; small contact-2, orange, Xcenter = 2.2 × 10⁻⁸ µm2; large contact, magenta, Xcenter = 0.81 µm2). Most of the contacts between microglia and synapses are classified as small contacts (C and E). At large microglia-synapse contacts, microglial processes contained lysosomes and were wrapping synaptic structures (A and D), unlike the small contact-forming microglial processes (C). Microglia, presynapses, spines, and contact area in B–D are shown in green, yellow, blue, and red, respectively. 22 cells from three mice (pooled from five independent experiments) are analyzed (E). (F) Experimental scheme of sample preparation and image acquisition of microglia in the adult OB for high-resolution SBF-SEM imaging. Also see Materials and methods. (G) Representative SBF-SEM images of dendrodendritic synapses between secondary dendrites of M/T (blue) cells and dendritic spines of granule cells (G, pink) in the EPL of the adult OB (n = 23 cells from three mice, pooled from eight independent experiments). Magnified image of boxed area (right) shows 40 nm synaptic vesicles in both M/T and granule cell spines and postsynaptic density in the granule cell spines (arrowheads). Scale bars: A and B, 2 µm; G, 400 nm.
Figure 2.
Figure 2.
MFG-E8D89E masks PS exposed at spines in vivo. (A) Schematic illustration of the transgenic mouse lines developed in the study. Left: Following Cre-mediated excision of the LoxP-flanked “Stop” sequence, MFG-E8EPT and MFG-E8D89E (see explanation in B) are expressed under the control of the CAG promoter located in the Rosa26 locus. Dcx-CreERT2 mice were used for Tamoxifen-induced recombination in Dcx-expressing new neurons in the adult brain. Rosa26-tdTomato mice were used to visualize recombined Dcx-expressing cells. Right: Tamoxifen-induced expression of MFG-E8D89E in Dcx-expressing cells in the adult brain. MFG-E8D89E (blue) is specifically secreted from Dcx-expressing new neurons and masks PS+ spines (yellow) to suppress microglial phagocytosis. Recombined new neurons are visualized by tdTomato expression (red). (B) Mechanism for the inhibition of PS-dependent phagocytosis by MFG-E8D89E. Under physiological conditions, PS on damaged or apoptotic cells/synapses is recognized by adaptor molecules from several phagocytic pathways, including the MFG-E8-αvβ3 integrin pathway (magenta and pink, respectively) and the Protein S/Gas6/TAM receptors pathway (light blue, yellow, and green, respectively). Overexpressed MFG-E8EPT (left, blue), which binds to αvβ3 integrin but not PS, does not interfere with phagocytosis. On the contrary, overexpressed MFG-E8D89E (right, blue), which is a dominant-negative form of MFG-E8, binds to PS but not αvβ3 integrin, hindering PS recognition and subsequent phagocytosis. (C and D) Representative images of the GCL in the OB of adult WT mice injected with PSVue550 (white) with (C) or without (D) zinc solution (n = 3 mice). White arrows and red arrowheads indicate PS+ dots and a pyknotic cell, respectively. Nuclei are stained by Hoechst 33342 (blue). (E) Representative images of the GCL in the OB of adult WT mice injected with PSVue550 (white) and AnnexinV-FITC (green), stained for postsynaptic marker PSD95 (red; n = 3 mice, pooled from two independent experiments). The boxed area is enlarged in the bottom. Arrows in the boxed area (E1 and E2, orthogonal view) indicate PS+AnnexinV-FITC+PSD95+ signal. (F–H) Representative images of the GCL in the OB of control (F, n = 3 mice), EPT (G, n = 3 mice), and D89E (H, n = 4 mice) mice injected with MFG-E8-FITC (green). The boxed areas (F–H) are enlarged in the right (F) and bottom (G and H). (I) Proportion of MFG-E8-FITC+tdTomato+ spines in control (n = 3 mice), EPT (n = 3 mice), and D89E (n = 4 mice) mice (pooled from three independent experiments; F(2,7) = 33.2, P = 0.00027, one-way ANOVA; control versus D89E, P = 0.00053, EPT versus D89E, P = 0.00067, Tukey–Kramer test). GCL, granule cell layer. Scale bars in C and D, 5 µm; E–H, 1 µm. ***, P < 0.005. Data shown are mean ± SEM.
Figure S2.
Figure S2.
Characterization of EPT and D89E mice used in this study. (A) Representative images of the V-SVZ, RMS, and OB of adult Dcx-CreERT2; R26-tdTomato (control) mice at 3 dpi (n = 3 mice) stained for Dcx, DsRed, and NeuN. tdTomato is expressed in the subset of Dcx+ cells in the V-SVZ-RMS (10.2 ± 1.4%, n = 3 mice pooled from two independent experiments), and OB (0.7 ± 0.3%, n = 3 mice). These tdTomato+ cells in the V-SVZ-OB were positive for Dcx (85.1 ± 0.8%, n = 3 mice) or NeuN (14.8 ± 0.6%, n = 3 mice), but negative for GFAP or Iba1, suggesting that some of the tdTomato+ Dcx+ cells were differentiated into tdTomato+ NeuN+ OB neurons within 3 d. (B) Representative images of the GCL of the OB in the adult control, Dcx-CreERT2; R26-EPT; R26-tdTomato (EPT), and Dcx-CreERT2; R26-D89E; R26-tdTomato (D89E) mice at 28 dpi (n = 3 mice each, pooled from six independent experiments) stained for flag (white), Iba1 (cyan), and GFAP (blue). tdTomato+ signals (red) are directly observed without staining. Arrows indicate flag+ signals in tdTomato+ granule cells in the OB. (C) Representative images of the EPL of the OB in EPT and D89E mice at 28 dpi stained for DsRed (red; n = 3 mice each). Injected PSVue480 is shown in white. (D) Proportion of PS+tdTomato+ spines in the EPL of EPT and D89E mice at 28 dpi (n = 3 mice each, pooled from three independent experiments; t(4) = −3.0, P = 0.042, unpaired t test). (E) Distributions (left graph, bars; and right graph) and their fitting curves (left graph, lines) of PS intensity in EPT and D89E mice at 28 dpi. Arrows and arrowheads (left graph) indicate the onset and peak of fitting curves in EPT (pink) and D89E (blue) mice (EPT, AIC = −55.2; D89E, AIC = −33.2; also see Materials and methods). While the onset of the fitting curve is similar between the two transgenic mice, its peak is shifted rightward in D89E mice (arrowheads, EPT, 8.8; D89E, 10.5), suggesting that PS is initially exposed on spines similarly in EPT and D89E mice, but accumulated in D89E mice due to the failure of the microglial spine pruning. PS intensity at tdTomato+ spines in D89E mice (n = 24 events from three mice) is significantly higher than that in EPT mice (n = 22 events from three mice, pooled from three independent experiments; t(44) = −2.0, P = 0.048, unpaired t test). (F–H) No effect of MFG-E8EPT and MFG-E8D89E on the migration of tdTomato+ cells toward the OB. Representative images (F; n = 3 mice each) and proportions (G and H; pooled from four independent experiments) of tdTomato+ cells (red in F) in the GL, GCL, anterior RMS (aRMS), and posterior RMS (pRMS) of control, EPT, and D89E mice at 3 (F and G) and 14 (F and H) dpi (n = 3 mice each) are shown. (I and J) No effect of MFG-E8EPT and MFG-E8D89E on the number of Iba1+ microglia in the adult OB. Representative images (I; n = 3 mice each) and numbers (J; pooled from six independent experiments) of Iba1+ cells (green in I) in the EPL and GCL of the OB in control, EPT, and D89E mice (n = 3 mice each) at 28 dpi are shown. RMS, rostral migratory stream; GCL, granule cell layer; EPL, external plexiform layer; GL, glomerular layer; AU, arbitrary unit. Scale bars: A and I, 20 µm; B, 5 µm; C, 1 µm; F, 50 µm. *, P < 0.05. Data shown are mean ± SEM.
Figure S3.
Figure S3.
PSVue detects PS exposed at spines in the adult OB and DG. (A) Experimental scheme (top) and representative images (bottom) of the GCL of the OB in adult WT mice injected with PSVue480 (green), stained for PSVue550 (red) with or without zinc solution. PSVue480+ dots (green arrows) are stained with PSVue550+ dots (pink arrows) in a zinc-dependent manner (92.1 ± 1.8% [n = 3 mice, pooled from three independent experiments] of PSVue480+ dots were colocalized with PSVue550). (B) Experimental scheme (top) and representative images (bottom) of the GCL of the OB in adult WT mice injected with AnnexinV-FITC (green), stained for PSVue550 (white) and PSD95 (red). Arrows indicate AnnexinV-FITC+PSVue550+PSD95+ spines in the GCL (73.4 ± 1.1% [n = 3 mice, pooled from two independent experiments] of AnnexinV-FITC+PSD95+ dots were colocalized with PS). (C and D) Representative images of the EPL of the OB (C) or ML of the hippocampus (D) in adult WT mice stained for PSVue480 (PS, white) and Synaptophysin-1 (red in C, top) or PSD95 (red in C, bottom, and D). Arrows indicate double-positive signals (C, 37.9 ± 2.2% and 36.8 ± 1.4% [n = 3 mice, pooled from two independent experiments] of PS+ dots is colocalized with Synaptophysin-1 and PSD95, respectively; D, 33.6 ± 0.9% [n = 3 mice, pooled from two independent experiments] of PS+ dots is colocalized with PSD95). (E and F) Active apoptosis of tdTomato+ granule cells in the adult OB. Representative images of the GCL of the OB in Dcx-CreERT2; R26-tdTomato mice at 14, 28, and 56 dpi (n = 3 mice) stained for activated caspase-3 (green) are shown. tdTomato+ signals (red) are directly observed without staining. Nuclei are stained by Hoechst 33342 (blue). Arrows and arrowheads indicate tdTomato+ activated caspase-3+ and tdTomato- activated caspase-3+ pyknotic cells, respectively. Proportion of activated caspase-3+ cells in tdTomato+ cells in the GCL of the adult OB is shown (F; 14 dpi, 4/222 cells from three mice; 28 dpi, 0/546 cells from three mice; 56 dpi, 0/767 cells from three mice; pooled from five independent experiments). (G) PS exposure at spines of nonapoptotic tdTomato+ granule cells in the adult OB. Representative images of the GCL of the OB in adult Dcx-CreERT2; R26-tdTomato mice at 28 dpi (n = 3 mice) stained for PS (white) and activated caspase-3 (green). tdTomato+ signals (red) are directly observed without staining. Boxed areas are enlarged in G1–G3. Arrowheads and arrows indicate activated caspase-3+ PS+ apoptotic cells and activated caspase-3- PS+ spines, respectively. None of the tdTomato+ neurons with exposed PS at their spines expresses activated caspase-3 or PS in their soma at 28 and 56 dpi (n = 27 cells from three mice at 28 dpi; n = 14 cells from three mice at 56 dpi; pooled from four independent experiments). GCL, granule cell layer; EPL, external plexiform layer; ML, molecular layer. Scale bars: A–D, 2 µm; E, 10 µm; G, 5 µm. Data shown are mean ± SEM.
Figure 3.
Figure 3.
PS exposure on less-active spines, and its suppression by olfactory inputs in the adult OB. (A and B) Representative images c-Fos staining (red) of the GCL in the naris-occluded (A) and opened (B) side of OB in adult AiCE-Tg mice (n = 3 mice) with unilateral naris occlusion. Nuclei were stained with Hoechst 33342 (blue). Arrows indicate c-Fos+ signals in the GCL. (C) Density of the c-Fos+ cells in the GCL (n = 3 mice, pooled from two independent experiments, t(2) = −7.7, P = 0.016, paired t test). (D and E) Representative images of the EPL in the naris-occluded (D) and opened (E) side of OB in the adult AiCE-Tg mice (n = 3 mice) stained for PS (white), PSD95 to define spines (red), and EGFP (green, EGFP-CapZ). Active and less-active spines, defined here by the level of EGFP signal (see Materials and Methods), in E are enlarged and shown by orthogonal view in (E1 and E2) and (E3 and E4), respectively. Arrowheads and arrows (E and E1–E4) indicate active spines and representative PS+ spines, respectively. (F) Representative single z-plane and orthogonal images of the active spine (arrowhead) in the EPL of the naris-opened side of the OB of adult AiCE-Tg mice (n = 3 mice) stained for the postsynaptic marker PSD95 (red), EGFP (green, EGFP-CapZ), and a presynaptic marker Bassoon (white). (G) Proportion of PS+ population in active and less-active PSD95+ spines in the EPL of the adult OB (pooled from two independent experiments; 0 PS+/629 active spines, 282 PS+/44,371 less-active spines from two mice; P = 0.037, Fisher’s exact test). (H–J) Representative images of the EPL in the OB of naris-opened (H, n = 4 mice), naris-occluded (I, n = 4 mice), and odor-enriched (J, n = 6 mice) adult WT mice stained for PS (white) and PSD95 (red). PSD95+PS+ spines (arrows) are enlarged and shown by orthogonal view in the boxes (H1, H2, I1, I2, I3, and J1). Different z-level images of PSD95+PS+ spine in (H1 and I1) are also shown by a single z-plane and orthogonal view (z + 0.5 µm). (K) Density of the PSD95+PS+ spines (n = 4 [opened], 4 [occluded], 6 [odor-enriched] mice pooled from two independent experiments; F(2,11) = 33.3, P = 0.000022, one-way ANOVA; opened versus occluded, P = 0.0041, opened versus enriched, P = 0.011, occluded versus enriched, P = 0.000015, Tukey–Kramer test). GCL, granule cell layer; EPL, external plexiform layer. Scale bars: A, B, 20 µm; D–F and H–J, 2 µm. *, P < 0.05; ***, P < 0.005. Data shown are mean ± SEM.
Figure 4.
Figure 4.
PS is involved in microglial phagocytosis of spines of adult-born neurons in the OB. (A) Representative image of the EPL in the OB of adult Dcx-CreERT2; R26-tdTomato (control) mice at 28 dpi (n = 4 mice) stained for DsRed (red) and Iba1 (green). The boxed areas in A are enlarged in A1–A3. Contacts between microglia and spines are classified into three types: touching (A1, asterisks), spreading (A2, arrowheads), and wrapping (A3, arrows). (B and C) Effect of MFG-E8D89E on spine contacts by microglia in adult-born neurons in the OB. Representative images of the EPL in the OB of adult Dcx-CreERT2; R26-EPT; R26-tdTomato (B, EPT, n = 5 mice), and Dcx-CreERT2; R26-D89E; R26-tdTomato (C, D89E, n = 3 mice) mice at 28 dpi stained for DsRed (red) and Iba1 (green) are shown. The boxed areas (B and C) are displayed on the right-hand side (0 µm). Asterisks, arrowheads, and arrows in the three consecutive images (B, C, right) indicate microglial touching to, spreading on, and wrapping of spines, respectively. (D–F) Density of microglial contacts (touching [D], spreading [E], and wrapping [F]) to spines in the adult control (n = 4 mice), naris-opened or occluded EPT (n = 5 mice each) or D89E (n = 3 mice each) mice (E, for comparison among control, EPT, and D89E mice, F(2,9) = 10.8, P = 0.0041, one-way ANOVA; control versus D89E, P = 0.0045, Dunnett’s test; for comparison of EPT versus D89E and opened versus occluded, Fmouse (1,12) = 72.6, P = 2.0 × 10⁻⁶, Focclusion (1,12) = 8.87, P = 0.012, two-way ANOVA; EPT versus D89E in opened, t(6) = 4.4, P = 0.018, opened versus occluded in EPT, t(8) = −3.8, P = 0.021, EPT versus D89E in occluded, t(6) = 8.0, P = 0.00082, unpaired t test; F, for comparison among control, EPT, and D89E mice, F(2,9) = 93.6, P = 9.5 × 10⁻⁷, one-way ANOVA; control versus D89E, P = 1.6 × 10⁻⁶, Dunnett’s test; for comparison of EPT versus D89E and opened versus occluded, Fmouse (1,12) = 128, P = 9.1 × 10⁻⁸, Focclusion (1,12) = 18.3, P = 0.0011, two-way ANOVA; EPT versus D89E in opened, t(6) = 15.4, P = 1.9 × 10⁻⁵, opened versus occluded in EPT, t(8) = −5.2, P = 0.018, EPT versus D89E in occluded, t(6) = 7.6, P = 0.0011, unpaired t test). Pink bars indicate data from controlmice. Data are pooled from 10 independent experiments. (G) Representative images of EPL in the OB of adult EPT mice (n = 4 mice) stained for PSD95 (yellow), CD68 (cyan), and Iba1 (green). tdTomato+ signals (red) are directly observed without staining. The boxed area in G is enlarged (G1) and is shown by orthogonal (G2) and a surface-rendered 3D view (G3). White arrowheads indicate tdTomato+PSD95+ spine incorporated in CD68+ lysosomes within Iba1+ processes (G1). Also, see Video 3. (H) Density of tdTomato+PSD95+ spines incorporated in CD68+ lysosomes within Iba1+ processes in the adult control (n = 3 mice), naris-opened or occluded EPT (n = 4 [opened] or 3 [occluded] mice) or D89E (n = 3 mice each) mice (for comparison among control, EPT, and D89E mice, F(2,7) = 41.0, P = 0.00014, one-way ANOVA; control versus D89E, P = 0.00018, Dunnett’s test; for comparison of EPT versus D89E and opened versus occluded, Fmouse (1,9) = 110.7, P = 2.3 × 10⁻⁶, Focclusion (1,9) = 16.8, P = 0.0027, Fmouse×occlusion (1,9) = 8.8, P = 0.016, two-way ANOVA; EPT versus D89E in opened, t(5) = 7.6, P = 0.0025, opened versus occluded in EPT, t(5) = −4.2, P = 0.035, EPT versus D89E in occluded, t(4) = 7.3, P = 0.0074, unpaired t test). Pink bar indicates data from control mice. Data are pooled from six independent experiments. EPL, external plexiform layer. Scale bars: A–C, 10 µm; G, 5 µm. *, P < 0.05; **, P < 0.01; ***, P < 0.005; adjusted with Bonferroni correction. Data shown are mean ± SEM.
Figure S4.
Figure S4.
Subcellular domain-specific regulation of PS exposure and microglial contacts of spines of adult-born neurons. (A) Classification of spine morphology. Asterisks, mushroom; arrows, stubby; yellow arrowheads, thin; black arrowheads, filopodia. (B and C) Representative projection image of the EPL in the OB of adult Dcx-CreERT2; R26-tdTomato mice at 28 dpi (n = 8 mice), stained for DsRed (red), PS (white), and Iba1 (green). The boxed area in B is enlarged in C. Arrows indicate a PS+ tdTomato+ thin spine wrapped by Iba1+ microglial process. The two sequential z-planes (0, 0.5 µm) and a projection image (−1.0 to approximately +1.5 µm) of the boxed area in B are shown in C. (D) Representative projection image of the DG in the hippocampus of adult Dcx-CreERT2; R26-tdTomato mice at 28 dpi (n = 8 mice), stained for DsRed (red), PS (white), and Iba1 (green). Arrows indicate a PS+tdTomato+ spine wrapped by Iba1+ microglia. (E) Parameters for microglia–spine interaction (process distribution, touching, spreading and wrapping, and PS exposure). (F–I) Densities of microglial process distribution (F, n = 3 mice, pooled from two independent experiments), touching to spines (G, n = 4 mice, pooled from two independent experiments), spreading on and wrapping of spines (H, n = 4 mice, pooled from two independent experiments; F(3,12) = 30.7, P = 0.0000065, one-way ANOVA; basal versus proximal, P = 0.000037, basal versus apical, P = 0.000032, distal versus proximal, P = 0.00048, distal versus apical, P = 0.00040, Tukey–Kramer test), and proportion of PS+ spines (I, n = 3 mice, pooled from two independent experiments; F(3,8) = 16.7, P = 0.00083, one-way ANOVA; basal versus proximal, P = 0.0024, basal versus apical, P = 0.0019, distal versus proximal, P = 0.016, distal versus apical, P = 0.012, Tukey–Kramer test) in the basal, proximal, distal, and apical domains of dendrites of tdTomato+ adult-born granule cells in Dcx-CreERT2; R26-tdTomato mice at 28 dpi. EPL, external plexiform layer; ML, molecular layer. Scale bars in A–D, 2 µm. *, P < 0.05; ***, P < 0.005.
Figure 5.
Figure 5.
PS is involved in the microglial membrane extension along targeted spines to proceed phagocytosis in adult-born neurons in the OB. (A) Experimental scheme. In vivo two-photon imaging of dendritic spines of tdTomato+ granule cells and EGFP+ microglia in the adult Dcx-CreERT2; R26-EPT; R26-tdTomato; Iba1-EGFP (EPT; Iba1-EGFP) and Dcx-CreERT2; R26-D89E; R26-tdTomato; Iba1-EGFP (D89E; Iba1-EGFP) mice was performed at 28–42 dpi. (B) Classification of microglia–spine interaction in two-photon imaging. (C–F) Representative two-photon images of dendrites of tdTomato+ granule cells (red) and EGFP+ microglial processes (green) in the adult OB of EPT (C–E, also see Fig. S5, A and B; and Video 4; n = 3 mice) or D89E (F, also see Video 5; n = 5 mice); Iba1-EGFP mice. Dotted line boxes in C and D are magnified and shown in orthogonal view (C1 and D1), respectively. Dotted line boxes (F, 15 and 21 min) are magnified and shown in orthogonal view (F1 and F2), respectively. (G) Frequency of microglial touching to, wrapping of, and phagocytosis of tdTomato+ spines in EPT or D89E; Iba1-EGFP mice (n = 3 or 5 mice pooled from three or five independent experiments, respectively; wrapping, t(6) = 2.5, P = 0.047, unpaired t test; Phagocytosis, P = 0.032, Welch’s t test). EPL, external plexiform layer. Dashed and solid arrows indicate microglial touching to and wrapping of spines, respectively (B–F). Arrowheads indicate phagocytosed spines observed in the microglial processes (B and E). Numbers (C–F) indicate minutes after the first imaging frame. Scale bars, 2 µm. *, P < 0.05. Data shown are mean ± SEM.
Figure S5.
Figure S5.
In vivo two-photon time-lapse imaging of filopodium formation and retraction of adult-born neurons in the OB. (A) Experimental scheme of in vivo two-photon time-lapse imaging of microglia–spine interaction. (B) Representative two-photon image of tdTomato+ dendrites of granule cells (red) and EGFP+ microglia (green) in the EPL of the adult OB. Boxed areas are enlarged in Fig. 5, C–E. Also see Video 4. (C and D) In vivo two-photon imaging of dendritic spines of adult-born periglomerular cells and granule cells. Representative z-stack two-photon images (C) and their 3D reconstruction (D) of tdTomato+ periglomerular (yellow arrowheads) and granule (red arrowheads) cells in Dcx-CreERT2; R26-EPT; R26-tdTomato (EPT) mouse at 28 dpi are shown. (E) Experimental scheme of in vivo two-photon time-lapse imaging of filopodium formation and retraction. (F and G) Representative in vivo time-lapse images of tdTomato+ filopodium formation (F, yellow arrows) and retraction (G, pink arrows) in the EPL (n = 3 mice, pooled from three independent experiments). Asterisks (F and G) indicate spines stably observed during the whole imaging period. Numbers indicate the time in minutes from the initial image session. (H) Frequency of filopodium formation and retraction in the adult EPT and Dcx-CreERT2; R26-D89E; R26-tdTomato (D89E) mice at 28 dpi (n = 3 mice each, pooled from three independent experiments). GL, glomerular layer; EPL, external plexiform layer; GCL, granule cell layer. Scale bars: B, F, and G, 2 µm; C, 20 µm. Data shown are mean ± SEM.
Figure 6.
Figure 6.
PS is involved in the spine pruning of adult-born neurons in the OB. (A) Experimental scheme. In vivo two-photon imaging of dendritic spines of tdTomato+ granule and periglomerular cells in the adult Dcx-CreERT2; R26-EPT; R26-tdTomato (EPT) and Dcx-CreERT2; R26-D89E; R26-tdTomato (D89E) mice was performed at 28 and 30 dpi. Dendritic spines identified at 28 and 30 dpi were classified into stable (black arrowheads), lost (pink arrow), or added (yellow arrow; B, C, E, and F). (B–G) Effect of MFG-E8D89E on dendritic spine dynamics in tdTomato+ granule (B–D) and periglomerular (E–G) cells. Representative in vivo projection images of dendritic spines of granule (B and C) and periglomerular (E and F) cells in adult EPT (B, E; n = 4 mice) and D89E (C, F; n = 4 mice) mice are shown. Numbers identify spines that were maintained over the 2-d observation period. Percentages of added and lost spines of granule (D) and periglomerular (G) cells in the adult EPT (n = 4 mice) and D89E (n = 4 mice) mice are shown (Granule cells [D], Fgroup(1,6) = 378.7, pgroup = 1.2 × 10⁻⁶, Fdynamics(1,6) = 2.9, pdynamics = 0.90, Fgroup×dynamics(1,6) = 27.9, P = 1.9 × 10⁻³, two-way repeated measures ANOVA; EPT versus D89E, t(6) = 3.2, P = 0.019 in Lost, unpaired t test; added versus lost, t(3) = 5.5, P = 0.012 in D89E, paired t test; Periglomerular cells [G], Fgroup(1,6) = 332.8, pgroup = 1.7 × 10⁻⁶, Fdynamics(1,6) = 1.5, pdynamics = 0.89, Fgroup×dynamics(1,6) = 43.2, P = 5.9 × 10⁻⁴, two-way repeated measures ANOVA; EPT versus D89E, t(6) = 3.1, P = 0.021 in Lost spines, unpaired t test; added versus lost, t(3) = 7.4, P = 0.0050 in D89E, paired t test). Data are pooled from three independent experiments. Scale bars in B, C, E, F, 2 µm. *, P < 0.05; **, P < 0.01; adjusted with Bonferroni correction. Data shown are mean ± SEM.
Figure 7.
Figure 7.
Inhibition of PS-dependent spine pruning by MFG-E8D89E increases the synaptic density in adult-born mature neurons in the OB. (A) Experimental scheme. (B) Total protrusion density of granule and periglomerular cells in Dcx-CreERT2; R26-tdTomato (Ctrl), Dcx-CreERT2; R26-EPT; R26-tdTomato (EPT), and Dcx-CreERT2; R26-D89E; R26-tdTomato (D89E) mice at 28 and 56 dpi (Ctrl, n = 4 [28 dpi] and 3 [56 dpi] mice; EPT, n = 3 [28 dpi] and 4 [56 dpi] mice; D89E, n = 3 mice [28 and 56 dpi]) (Granule cells, Ctrl, 28 dpi versus 56 dpi, t(151) = 5.6, P = 9.2 × 10⁻⁸, unpaired t test; EPT, 28 dpi versus 56 dpi, t(129) = 6.0, P = 1.7 × 10⁻⁸, unpaired t test; 56 dpi, x2(2) = 10.7, P = 0.0048, Ctrl versus D89E, P = 0.015, EPT versus D89E, P = 0.013, Steel-Dwass test; periglomerular cells, Ctrl, 28 dpi versus 56 dpi, t(82) = 11.4, P = 2.2 × 10⁻¹⁶, unpaired t test; EPT, 28 dpi versus 56 dpi, t(58) = 5.0, P = 5.8 × 10⁻⁶, unpaired t test; D89E, 28 dpi versus 56 dpi, t(59) = 2.0, P = 0.045, unpaired t test; 56 dpi, x2(2) = 11.7, P = 0.0029, Ctrl versus D89E, P = 0.0023, EPT versus D89E, P = 0.032, Steel-Dwass test). Data are pooled from eight independent experiments. (C) Representative image of tdTomato+ granule cells of adult Dcx-CreERT2; R26-tdTomato mice at 56 dpi (n = 3 mice) stained for DsRed (white). Dendrites of granule cells are divided into four subregions: apical, distal, proximal, and basal. (D–F) Effect of MFG-E8D89E on the spine density of granule cells in the OB. Density (D [Proximal, P = 0.012, Welch’s t test; Apical, t(88) = −2.9, P = 0.0051, unpaired t test], E [Apical, P = 0.011, Welch’s t test]) and representative images (F) of protrusions (D) and mushroom spines (E) in the granule cells in EPT (n = 4 mice) and D89E (n = 3 mice) mice 56 dpi are shown. Asterisks and arrows indicate mushroom spines and other protrusions, respectively (F). Data are pooled from four independent experiments. Parentheses in B, D, and E indicate the number of analyzed cells. GCL, granule cell layer; MCL, mitral cell layer; EPL, external plexiform layer; GL, glomerular layer. Scale bars: C, 50 µm; F, 2 µm. *, P < 0.05; **, P < 0.01; ***, P < 0.005. Data shown are mean ± SEM.
Figure 8.
Figure 8.
Inhibition of PS-dependent spine pruning by MFG-E8D89E disrupts the synaptic maturation of adult-born neurons in the hippocampal DG. (A) Representative image of the DG in the hippocampus of adult WT mice injected with PSVue480 (white; n = 4 mice). White arrows and red arrowheads indicate PS+ dots and a pyknotic cell, respectively. Nuclei are stained by Hoechst 33342 (blue). (B) Representative images of the ML of adult WT mice injected with PSVue480 (white), stained for PSD95 (red). The boxes in B are enlarged and shown by orthogonal view (B1 and B2). Arrows (B, B1, and B2) indicate PS+PSD95+ signals (36.3 ± 3.0% [n = 3 mice] of PS+ dots are colocalized with PSD95; pooled from two independent experiments). (C) Effect of MFG-E8D89E on microglial contacts to spines of adult-born neurons in the DG. The density of microglial contacts to tdTomato+ spines in the adult Dcx-CreERT2; R26-EPT; R26-tdTomato (EPT) and Dcx-CreERT2; R26-D89E; R26-tdTomato (D89E) mice (n = 3 mice each) is shown (spreading, t(4) = 3.7, P = 0.022, unpaired t test; wrapping, t(4) = 4.0, P = 0.016, unpaired t test; pooled from three independent experiments). (D) Effect of MFG-E8D89E on microglial phagocytosis of spines of adult-born neurons in the DG. Representative single z-plane (D), orthogonal (D1), and surface-rendered 3D (D2) images of the ML of adult EPT mice (n = 4 mice) stained for PSD95 (yellow), CD68 (cyan), and Iba1 (green) are shown. tdTomato+ signals (red) are directly observed without staining. Arrowheads indicate PSD95+tdTomato+ spines incorporated in CD68+ lysosomes in Iba1+ microglial processes (D and D1). The percentages of PSD95+tdTomato+ spines incorporated in CD68+ lysosomes in Iba1+ microglial processes in adult EPT (n = 4 mice) and D89E (n = 3 mice) mice at 28 dpi are shown (D3; t(5) = 4.7, P = 0.0054, unpaired t test; pooled from three independent experiments). Also, see Video 6. (E and F) Effect of MFG-E8D89E on the survival of granule cells in the DG. Representative images of the DG in the hippocampus of adult EPT and D89E mice (n = 3 mice each) stained for DsRed (red) and NeuN (blue) are shown in E. Density of tdTomato+NeuN+ granule cells in EPT and D89E mice (n = 3 each) at 56 dpi is shown in F (pooled from three independent experiments). (G and H) Effect of MFG-E8D89E on the spine density of granule cells in the DG. Representative images (G) and densities of protrusions (H, P = 0.0025, Welch’s t test) and mushroom spines (H, t(36) = 2.7, P = 0.0098, unpaired t test) of dentate granule cells in EPT and D89E mice at 56 dpi (n = 3 mice each) are shown. Asterisks and arrows indicate mushroom spines and other protrusions, respectively (G). Parentheses in H indicate the number of analyzed cells. Data are pooled from two independent experiments. (I) Typical recordings of miniature EPSCs from tdTomato+ granule cells at 65–74 dpi in EPT (top) and D89E (bottom) mice. (J and K) Cumulative probability distributions of miniature EPSC amplitudes (J, bins: 0.5 pA; P = 0.013, two-sample Kolmogorov–Smirnov test) and interevent intervals (K, bins: 50 ms; P = 0.0014, two-sample Kolmogorov–Smirnov test) in EPT (n = 8 cells from four mice, pooled from four independent experiments) and D89E mice (n = 6 cells from three mice, pooled from three independent experiments). SGZ, subgranular zone; GCL, granule cell layer; ML, molecular layer. Scale bars: A, 5 µm; B and D, 1 µm; G, 2 µm; E, 10 µm. *, P < 0.05; **, P < 0.01; ***, P < 0.005. Data shown are mean ± SEM.

References

    1. Andoh, M., Shibata K., Okamoto K., Onodera J., Morishita K., Miura Y., Ikegaya Y., and Koyama R.. 2019. Exercise reverses behavioral and synaptic abnormalities after maternal inflammation. Cell Rep. 27:2817–2825.e5. 10.1016/j.celrep.2019.05.015 - DOI - PubMed
    1. Asano, K., Miwa M., Miwa K., Hanayama R., Nagase H., Nagata S., and Tanaka M.. 2004. Masking of phosphatidylserine inhibits apoptotic cell engulfment and induces autoantibody production in mice. J. Exp. Med. 200:459–467. 10.1084/jem.20040342 - DOI - PMC - PubMed
    1. Belevich, I., Joensuu M., Kumar D., Vihinen H., and Jokitalo E.. 2016. Microscopy image browser: A platform for segmentation and analysis of multidimensional datasets. PLoS Biol. 14:e1002340. 10.1371/journal.pbio.1002340 - DOI - PMC - PubMed
    1. Breton-Provencher, V., Bakhshetyan K., Hardy D., Bammann R.R., Cavarretta F., Snapyan M., Côté D., Migliore M., and Saghatelyan A.. 2016. Principal cell activity induces spine relocation of adult-born interneurons in the olfactory bulb. Nat. Commun. 7:12659. 10.1038/ncomms12659 - DOI - PMC - PubMed
    1. Breton-Provencher, V., Cote D., and Saghatelyan A.. 2014. Activity of the principal cells of the olfactory bulb promotes a structural dynamic on the distal dendrites of immature adult-born granule cells via activation of NMDA receptors. J. Neurosci. 34:1748–1759. 10.1523/JNEUROSCI.3013-13.2014 - DOI - PMC - PubMed

Publication types