. 2022 Apr 1;149(7):dev199640.
doi: 10.1242/dev.199640. Epub 2022 Apr 5.

Regenerating vascular mural cells in zebrafish fin blood vessels are not derived from pre-existing mural cells and differentially require Pdgfrb signalling for their development

Affiliations

Regenerating vascular mural cells in zebrafish fin blood vessels are not derived from pre-existing mural cells and differentially require Pdgfrb signalling for their development

Elvin V Leonard et al. Development. .

Abstract

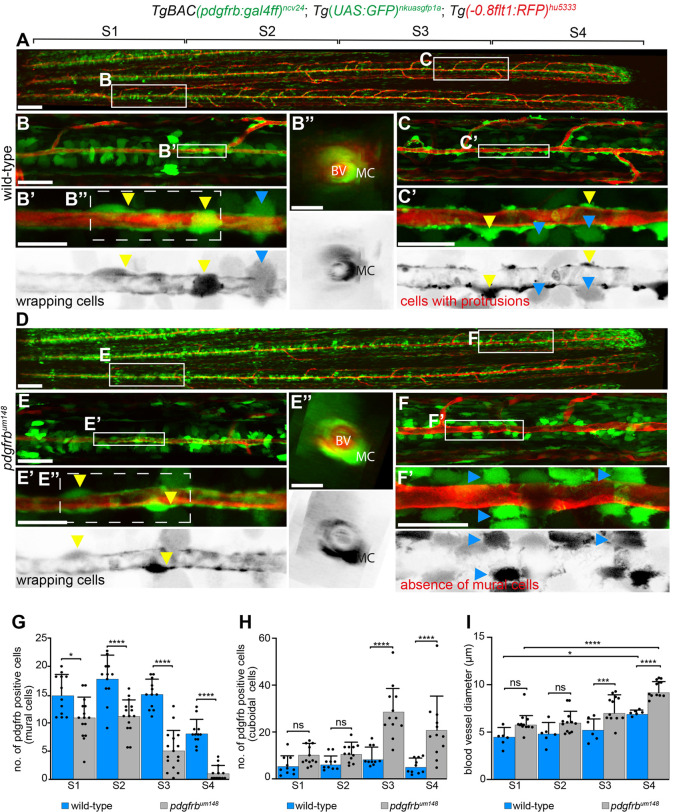
Vascular networks comprise endothelial cells and mural cells, which include pericytes and smooth muscle cells. To elucidate the mechanisms controlling mural cell recruitment during development and tissue regeneration, we studied zebrafish caudal fin arteries. Mural cells colonizing arteries proximal to the body wrapped around them, whereas those in more distal regions extended protrusions along the proximo-distal vascular axis. Both cell populations expressed platelet-derived growth factor receptor β (pdgfrb) and the smooth muscle cell marker myosin heavy chain 11a (myh11a). Most wrapping cells in proximal locations additionally expressed actin alpha2, smooth muscle (acta2). Loss of Pdgfrb signalling specifically decreased mural cell numbers at the vascular front. Using lineage tracing, we demonstrate that precursor cells located in periarterial regions and expressing Pgdfrb can give rise to mural cells. Studying tissue regeneration, we did not find evidence that newly formed mural cells were derived from pre-existing cells. Together, our findings reveal conserved roles for Pdgfrb signalling in development and regeneration, and suggest a limited capacity of mural cells to self-renew or contribute to other cell types during tissue regeneration.

Keywords: Blood vessel; Caudal fin; Mural cell; Pdgfrb signalling; Tissue regeneration; Zebrafish.


Conflict of interest statement

Competing interests The authors declare no competing or financial interests.

Figures

Fig. 1.
Fig. 1.
Pdgfrb expression marks distinct cell populations in developing zebrafish fins. Maximum intensity projections of confocal z-stacks of TgBAC(pdgfrb:citrine)s1010; Tg(-0.8flt1:RFP)hu5333 double transgenic fish labelling arterial ECs (red) and pdgfrb-positive cells (green) in lateral views with anterior towards the left. (A) Schematic representation of time course of the study (1 to 4 wpf). (B) Citrine-expressing cells colonize axial vessels at 1 wpf. Scale bar: 20 µm. (B′) The outlined area in B showing association of mural cells with arteries (white arrowheads). Scale bar: 10 µm. (C) Citrine-expressing cells at 2 wpf. Scale bar: 30 µm. (C,C″) The outlined areas in C show the association of individual mural cells with arteries (white arrowheads). Clusters of oval shaped cells at 2 wpf are indicated (yellow arrowheads, C″). Scale bar: 10 µm. (D) Vasculature at 3 wpf. Scale bar: 70 µm. The outlined area enlarged in D′ shows the association of citrine-expressing cells (white arrowheads) with arteries. Scale bar: 15 µm. (E) Caudal fin vasculature at 4 wpf; asterisks indicate the four blood vessels used for quantification. DL, dorsal fin lobe; VL, ventral fin lobe. Scale bar: 100 µm. The outlined area enlarged in E′ shows citrine-expressing cells along arteries (white arrowheads). Scale bar: 30 µm. Numbers represent individual animals analysed. (F) Caudal fin at 4 wpf. Scale bar: 20 µm. S1-S4 represent segments used for quantification. (G) Proximal segment. Scale bar: 10 µm. The area indicated by a solid outline is enlarged in G′ and shows citrine-expressing cells wrapping around blood vessels. Scale bar: 7 µm. The area indicated by a dashed outline is enlarged in G″ and shows citrine-expressing mural cells (MCs) on blood vessels (BVs), oval shaped cells (OCs) surrounding vessels (yellow arrowheads) and citrine-expressing cuboidal-shaped cells (CUs, pseudo-coloured in green) between the mural cells and oval-shaped cells. Scale bar: 5 µm. (H) Distal segment of caudal fin blood vessel. Scale bar: 10 µm. The outlined area enlarged in H′ shows citrine-expressing cells with protrusions (red arrowhead). Citrine-expressing cuboidal cells are highlighted in green. Scale bar: 7 µm. (I) Classification of citrine-expressing cells based on their dimensions. Mann-Whitney test, n=20 for each cell type. ***P=0.0001, ****P≤0.0001. (J) Quantification of citrine-expressing mural cells across segments. One-way ANOVA [n=20 caudal fin arteries from five different fish (average size 1194 µm)]. ****P≤0.0001. (K) Quantification of cell morphologies of TgBAC(pdgfrb:gal4ff)ncv24; Tg(UAS:GFP)nkuasgfp1a-expressing cells. One-way ANOVA [n=12 caudal fin arteries from six individual fish (average length 1673 µm)]. ***P≤0.0002, ****P≤0.0001. (L,M) Maximum intensity projections of confocal z-stacks of TgBAC(pdgfrb:gal4ff)s1999; Tg(UAS:Kaede)ncv24 mural cells. Non-overlapping cells (L) and overlapping cells (M). Scale bars: 10 µm.
Fig. 2.
Fig. 2.
Co-expression of myh11a and pdgfrb distinguishes vascular mural cells from other pdgfrb-expressing cell populations. Maximum intensity projections of confocal z-stacks of Tg(-0.8flt1:RFP)hu5333; TgBAC(myh11a:YFP)mu125 double transgenic fish labelling arterial ECs (red) and YFP-positive cells (blue); lateral views, anterior towards the left. (A) Caudal fin of 4 wpf fish. Scale bar: 100 µm. S1-S4 represent the four segments used for quantifying the distribution of YFP-expressing cells. Areas shown enlarged in B-E are indicated. (B) Proximal segment. Scale bar: 10 µm. (B′) The area outlined in B showing YFP-positive cells wrapping around blood vessels. (C-E) Mid-vessel and distal segments of a caudal fin blood vessel. The outlined areas are enlarged in C′-E′. Scale bar: in B′, 7 µm for B′-E′. (F) Quantification of YFP-positive cell distribution. One-way ANOVA [n=16 caudal fin arteries from 8 individual fish (average length: 1006 µm)]. **P=<0.0012, ****P=<0.0001, n.s., not significant. Data are mean±s.d. (G) Maximum intensity projections of confocal z-stacks of TgBAC(pdgfrb:mCherry)ncv23; TgBAC(myh11a:YFP)mu125 double transgenic fish in lateral views with anterior towards the left. Caudal fin of 4 wpf fish. Scale bar: 100 µm. S1-S4 represent the four segments used for quantification. (H-L) Proximal (H), mid-vessel (I) and distal (K,L) segments of double transgenic fish. Scale bar: 10 µm. (H′-L′) The areas outlined in H-L showing the overlap of mCherry and YFP fluorophores (L′, red arrowheads). Cuboidal cells express only pdgfrb:mCherry (L′, magenta asterisks). Scale bar: 10 µm. (M) Quantification of the distribution of myh11a/pdgfrb-positive cells. One-way ANOVA [n=8 caudal fin arteries from 5 individual fish (average length:1938 µm)]. ***P≤0.000, ****P≤0.0001; n.s., not significant. Data are mean±s.d. (N) Schematic illustrating the distribution of different fin cell populations.
Fig. 3.
Fig. 3.
Differential Notch signalling coincides with acta2 expression along the proximo-distal axis. (A-C,E-G) Maximum intensity projections of confocal z-stacks of TgBAC(acta2:mCherry)ca8; TgBAC(myh11a:YFP)mu125 fins, labelling myh11a-positive cells (green) and acta2-positive cells (red). (A) Caudal fin of 4 wpf fish. Scale bar: 80 µm. (B) Mural cells expressing myh11a (white arrowheads) or myh11a/acta2 (blue arrowheads). Scale bar: 5 µm. (C) Mural cells in distal region. Scale bar: 5 µm. (D) Distribution of myh11a and myh11a/acta2 double-positive cells along proximal and distal segments. One-way ANOVA [n=5 fin rays from three different fish (average length: 1707 µm)]. *P=0.0355, **P=0.0072, n.s., not significant. Data are mean±s.d. Individual data points represent individual fin rays. (E) Caudal fin of 6 wpf fish. Scale bar: 100 µm. (F) Mural cell expressing myh11a (white arrowhead) or myh11a/acta2 (blue arrowhead). Scale bar: 10 µm. (G) Mural cells in distal regions express only myh11a. Scale bar: 10 µm. (H) Distribution of myh11a and myh11a/acta2-positive cells. One-way ANOVA [n=6 fin rays from six different fish (average length: 2381 µm)]. **P=0.0039, n.s., not significant. Data are mean±s.d. Individual data points represent individual fin rays. (I-K) Maximum intensity projections of TgBAC(acta2:mCherry)ca8; Tg(TP1bglob:VenusPEST)s940 fins, labelling acta2-positive cells (red) and those with activated notch signaling (green). (I) Caudal fin of 4 wpf fish. Scale bar: 70 µm. (J) notch positive/acta2 negative (blue arrowheads); notch negative/acta2 positive (green arrowheads); notch positive/acta2 positive (orange arrowheads). Scale bar: 10 µm. (K) Mural cell in distal segment. Scale bar: 5 µm. (L) Distribution of acta2 and cells with notch pathway activation. One-way ANOVA [n=16 fin rays from five different fish (average length: 1947 µm)]. n.s., not significant; ***P<0.0006. Data are mean±s.d.
Fig. 4.
Fig. 4.
Cuboidal and pdgfrb-expressing cells differentiate into mural cells during caudal fin artery development. Maximum intensity projections of confocal z-stacks of TgBAC(pdgfrb:gal4ffncv24tg); Tg(UAS:GFP)nkuasgfp1a; TgBAC(pdgfrb:H2B-dendra2)mu158 fins, labelling pdgfrb-positive cells (green). (A,A′) Photoconverted nuclei at 0 and 5 dpc. Scale bars: 20 μm in A; 30 μm in A′. The outlined areas enlarged in B-D show photoconverted individual cells (blue arrowheads) at 0 dpc. Scale bars: in B, 15 µm for B; in C, 20 µm for C,D. The outlined areas enlarged in B′-D′ shows photoconverted cells (blue arrowheads) extending protrusions (white arrowheads). Scale bar: 20 µm. (E,E′) Photoconverted nuclei at 0 and 5 dpc (blue arrowheads). Scale bars: 20 µm. (F) Total number of photoconverted cells at 0 dpc and photoconverted cells extending protrusions at 5 dpc. (G) Number of photoconverted cuboidal cells at 0 dpc (green circle), cells that remained cuboidal (blue circle) and cells that extended protrusions (red circle) at 5 dpc. Data represent number of individual cells photoconverted per fin ray (14 fin rays) from n=8 individual fish.
Fig. 5.
Fig. 5.
Expression of pdgfrb and col1a2 in cuboidal and mural cells. Maximum intensity projections of confocal z-stacks of TgBAC(pdgfrb:mCherry)ncv23; TgBAC(col1a2:GFP)ca103 fins, labelling pdgfrb-positive cells (red) and col1a2-positive cells (green). (A-D) Caudal fin of 4 wpf fish. Scale bar: 100 µm for A. (B) Mural cells in the proximal segments express only pdgfrb and no col1a2. Scale bar: 7 μm. (C) Cuboidal cells express both pdgfrb and col1a2 (magenta arrowheads), while mural cell express only pdgfrb (green arrowheads). (D) Distal segments contain mural cells (blue arrowheads) and cuboidal cells (magenta arrowheads) expressing both pdgfrb and col1a2. (E) Number of cuboidal and mural cells in D. Unpaired t-test. ***P=0.0029, n=4 different fish. Individual data points represent individual fin rays. (F) Schematic representation of cell types labelled in caudal fin of TgBAC(pdgfrb:mCherry)ncv23; TgBAC(myh11a:YFP)mu125 double transgenic fish. (G) Relative expression of genes in pdgfrb/myh11a (RFP/YFP) positive cells compared with expression in pdgfrb only (RFP)-expressing cells was set as 1 (or 0 in log2 fold change). Individual data points represent log2 fold change, from independent experiments; dCt values from independent experiments was used to calculate significance. One-way ANOVA. n.s., not significant; *P= 0.0177, **P≤0.0032, ***P≤0.0005, ****P≤0.0001. Data are mean±s.d.
Fig. 6.
Fig. 6.
Mural cell recruitment to caudal fin arteries requires Pdgfrb signalling. Maximum intensity projections of confocal z-stacks of TgBAC(pdgfrb:gal4ff)ncv24tg; Tg(UAS:GFP)nkuasgfp1a; Tg(-0.8flt1:RFP)hu5333 fish. (A) Caudal fin artery in wild-type fish at 5 wpf. Scale bar: 100 µm. (B,C) Proximal and distal segments. Scale bar: 10 µm. (B′,C′) The outlined areas in B,C showing mural (yellow arrowheads) and cuboidal (blue arrowheads) cells. Scale bar: 3 µm. (B″) The outlined area in B′ showing mural cells in proximal regions. Scale bar: 3 µm. (D) Caudal fin vessel in pdgfrbum148 mutant fish at 5 wpf. Scale bar: 100 µm. (E,F) Proximal and distal segments. Scale bar: 10 µm. (E′,F′) The outlined areas in E,F showing mural (yellow arrowheads) and cuboidal (blue arrowheads) cells. Scale bar: 3 µm. (E″) The outlined area in E′ showing mural cells wrapping around artery. Scale bar: 3 µm (G) Quantification of mural cell distribution across fin segments in wild-type and pdgfrbum148 fish. One-way ANOVA. n=12 fin rays from six different fish for wild type (average length: 2509 µm), n=15 fin rays from eight different fish for mutant (average length: 2377 µm). n.s., not significant; *P=0.0215, ****P=<0.0001. Data are mean±s.d. Individual data points represent individual fin rays. (H) Quantification of cuboidal cells in wild-type and pdgfrbum148 fish. One-way ANOVA. n=10 fin rays from six different fish for wild type, n=12 fin rays from six different fish for mutant. n.s., not significant, ****P≤0.0001. Data are mean±s.d. Individual data points represent individual fin rays. (I) Artery diameter along the proximal distal axis in wild-type and pdgfrbum148 fish; mutant fish display dilated vessels. One-way ANOVA. n=6 fin rays from six different fish for wild type, n=12 fin rays from six different fish for mutant. n.s., not significant; *P≤0.0132, ***P=0.0005, ****P≤0.0001. Data are mean±s.d. Individual data points represent individual fin rays.
Fig. 7.
Fig. 7.
Pdgfrb signalling regulates mural cell recruitment during fin regeneration. (A) Schematic representation of experimental approach to study blood vessel growth in regenerating tissue. Maximum intensity projections of TgBAC(pdgfrb:citrine)s1010; Tg(-0.8flt1:RFP)hu5333 fish. (B) Regenerating fin at 3 dpi. Scale bar: 50 μm. (C) Citrine-positive oval cells (asterisks). Scale bar: 30 μm. (D,E) Recruitment of mural cells (arrowheads). Scale bar: 50 μm. (F) Quantification of mural cells. Mann-Whitney test, n=5 fish for each time point. n.s., not significant; Data are mean±s.d. **P=0.0079. (G) Mural cell recruitment in wild-type fish. Scale bar: 50 μm. (H) Uninjured bone segment of wild-type fish. Scale bar: 20 μm. The outlined area is enlarged on the right showing mural cells (white arrowheads). Scale bar: 8 μm. (I) Regenerated bone segment at 7 dpi. Scale bar: 20 μm. The outlined area is enlarged on the right showing mural cells (white arrowheads). Scale bar: 8 μm. (J) Mural cell recruitment in pdgfrbum148 mutant fish. Scale bar: 50 μm (K) Uninjured bone segment. Scale bar: 20 μm. The outlined area is enlarged on the right showing cuboidal cells. Scale bar: 8 μm (L) Regenerated bone segment at 7 dpi. Scale bar: 20 μm. The outlined area is enlarged on the right showing a decrease in mural cells (white arrowheads). Scale bar: 8 μm. (M) Quantification of mural cell numbers in wild-type and pdgfrbum148 fish. Mann–Whitney test, n=7 fish. Data are mean±s.d. ***P=0.0006.
Fig. 8.
Fig. 8.
Pre-existing mural cells are not a major source of mural cells during fin regeneration. (A) Schematic representation of the experimental approach to study fin regeneration. Maximum intensity projections of TgBAC(pdgfrb:H2B-dendra2)mu158. (B) Fin ray 12 hpi. Green to red photoconversion was performed above and below the site of injury. Scale bar: 100 µm. (C) Photoconverted cells showing red Dendra2 protein. Enlarged area shows the individual nuclei of photoconverted cells. Scale bar: 30 µm. (D) Regenerated fin ray at 5 dpi. Scale bar: 50 µm. (E) Newly made Dendra2 protein (green only) and previously photoconverted Dendra2 protein (green and red). Scale bar: 30 µm. Data are from n=3 fish.
Fig. 9.
Fig. 9.
Pre-existing mural cells retain their position during regeneration, while newly formed cells require Pdgfrb signalling. Maximum intensity projections of confocal z-stacks of TgBAC(pdgfrb:gal4ff)ncv24; Tg(UAS:GFP)nkuasgfp1a; Tg(-0.8flt1:RFP)hu5333 fish. (A-E) Regeneration of injured tissue (1-7 dpi). Scale bars: 50 µm for A and E. (B-D) The outlined areas show mural cells (red arrowheads, numbered) on blood vessels (cyan) in proximal (D), regenerating (C) and distal end (B) injured fin. Scale bar: 10 µm. New mural cells are marked by asterisks. Data are from n=3 fish. (F) Maximum intensity projections of TgBAC(pdgfrb:mCherry)ncv23; TgBAC(col1a2:GFP)ca103 fish. Regeneration of injured fin (3-5 dpi). The outlined areas show col1a2/pdgfrb double-positive cells (marked in white, red and green). Scale bar: 10 µm. (G) Quantification of col1a2/pdgfrb double-positive cells in 3-5 dpi fin. Individual data points represent individual fish analysed. Unpaired t-test (n=3 animals). *P=0.0284.

Similar articles

Cited by

References

    1. Alunni, A. and Bally-Cuif, L. (2016). A comparative view of regenerative neurogenesis in vertebrates. Development 143, 741-753. 10.1242/dev.122796 - DOI - PMC - PubMed
    1. Ando, K., Fukuhara, S., Izumi, N., Nakajima, H., Fukui, H., Kelsh, R. N. and Mochizuki, N. (2016). Clarification of mural cell coverage of vascular endothelial cells by live imaging of zebrafish. Development 143, 1328-1339. 10.1242/dev.132654 - DOI - PMC - PubMed
    1. Ando, K., Shih, Y.-H., Ebarasi, L., Grosse, A., Portman, D., Chiba, A., Mattonet, K., Gerri, C., Stainier, D. Y. R., Mochizuki, N.et al. (2021). Conserved and context-dependent roles for pdgfrb signaling during zebrafish vascular mural cell development. Dev. Biol. 479, 11-22. 10.1016/j.ydbio.2021.06.010 - DOI - PMC - PubMed
    1. Ansell, D. M. and Izeta, A. (2015). Pericytes in wound healing: friend or foe? Exp. Dermatol. 24, 833-834. 10.1111/exd.12782 - DOI - PubMed
    1. Armulik, A., Genové, G. and Betsholtz, C. (2011). Pericytes: developmental, physiological, and pathological perspectives, problems, and promises. Dev. Cell 21, 193-215. 10.1016/j.devcel.2011.07.001 - DOI - PubMed

Publication types

MeSH terms

Substances

LinkOut - more resources