. 2022 Jul;29(7):2138-2143.
doi: 10.1111/ene.15327. Epub 2022 Mar 30.

Posterior cortical atrophy: Primary occipital variant

Affiliations

Posterior cortical atrophy: Primary occipital variant

Dror Shir et al. Eur J Neurol. 2022 Jul.

Abstract

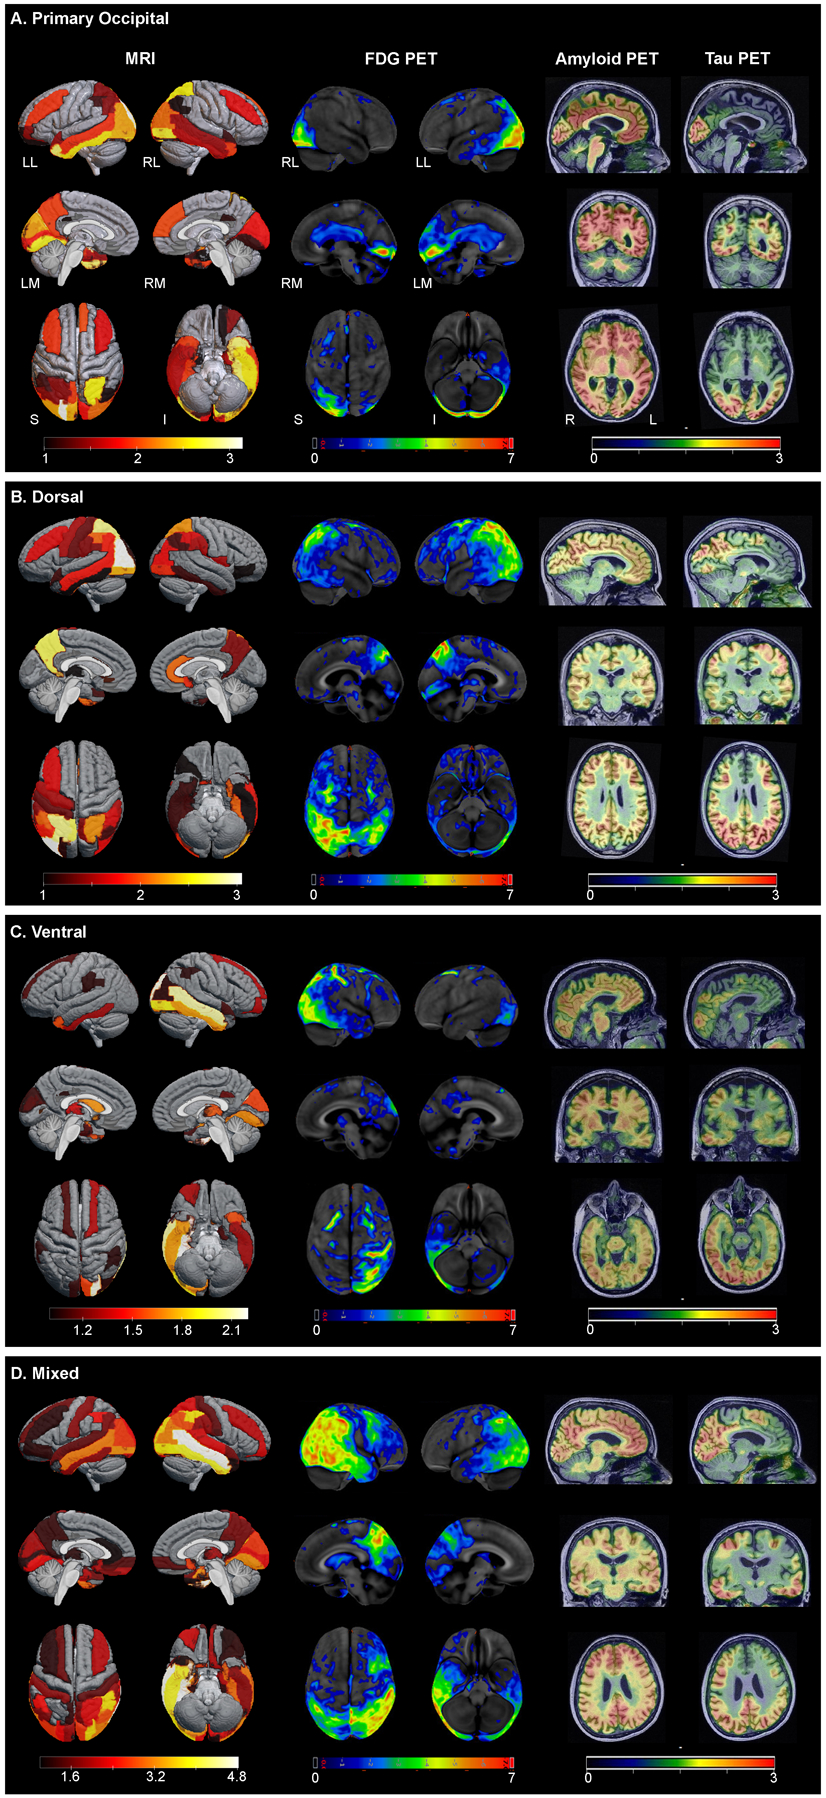
Background: Posterior cortical atrophy (PCA) is one of the atypical Alzheimer's disease variants, characterized by predominant visuospatial and visuoperceptual deficits, with established dorsal and ventral subtypes. A third primary occipital (caudal) variant has been suggested. We aimed to determine its demographics, clinical manifestations, and biomarker findings.

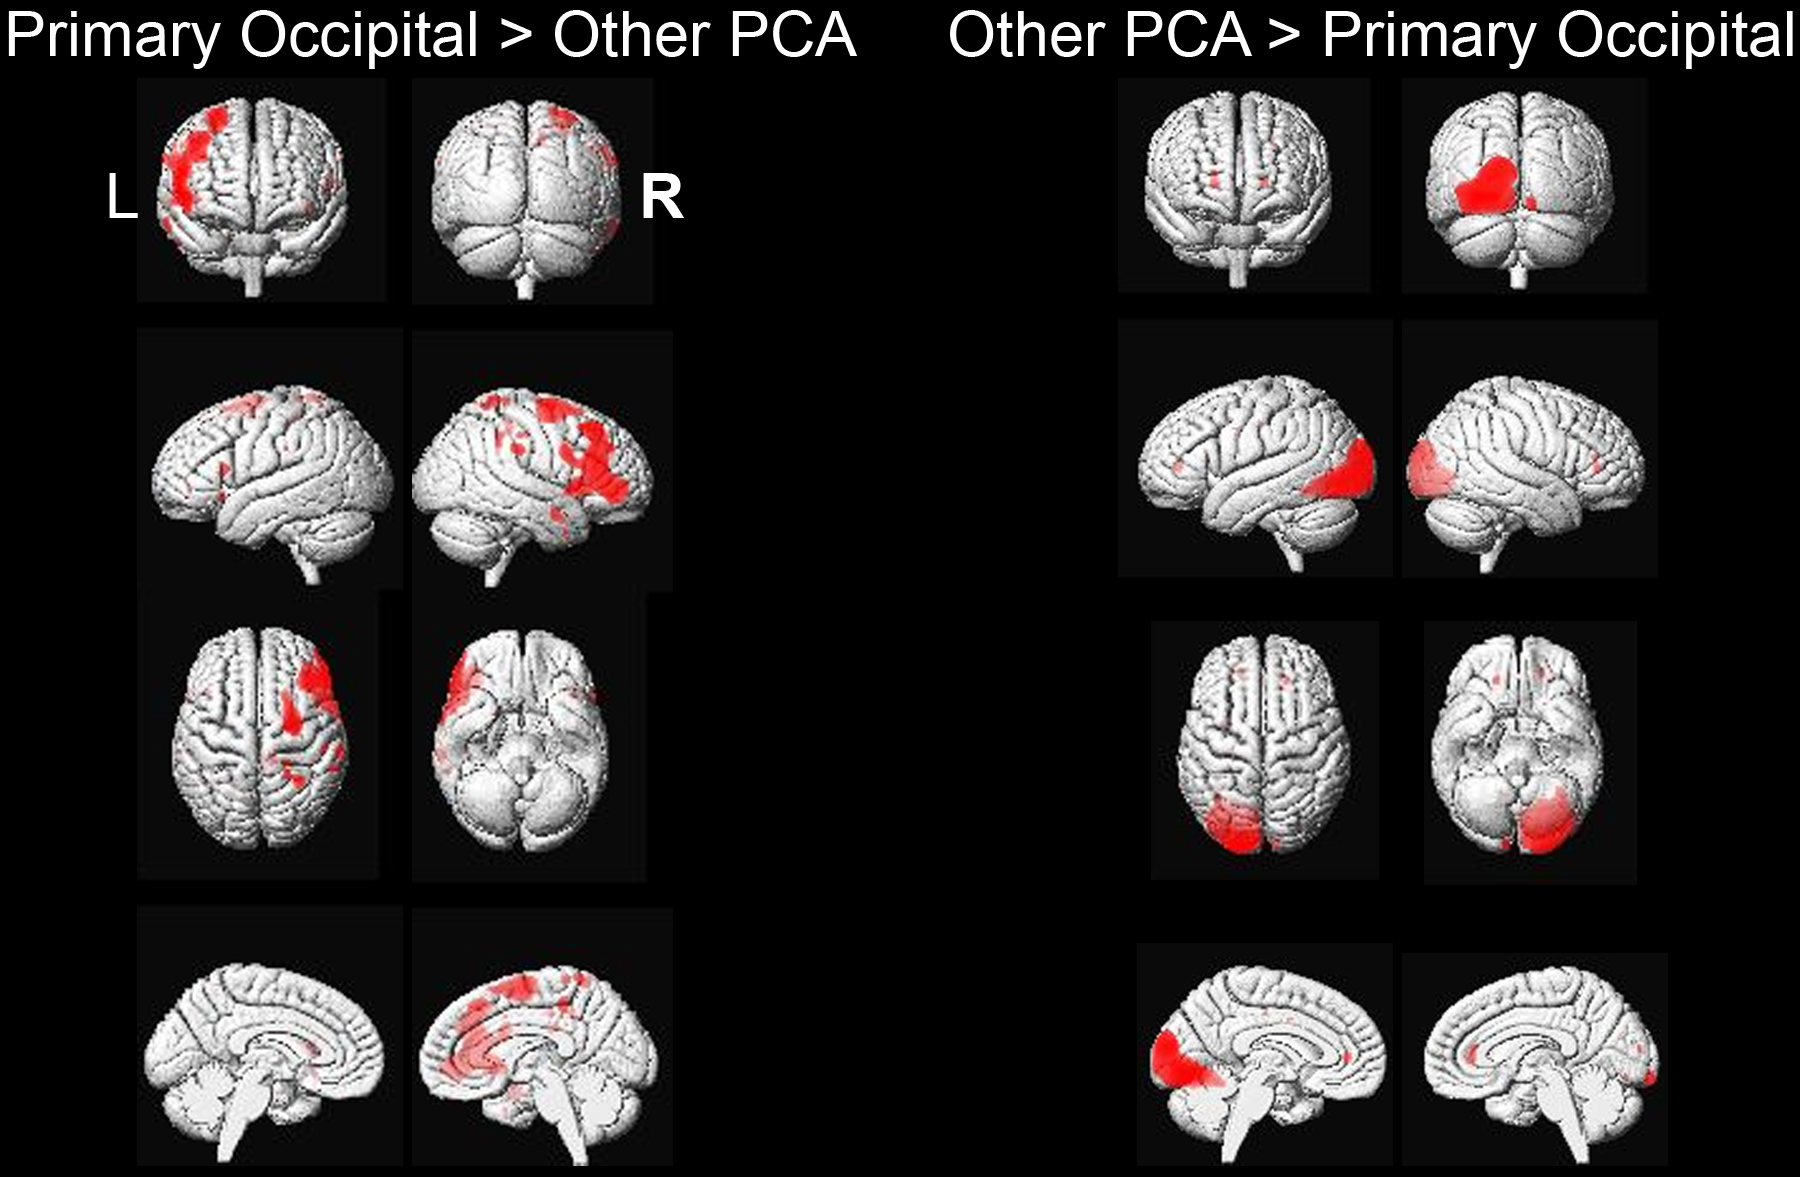
Methods: Fifty-two PCA patients were investigated. Patients underwent neuropsychological assessment, magnetic resonance imaging, and fluorodeoxyglucose (FDG)-, amyloid-, and tau-positron emission tomography (tau-PET) scans. Normalized regional FDG-PET values were represented as z-scores relative to a control population. Patients were divided into "primary occipital" and "other PCA" subgroups according to FDG-PET-defined criteria, with primary occipital defined as patients in which the z-scores for occipital subregions were at least one standard deviation lower (SD) (i.e., more abnormal) than the z-scores in all other brain regions. Global amyloid-PET, temporo-parietal FDG-PET, and temporal tau-PET regions-of-interest (ROIs) were calculated.

Results: Nine patients were classified as primary occipital; they were older (p = 0.034) and had more years of education (p = 0.007) than other PCA patients. The primary occipital group performed worse on the Ishihara test for color perception (p < 0.001), while other PCA patients performed worse on the Western Aphasia Battery (WAB) praxis scale (p = 0.005). Overall neuropsychiatric symptom burden was lower in the primary occipital group (p < 0.001). The FDG-PET meta-ROI was higher in the primary occipital subtype (p = 0.006), but no differences were observed in amyloid- and tau-PET.

Conclusions: Our findings suggest that primary occipital PCA is characterized by an older age at onset, more color perception dysfunction, less severe ideomotor apraxia, and less hypometabolism in temporo-parietal meta-ROI compared to established phenotypes.

Keywords: Alzheimer's disease; posterior cortical atrophy; visuospatial impairment.


Figures

Figure 1.A.
Figure 1.A.
SPM results comparing FDG-PET hypometabolism of primary occipital versus other PCA patients, uncorrected for multiple comparisons at p<0.001. Results have been overlaid on a 3D brain render that was constructed using averaged brain segmentations from 202 cognitively normal and Alzheimer’s disease patients (https://www.nitrc.org/projects/mcalt/).
Figure 1.B.
Figure 1.B.
Structural MRI (left), FDG-PET (center), and amyloid- and tau-PET (right) across PCA phenotypes: (A) Primary Occipital; (B) Dorsal; (C) Ventral; (D) Mixed. Representatives of the different phenotypes were selected based on visual inspection and confirmed by consensus FDG-PET scan review (JGR, KAJ, JLW, DS). The left MRI panels show regional Z scores depicting volume loss compared to controls on three-dimensional brain renderings using MRIcroGL Viewer. Grey regions are within the volume range of healthy controls, while colored areas indicate volume loss, white indicating the greatest volume loss. Middle panels show Z-scores, relative to a normative database, of pons intensity normalized FDG-PET scans for each individual displayed on stereotactic surface projections using Cortex ID (GE Healthcare Waukesha, WI, USA). Red color indicates greater hypometabolism. The cerebellar crus intensity normalized Amyloid- and Tau-PET scans are overlaid on the grey matter segmentations of each patient’s own T1 weighted structural MRI scan. Red color indicates higher intensity of tracer. LL – Left Lateral, RL – Right Lateral, LM – Left Medial, RM – Right Medial, S – Superior, I – Inferior.

References

    1. Graff-Radford J, Yong KXX, Apostolova LG, et al. New insights into atypical Alzheimer’s disease in the era of biomarkers. Lancet Neurol. 2021;20(3):222–234. doi:10.1016/S1474-4422(20)30440-3 - DOI - PMC - PubMed
    1. Whitwell JL, Dickson DW, Murray ME, et al. Neuroimaging correlates of pathologically defined subtypes of Alzheimer’s disease: A case-control study. Lancet Neurol. 2012;11(10):868–877. doi:10.1016/S1474-4422(12)70200-4 - DOI - PMC - PubMed
    1. Tang-Wai DF, Graff-Radford NR. Looking into posterior cortical atrophy: Providing insight into Alzheimer disease. Neurology. 2011;76(21):1778–1779. doi:10.1212/WNL.0b013e31821ccd4f - DOI - PubMed
    1. Crutch SJ, Schott JM, Rabinovici GD, et al. Consensus classification of posterior cortical atrophy. Alzheimer’s Dement. 2017;13(8):870–884. doi:10.1016/j.jalz.2017.01.014 - DOI - PMC - PubMed
    1. Townley RA, Botha H, Graff-Radford J, et al. Posterior cortical atrophy phenotypic heterogeneity revealed by decoding 18F-FDG-PET. Brain Commun. 2021;3(4):1–13. doi:10.1093/braincomms/fcab182 - DOI - PMC - PubMed

Publication types

Substances