

Autologous, lentivirus-modified, T-rapa cell "micropharmacies" for lysosomal storage disorders
- PMID: 35298086
- PMCID: PMC8988206
- DOI: 10.15252/emmm.202114297
Autologous, lentivirus-modified, T-rapa cell "micropharmacies" for lysosomal storage disorders
Abstract
T cells are the current choice for many cell therapy applications. They are relatively easy to access, expand in culture, and genetically modify. Rapamycin-conditioning ex vivo reprograms T cells, increasing their memory properties and capacity for survival, while reducing inflammatory potential and the amount of preparative conditioning required for engraftment. Rapamycin-conditioned T cells have been tested in patients and deemed to be safe to administer in numerous settings, with reduced occurrence of infusion-related adverse events. We demonstrate that ex vivo lentivirus-modified, rapamycin-conditioned CD4+ T cells can also act as next-generation cellular delivery vehicles-that is, "micropharmacies"-to disseminate corrective enzymes for multiple lysosomal storage disorders. We evaluated the therapeutic potential of this treatment platform for Fabry, Gaucher, Farber, and Pompe diseases in vitro and in vivo. For example, such micropharmacies expressing α-galactosidase A for treatment of Fabry disease were transplanted in mice where they provided functional enzyme in key affected tissues such as kidney and heart, facilitating clearance of pathogenic substrate after a single administration.
Keywords: T cells; gene therapy; lentivirus; lysosomal storage disorders.
© 2022 The Authors. Published under the terms of the CC BY 4.0 license.
Figures
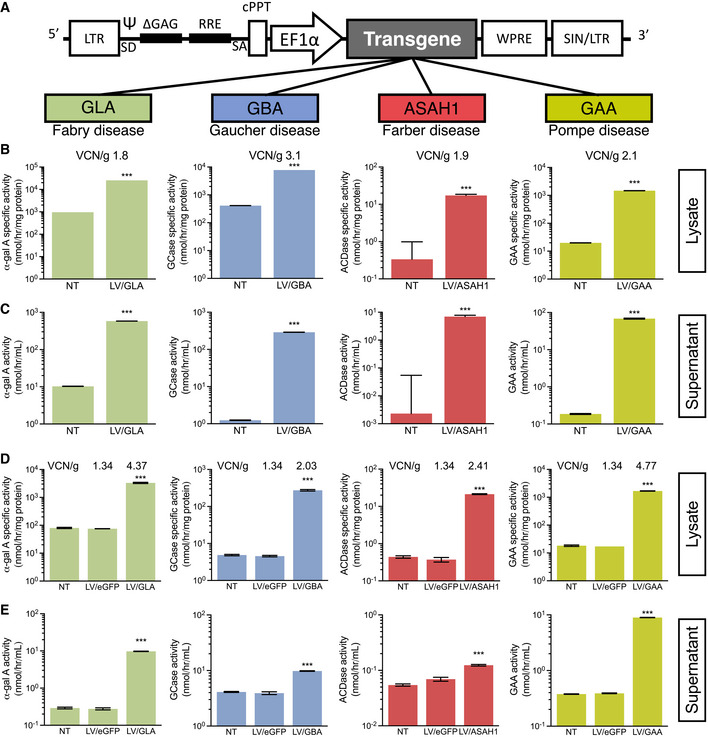
- A
Schematic of the modified HIV‐1‐derived lentiviral backbone used in this study.
- B, C
Lentiviral vectors (LVs) were packaged and used to transduce HEK293T cells—vector copy number per genome (VCN/g) for each HEK293T line are indicated in (B). Enzyme activities in lysates (intracellular; B) and supernatants (secreted; C) were measured.
- D, E
LVs were used to transduce Jurkat cells—VCN/g for each Jurkat line are indicated in (D). Enzyme activities in lysates (intracellular; D) and supernatant (secreted; E) enzyme activities were measured.

- A
Schematic of TRaM production. CD4+ T cells were enriched by positive selection from leukaphereses of multiple HDos and 3 FDos—details are provided in Materials and Methods.
- B
Enzyme compartments that are measured in C‐I and Fig EV4G; intracellular, total secreted and colloidal particles (enclosed in red and yellow circles).
- C
HDo‐TRaMs were engineered with vectors relevant to treatment of Fabry, Gaucher, Farber, and Pompe diseases. Intracellular lysosomal enzyme specific activities were measured in transduced T‐Rapa and controls. Transductions varied across vectors/donors, as indicated.
- D, E
Enzyme activity was assessed in transduced T‐Rapa supernatants compared to controls in activated/dividing (D) and quiescent/resting (E) states.
- F
Cells from all FDo were stably transduced, as indicated. Intracellular α‐galactosidase A (α‐gal A)‐specific activities were determined.
- G, H
Secreted α‐gal A activity was measured from FDo‐derived TRaMs in activated (G), and quiescent/resting (H) states.
- I
α‐Gal A‐specific activity in Fabry patient‐derived skin fibroblasts after 6 h of exposure to conditioned media from TRaMs in the presence or absence of 1 mM M6P.

Viability of rapamycin‐conditioned T cells was compared to control T cells after a freeze–thaw cycle by trypan blue exclusion.
Rapamycin‐conditioned or control cells were thawed and seeded for culture with CD3/CD28 T‐Activator beads. Live cells, as determined by trypan blue exclusion, were counted every day.

CD4+ T cells from HDo or FDo were cultured with CD3/CD28 T‐Activator beads and 1 µM rapamycin for 3 days and harvested to perform Western blots for markers of mTOR inhibition.
Relative expression of phosphorylated mTOR targets were determined from densitometry of Western blots; intensities were normalized to β‐Actin, then to total protein, then to results from control cells.
FDo‐ and HDo‐derived TRaMs were seeded with CD3/CD28 T‐Activator beads for 24 h and secreted cytokines were measured by a Luminex assay using a custom multiplex panel.
Transduced FDo TRaMs and controls (from three independent donors) were seeded with CD3/CD28 T‐Activator beads for 2 days. Live cells were counted by trypan blue exclusion.

- A
Supernatants from culture of NT and LV/GLA HDo‐TRaMs, and recombinant α‐gal A were digested with the indicated glycosidases and Western blot with anti‐α‐gal A antibody was performed.
- B
α‐Gal A specific activity in Fabry patient‐derived skin fibroblasts after 6 h of exposure to conditioned media from HDo‐TRaMs in the presence or absence of 1 and 10 mM M6P.
- C
Schematic of the series of centrifugation steps used to clear FDo‐TRaM conditioned media of particulates.
- D
Enzyme activity was measured in conditioned media before (input) and after (particle‐depleted) ultracentrifugation.
- E, F
Nanoparticle tracking analysis was used to measure size distribution (E) and concentration (F) of colloidal particles collected after the final ultracentrifugation.
- G
α‐Gal A specific activities in colloidal particles isolated from conditioned media by ultracentrifugation were determined.
- H
Immunofluorescent microscopy of Fabry patient‐derived fibroblasts after culture with NT or LV/GLA 293T conditioned supernatant. For each condition, a representative image is shown with enlarged section from white box to the right. White arrows indicate cells in which enzyme has been taken up and is co‐localized with lysosomal staining.

- A
Schematic of the transplant protocol optimized for T‐Rapa cells. NOD/SCID/Fabry (NSF) mice were conditioned and TRaMs were administered intravenously—details are indicated in Materials and Methods. Mice were euthanized 4 weeks post‐infusion.
- B
Engraftment was evaluated by flow cytometry for human CD3 expression.
- C, D
α‐Gal A activity in plasma, and specific activities in liver, spleen, heart, and kidneys were measured after transplant of transduced healthy donor (HDo)‐derived (C) or Fabry donor (FDo)‐derived (D) TRaMs, non‐transduced (NT) cells, or in sham‐treated NOD/SCID (NS) and NSF mice.

- A, B
Levels of globotriaosylceramide (Gb3) were measured by LC/MS in plasma and extracts of liver, spleen, heart, and kidneys of mice engrafted with healthy donor (HDo)‐derived (A) or Fabry donor (FDo)‐derived (B) TRaMs, non‐transduced (NT) cells, or in sham‐treated NOD/SCID (NS) and NSF mice.
- C, D
Levels of lyso‐Gb3 were measured by LC/MS in plasma and extracts of tissues of mice engrafted with HDo‐derived (C) or FDo‐derived (D) TRaMs.

- A, B
Proportions of Gb3 ACVs as determined by LC/MS in the indicated tissues in mice transplanted with healthy donor‐derived (A) or Fabry donor‐derived (B) TRaMs compared to controls.
Similar articles
-
Extracellular vesicles from recombinant cell factories improve the activity and efficacy of enzymes defective in lysosomal storage disorders.J Extracell Vesicles. 2021 Mar;10(5):e12058. doi: 10.1002/jev2.12058. Epub 2021 Mar 12. J Extracell Vesicles. 2021. PMID: 33738082 Free PMC article.
-
[Gene therapy of Gaucher's and Fabry's diseases: current status and prospects].J Soc Biol. 2002;196(2):175-81. J Soc Biol. 2002. PMID: 12360746 Review. French.
-
New therapeutic options for lysosomal storage disorders: enzyme replacement, small molecules and gene therapy.Hum Genet. 2007 Mar;121(1):1-22. doi: 10.1007/s00439-006-0280-4. Epub 2006 Nov 7. Hum Genet. 2007. PMID: 17089160 Review.
-
Impaired autophagic and mitochondrial functions are partially restored by ERT in Gaucher and Fabry diseases.PLoS One. 2019 Jan 11;14(1):e0210617. doi: 10.1371/journal.pone.0210617. eCollection 2019. PLoS One. 2019. PMID: 30633777 Free PMC article.
-
Correction of enzymatic and lysosomal storage defects in Fabry mice by adenovirus-mediated gene transfer.Hum Gene Ther. 1999 Jul 1;10(10):1667-82. doi: 10.1089/10430349950017671. Hum Gene Ther. 1999. PMID: 10428212
Cited by
-
Engineering memory T cells as a platform for long-term enzyme replacement therapy in lysosomal storage disorders.Mol Ther. 2024 Nov 6;32(11):3865-3878. doi: 10.1016/j.ymthe.2024.09.033. Epub 2024 Oct 4. Mol Ther. 2024. PMID: 39367605 Free PMC article.
-
Cell and gene therapy for kidney disease.Nat Rev Nephrol. 2023 Jul;19(7):451-462. doi: 10.1038/s41581-023-00702-3. Epub 2023 Mar 27. Nat Rev Nephrol. 2023. PMID: 36973494 Free PMC article. Review.
-
Advances in genetic diagnosis and therapy of hereditary heart disease: a bibliometric review from 2004 to 2024.Front Med (Lausanne). 2025 Jan 8;11:1507313. doi: 10.3389/fmed.2024.1507313. eCollection 2024. Front Med (Lausanne). 2025. PMID: 39845823 Free PMC article. Review.
-
Lentivirus-mediated gene therapy for Fabry disease: 5-year End-of-Study results from the Canadian FACTs trial.Clin Transl Med. 2025 Jan;15(1):e70073. doi: 10.1002/ctm2.70073. Clin Transl Med. 2025. PMID: 39794302 Free PMC article.
-
Generation and characterization of an immunodeficient mouse model of mucopolysaccharidosis type II.Mol Genet Metab. 2023 Apr;138(4):107539. doi: 10.1016/j.ymgme.2023.107539. Epub 2023 Feb 10. Mol Genet Metab. 2023. PMID: 37023503 Free PMC article.
References
-
- Abutalib SA, Hari P (2017) Clinical manual of blood and bone marrow transplantation. Hoboken, NJ: John Wiley & Sons Inc.
-
- Ashley GA, Desnick RJ, Gordon RE, Gordon JW (2002) High overexpression of the human α‐galactosidase a gene driven by its promoter in transgenic mice: implications for the treatment of fabry disease. J Investig Med 50: 185–192 - PubMed
-
- Broomfield A, Jones SA, Hughes SM, Bigger BW (2016) The impact of the immune system on the safety and efficiency of enzyme replacement therapy in lysosomal storage disorders. J Inherit Metab Dis 39: 499–512 - PubMed
MeSH terms
Substances
LinkOut - more resources
Full Text Sources
Other Literature Sources
Research Materials
Miscellaneous
