

CD38-NADase is a new major contributor to Duchenne muscular dystrophic phenotype
- PMID: 35298089
- PMCID: PMC9081905
- DOI: 10.15252/emmm.202012860
CD38-NADase is a new major contributor to Duchenne muscular dystrophic phenotype
Abstract
Duchenne muscular dystrophy (DMD) is characterized by progressive muscle degeneration. Two important deleterious features are a Ca2+ dysregulation linked to Ca2+ influxes associated with ryanodine receptor hyperactivation, and a muscular nicotinamide adenine dinucleotide (NAD+ ) deficit. Here, we identified that deletion in mdx mice of CD38, a NAD+ glycohydrolase-producing modulators of Ca2+ signaling, led to a fully restored heart function and structure, with skeletal muscle performance improvements, associated with a reduction in inflammation and senescence markers. Muscle NAD+ levels were also fully restored, while the levels of the two main products of CD38, nicotinamide and ADP-ribose, were reduced, in heart, diaphragm, and limb. In cardiomyocytes from mdx/CD38-/- mice, the pathological spontaneous Ca2+ activity was reduced, as well as in myotubes from DMD patients treated with isatuximab (SARCLISA® ) a monoclonal anti-CD38 antibody. Finally, treatment of mdx and utrophin-dystrophin-deficient (mdx/utr-/- ) mice with CD38 inhibitors resulted in improved skeletal muscle performances. Thus, we demonstrate that CD38 actively contributes to DMD physiopathology. We propose that a selective anti-CD38 therapeutic intervention could be highly relevant to develop for DMD patients.
Keywords: CD38; DMD; NAD+; calcium; cardiomyopathy.
© 2022 The Authors. Published under the terms of the CC BY 4.0 license.
Figures
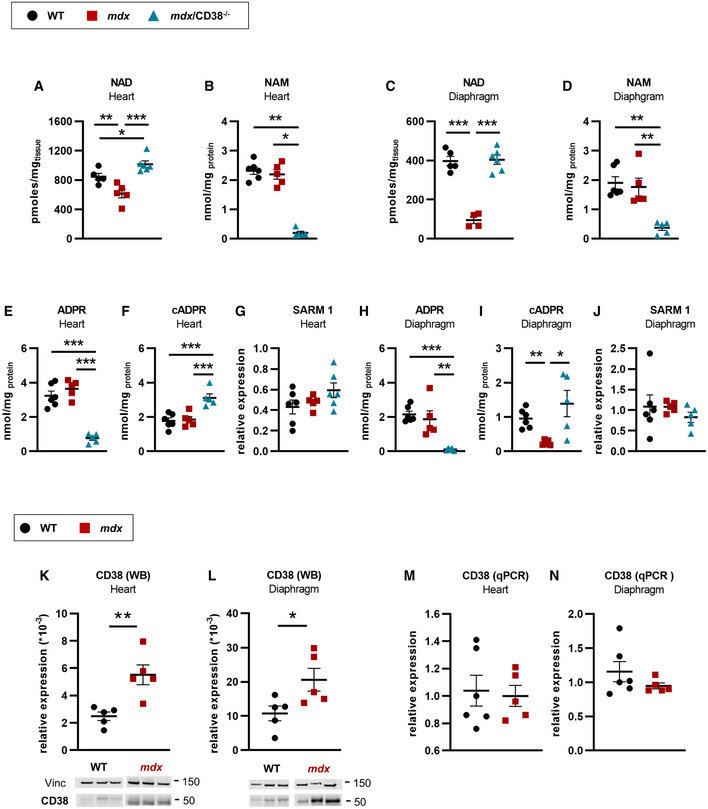
- A, B
NAD and nicotinamide (NAM) levels in the heart of WT (n = 5 and n = 6, respectively), mdx (n = 5 and n = 5, respectively), and mdx/CD38 −/− (n = 6 and n = 5, respectively) mice.
- C, D
NAD and NAM levels in diaphragm of WT (n = 5 and n = 6, respectively), mdx (n = 4 and n = 5, respectively), and mdx/CD38 −/− (n = 6 and n = 5, respectively) mice.
- E–G
Levels of ADP‐ribose (ADPR) (E), cyclic ADP‐ribose (cADPR) (F) expressed as nmol/mg protein, and (G) qPCR analysis of mRNA levels of sterile alpha and Toll/interleukin‐1 receptor motif‐containing 1 (SARM1) in the heart of WT (n = 6), mdx (n = 5) and mdx/CD38 −/− (n = 5, n = 5, and n = 6, respectively) mice.
- H–J
Levels of ADPR (H), cADPR (I) expressed as nmol/mg protein, and (J) qPCR analysis of mRNA levels of SARM1 in the diaphragm of WT (n = 6), mdx (n = 5) and mdx/CD38 −/− (n = 5) mice.
- K, L
Western blot analysis of CD38 protein expression in heart (K) and diaphragm (L) of WT (n = 5 and n = 6, respectively) and mdx (n = 5) mice. Vinculin is used as housekeeping protein control, and the dot plots show the ratio of CD38 to vinculin.
- M, N
qPCR analysis of CD38 mRNA levels in the heart (M) and diaphragm (N) of WT (n = 6) and mdx (n = 5) mice.
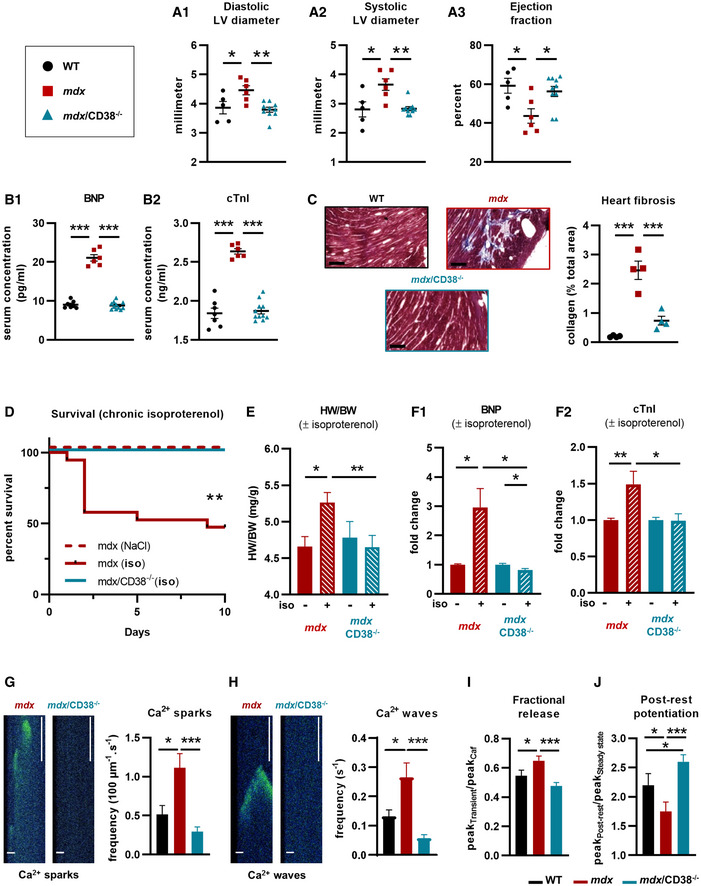
- A
Cardiac function evaluated by echocardiography in mdx/CD38 −/− mice: The dot plots show the left ventricular (LV) diastolic (A1) and systolic (A2) inner diameters and LV ejection (A3) fraction in 7‐month‐old WT (n = 5), mdx (n = 6), and mdx/CD38−/− (n = 10) mice.
- B
Plasma levels of cardiac stress biomarkers: brain natriuretic peptide (BNP) (B1) and cardiac troponin I (cTnI) (B2) in 7‐month‐old WT (n = 7), mdx (n = 6), and mdx/CD38 −/− (n = 11) mice.
- C
Cropped images revealed the collagen (blue) stained by Masson’s trichrome staining in the heart of WT, mdx, and mdx/CD38 −/− mice. Dot plot showing the quantification of heart collagen staining area (% total area) in 7‐month‐old WT, mdx, and mdx/CD38 −/− mice (n = 4 per group). Scale bars: 200 µm.
- D
Isoproterenol‐induced heart failure in 3‐month‐old mice. The Kaplan–Meier curve shows the survival rate of mdx mice (NaCl, n = 5), and mdx (n = 19) and mdx/CD38 −/− (n = 9) mice following isoproterenol (iso, subcutaneous injection) at 2.5 mg/kg/d for 10 days.
- E
Histogram showing isoproterenol‐induced heart hypertrophy in mdx NaCl (n = 5) mice, and surviving mdx (isoproterenol, n = 9), mdx/CD38 −/− NaCl (n = 9), and mdx/CD38 −/− (isoproterenol, n = 9) mice, expressed as heart weight/body weight ratio (HW/BW).
- F
Plasma levels of cardiac stress biomarkers: brain natriuretic peptide (BNP) (F1) and cardiac troponin I (cTnI) (F2) following isoproterenol treatment in mdx NaCl (n = 5), and surviving mdx (isoproterenol, n = 8), mdx/CD38 −/− NaCl (n = 5), and mdx/CD38 −/− (isoproterenol, n = 8) mice.
- G, H
Time‐lapse images recorded by confocal microscopy in “line‐scanning mode”, showing Ca2+ sparks and waves in cardiomyocytes at rest, extracted from mdx and mdx/CD38 −/− mice; scale bars: 10 µM (horizontal), 500 ms (vertical). Bar graphs showing the averaged Ca2+ spark (G) and wave (H) frequencies in cardiomyocytes isolated from WT (n = 21 cells), mdx (n = 28 cells), and mdx/CD38 −/− (n = 32 cells) mice.
- I
Bar graph showing the fractional release following caffeine application in cardiomyocytes from WT (n = 24 cells), mdx (n = 33 cells), and mdx/CD38 −/− (n = 32 cells) mice.
- J
Bar graph showing the post‐rest potentiation in cardiomyocytes from WT (n = 24 cells), mdx (n = 28 cells), and mdx/CD38 −/− (n = 32 cells) mice.
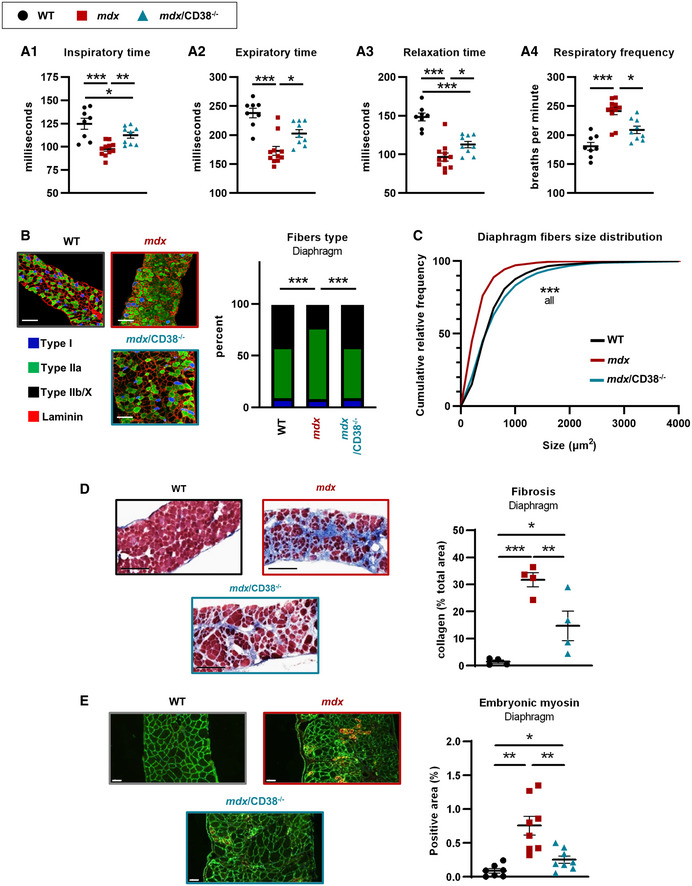
Measurement of the ventilatory mechanic by barometric plethysmography: dot plots showing inspiratory (A1) and expiratory times (A2), the relaxation time (A3), and the respiratory frequency (A4) in WT (n = 8), mdx (n = 11), and mdx/CD38 −/− (n = 9) mice.
Images showing muscle fiber typology revealed by immunostaining. Localization of the slow MyHC (Type I) fiber and fast MyHC (type IIa and IIb/X) fibers, along with laminin (red) on transverse cross sections from diaphragm of WT, mdx, and mdx/CD38 −/− mice. Scale bars: 100 µm. Histogram showing the percentage of I, IIa, and IIb/X fiber‐type distribution in diaphragm of WT (n = 7), mdx (n = 6), and mdx/CD38 −/− (n = 7) mice.
Fiber size distribution in the diaphragm of WT (n = 7), mdx (n = 6), and mdx/CD38 −/− (n = 7) mice.
Images revealing the collagen (blue) by Masson’s trichrome staining in the diaphragm of WT, mdx, and mdx/CD38 −/− mice. Quantification of collagen staining area (% total area) in the diaphragm of WT, mdx, and mdx/CD38 −/− mice (n = 4 per group). Scale bars: 200 µm.
Embryonic myosin expression: immunostaining showing its localization along with laminin (green) on transverse cross sections from diaphragm of WT, mdx, and mdx/CD38 −/− mice. Scale bars: 50 µm. Histogram showing the relative proportion of embryonic myosin area (% total area) in the diaphragm of WT (n = 7), mdx (n = 8), and mdx/CD38 −/− (n = 8) mice.
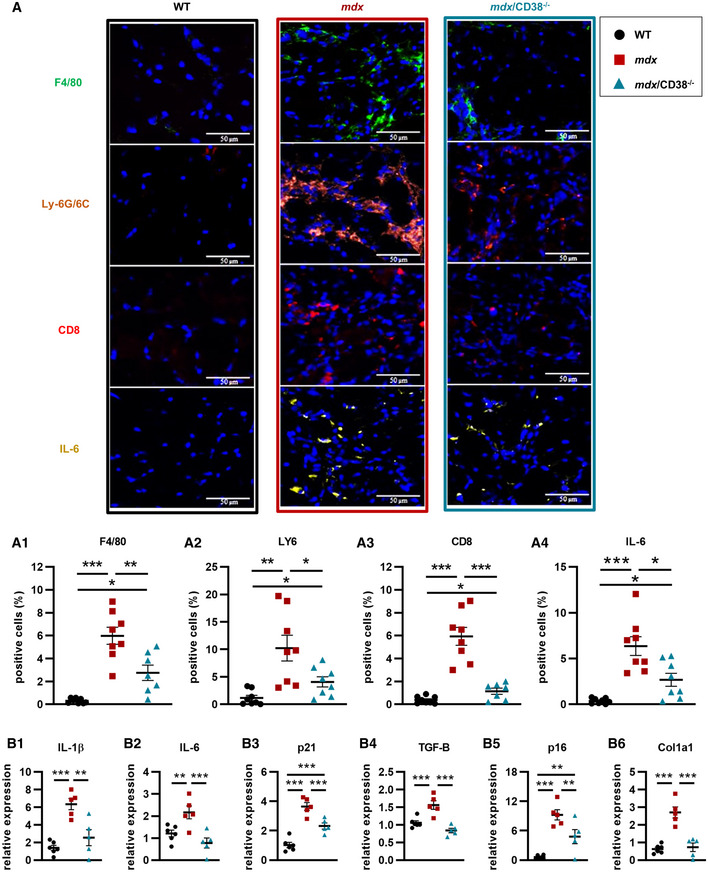
Images showing immunostaining of myeloid cells showing F4/80 (macrophage marker), Ly‐6G/6C (monocyte, granulocyte, and neutrophil marker), CD8 (cytotoxic T‐lymphocyte marker), and IL‐6‐positive cells in the diaphragm of 7‐month‐old WT (n = 8), mdx (n = 8), and mdx/CD38 −/− (n = 7 or 8) mice. Lower panel: histograms quantifying the percentage of F4/80 (A1) mdx/CD38 −/− (n = 7), LY6 (A2) mdx/CD38 −/− (n = 8), CD8 (A3) mdx/CD38 −/− (n = 7), and IL‐6 (A4) mdx/CD38 −/− (n = 8)‐positive cells. Scale bars: 50 µm.
qPCR analysis of mRNA levels of interleukin‐1β (IL‐1ß) (B1) and interleukin‐6 (IL‐6) (B2), cyclin‐dependent kinase inhibitor 1 (p21) (B3), transforming growth factor‐β (TGF‐β) (B4), senescence markers (cell‐cycle inhibitor p16, INK4a) (B5), and collagen type I alpha 1 chain (Col1a1) (B6) in diaphragm of 20‐month‐old WT (n = 6), mdx (n = 5), and mdx/CD38 −/− (n = 5) mice.
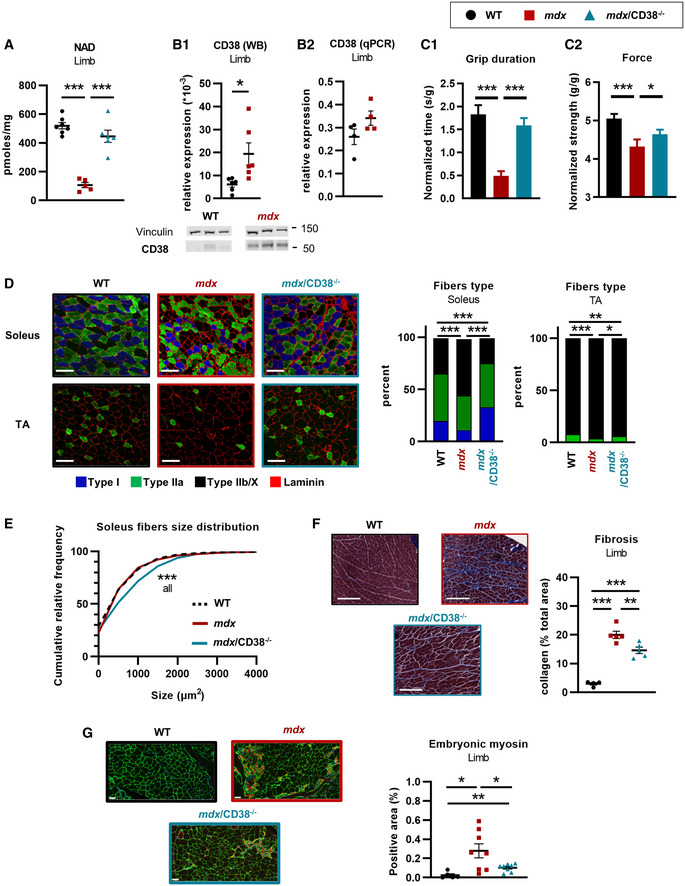
NAD+ levels in limb muscles of 20‐month‐old WT (n = 7), mdx (n = 5), and mdx/CD38 −/− (n = 6) mice.
CD38 expression: Western blot analysis of CD38 (B1) protein in limb of WT and mdx mice (n = 6 per group). Vinculin is used as housekeeping protein control, and the dot plots show the ratio of CD38 to vinculin. qPCR analysis of CD38 mRNA (B2) in limb of 20‐month‐old WT and mdx mice (n = 4 per group).
Histograms showing the grip duration (latency to fall) (C1) and the limb force (C2) measured by a grip test in WT (n = 89), mdx (n = 52 and 53, respectively), and mdx/CD38 −/− (n = 58) mice (age: 9–26 months).
Images showing muscle fiber typology revealed by immunostaining. Localization of the slow MyHC (type I) fiber and fast MyHCs (type IIa and IIb/X) fibers, along with laminin (red) on transverse cross sections from soleus and tibialis (TA) of WT, mdx, and mdx/CD38 −/− mice. Scale bars: 100 µm. Histogram showing the percentage of I, IIa and IIb/X fiber‐type distribution in soleus and TA of WT, mdx, and mdx/CD38 −/− mice. Experiments were performed in WT (n = 3), mdx (n = 5), and mdx/CD38 −/− (n = 7) mice for soleus; and WT (n = 5), mdx (n = 6), and mdx/CD38 −/− (n = 6) mice for TA.
Fiber size distribution in soleus from WT, mdx, and mdx/CD38 −/− mice.
Images displaying the collagen (blue) revealed by Masson’s trichrome staining in the limb of WT, mdx, and mdx/CD38 −/− mice. The dot plot shows the quantification of collagen staining area (% total area) in the limb of WT (n = 4), mdx (n = 5), and mdx/CD38 −/− (n = 5) mice. Scale bars: 200 µm.
Embryonic myosin expression revealed by immunostaining along with laminin (green) on transverse cross sections from the limb of WT (n = 5), mdx (n = 8), and mdx/CD38 −/− (n = 8) mice. Scale bars: 50 µm. Dot plot showing the relative proportion of embryonic myosin area in the limb of WT, mdx, and mdx/CD38 −/− mice.
- A
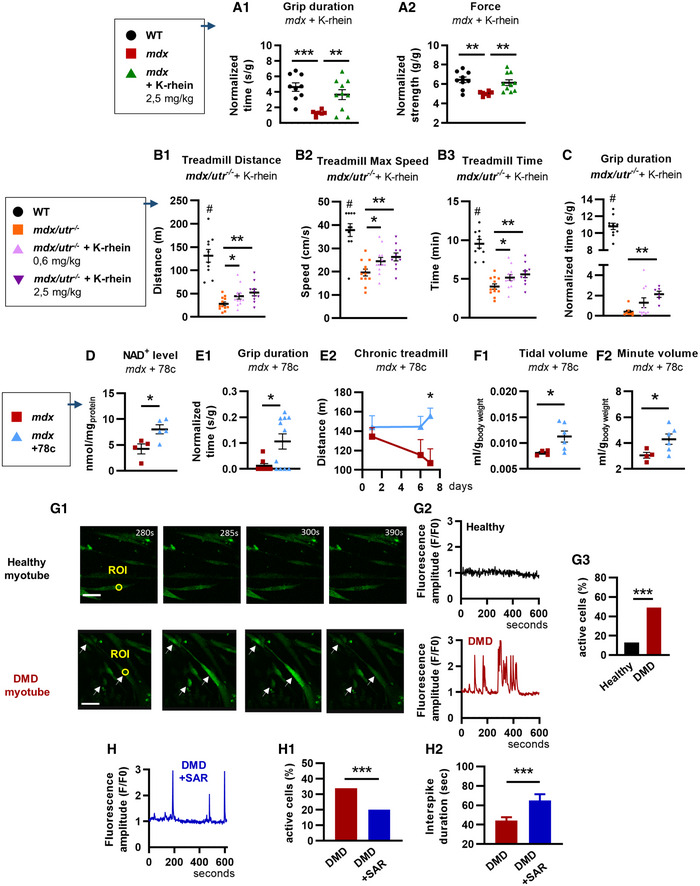
Young mdx mice and treatment with a CD38 inhibitor. 6‐week‐old mdx mice were treated for 5 weeks with K‐rhein at 2.5 mg/kg/d by intraperitoneal injection. Dot plots showing measurement of the grip duration (A1) and the force (A2) of WT (n = 9), mdx (n = 7), and K‐rhein‐treated mdx (n = 10) mice.
- B, C
Newborn double‐knockout utrophin–dystrophin (mdx/utr −/−) mice and treatment with an CD38 inhibitor. Mdx/utr −/− mice were subcutaneously injected with K‐rhein (0.6 and 2.5 mg/kg/d) for 4 weeks. B: Dot plots showing the treadmill performances of K‐rhein‐treated mdx/utr −/− mice: distance traveled (B1), maximum speed reached (B2), and maximum running time (B3) (WT (NaCl) and mdx/utr −/− + K‐rhein 2.5 mg/kg/d, n = 10 mice per group; mdx/utr −/−(NaCl) and mdx/utr −/− + K‐rhein 0.6 mg/kg/d, n = 12 mice per group). C: Measurement of the grip duration (grid test) in WT (n = 10), mdx/utr −/− (n = 8), and K‐rhein‐treated mdx/utr −/− mice (n = 10 and 6 mice, respectively, for the 0.6 mg/kg/d and 2.5 mg/kg/d doses).
- D–F
Adult mdx mice and long‐term treatment with an CD38 inhibitor. Mdx mice were evaluated after 6 months of intraperitoneal injection with the CD38 inhibitor 78c (10 mg/kg/d). D: Histogram showing NAD+ levels in the limb of mdx (n = 4) and 78c‐treated mdx (n = 5) mice. E: Histogram showing grip duration (E1) (n = 8 mdx and n = 11) in the inverted grid test and performances in chronic treadmill test (E2) at days 1, 6, and 7 after treatment of mdx (n = 5 except for D7, n = 4) and 78c‐treated mdx (n = 7) mice. F: Dot plots showing barometric plethysmography measures of the tidal (F1) and minute (F2) volumes of mdx (n = 4) and 78c‐treated mdx (n = 6) mice.
- G
Time‐lapse confocal imaging of calcium dynamics in human healthy and DMD myotubes loaded with the Ca2+‐sensitive dye Fluo‐4 (white arrows show the active cells) (G1). Traces illustrating recordings from region of interest (ROI) in an inactive healthy myotube (black line) and in a DMD myotube displaying Ca2+ spiking activity (red line) (G2). Histogram showing the percentage of myotubes displaying spontaneous Ca2+ waves (G3): healthy myotubes (n = 91 cells) and DMD myotubes (n = 186 cells). Scale bars: 200 µm.
- H
Human DMD myotubes treated by SAR650984 (SAR, isatuximab), a humanized anti‐CD38 antibody. Fluorescence trace illustrating a recording of DMD myotubes treated with 10 µg/ml of SAR (blue). Histogram showing the percentage of spontaneous Ca2+ waves in DMD myotubes untreated (n = 740 cells) or treated with 10 µg/ml of SAR (n = 279 cells) (H1). Histogram showing the Ca2+ wave interspike duration (interval between spikes) in myotubes treated with 10 µg/ml of SAR (n = 43 cells vs 91 for the untreated DMD myotubes) (H2).
References
-
- Aksoy P, White TA, Thompson M, Chini EN (2006) Regulation of intracellular levels of NAD: a novel role for CD38. Biochem Biophys Res Commun 345: 1386–1392 - PubMed
MeSH terms
Substances
Grants and funding
LinkOut - more resources
Full Text Sources
Molecular Biology Databases
Research Materials
Miscellaneous
