. 2022 Mar 18;375(6586):1247-1254.
doi: 10.1126/science.abj5117. Epub 2022 Mar 17.

Multiple causal variants underlie genetic associations in humans

Affiliations

Multiple causal variants underlie genetic associations in humans

Nathan S Abell et al. Science. .

Abstract

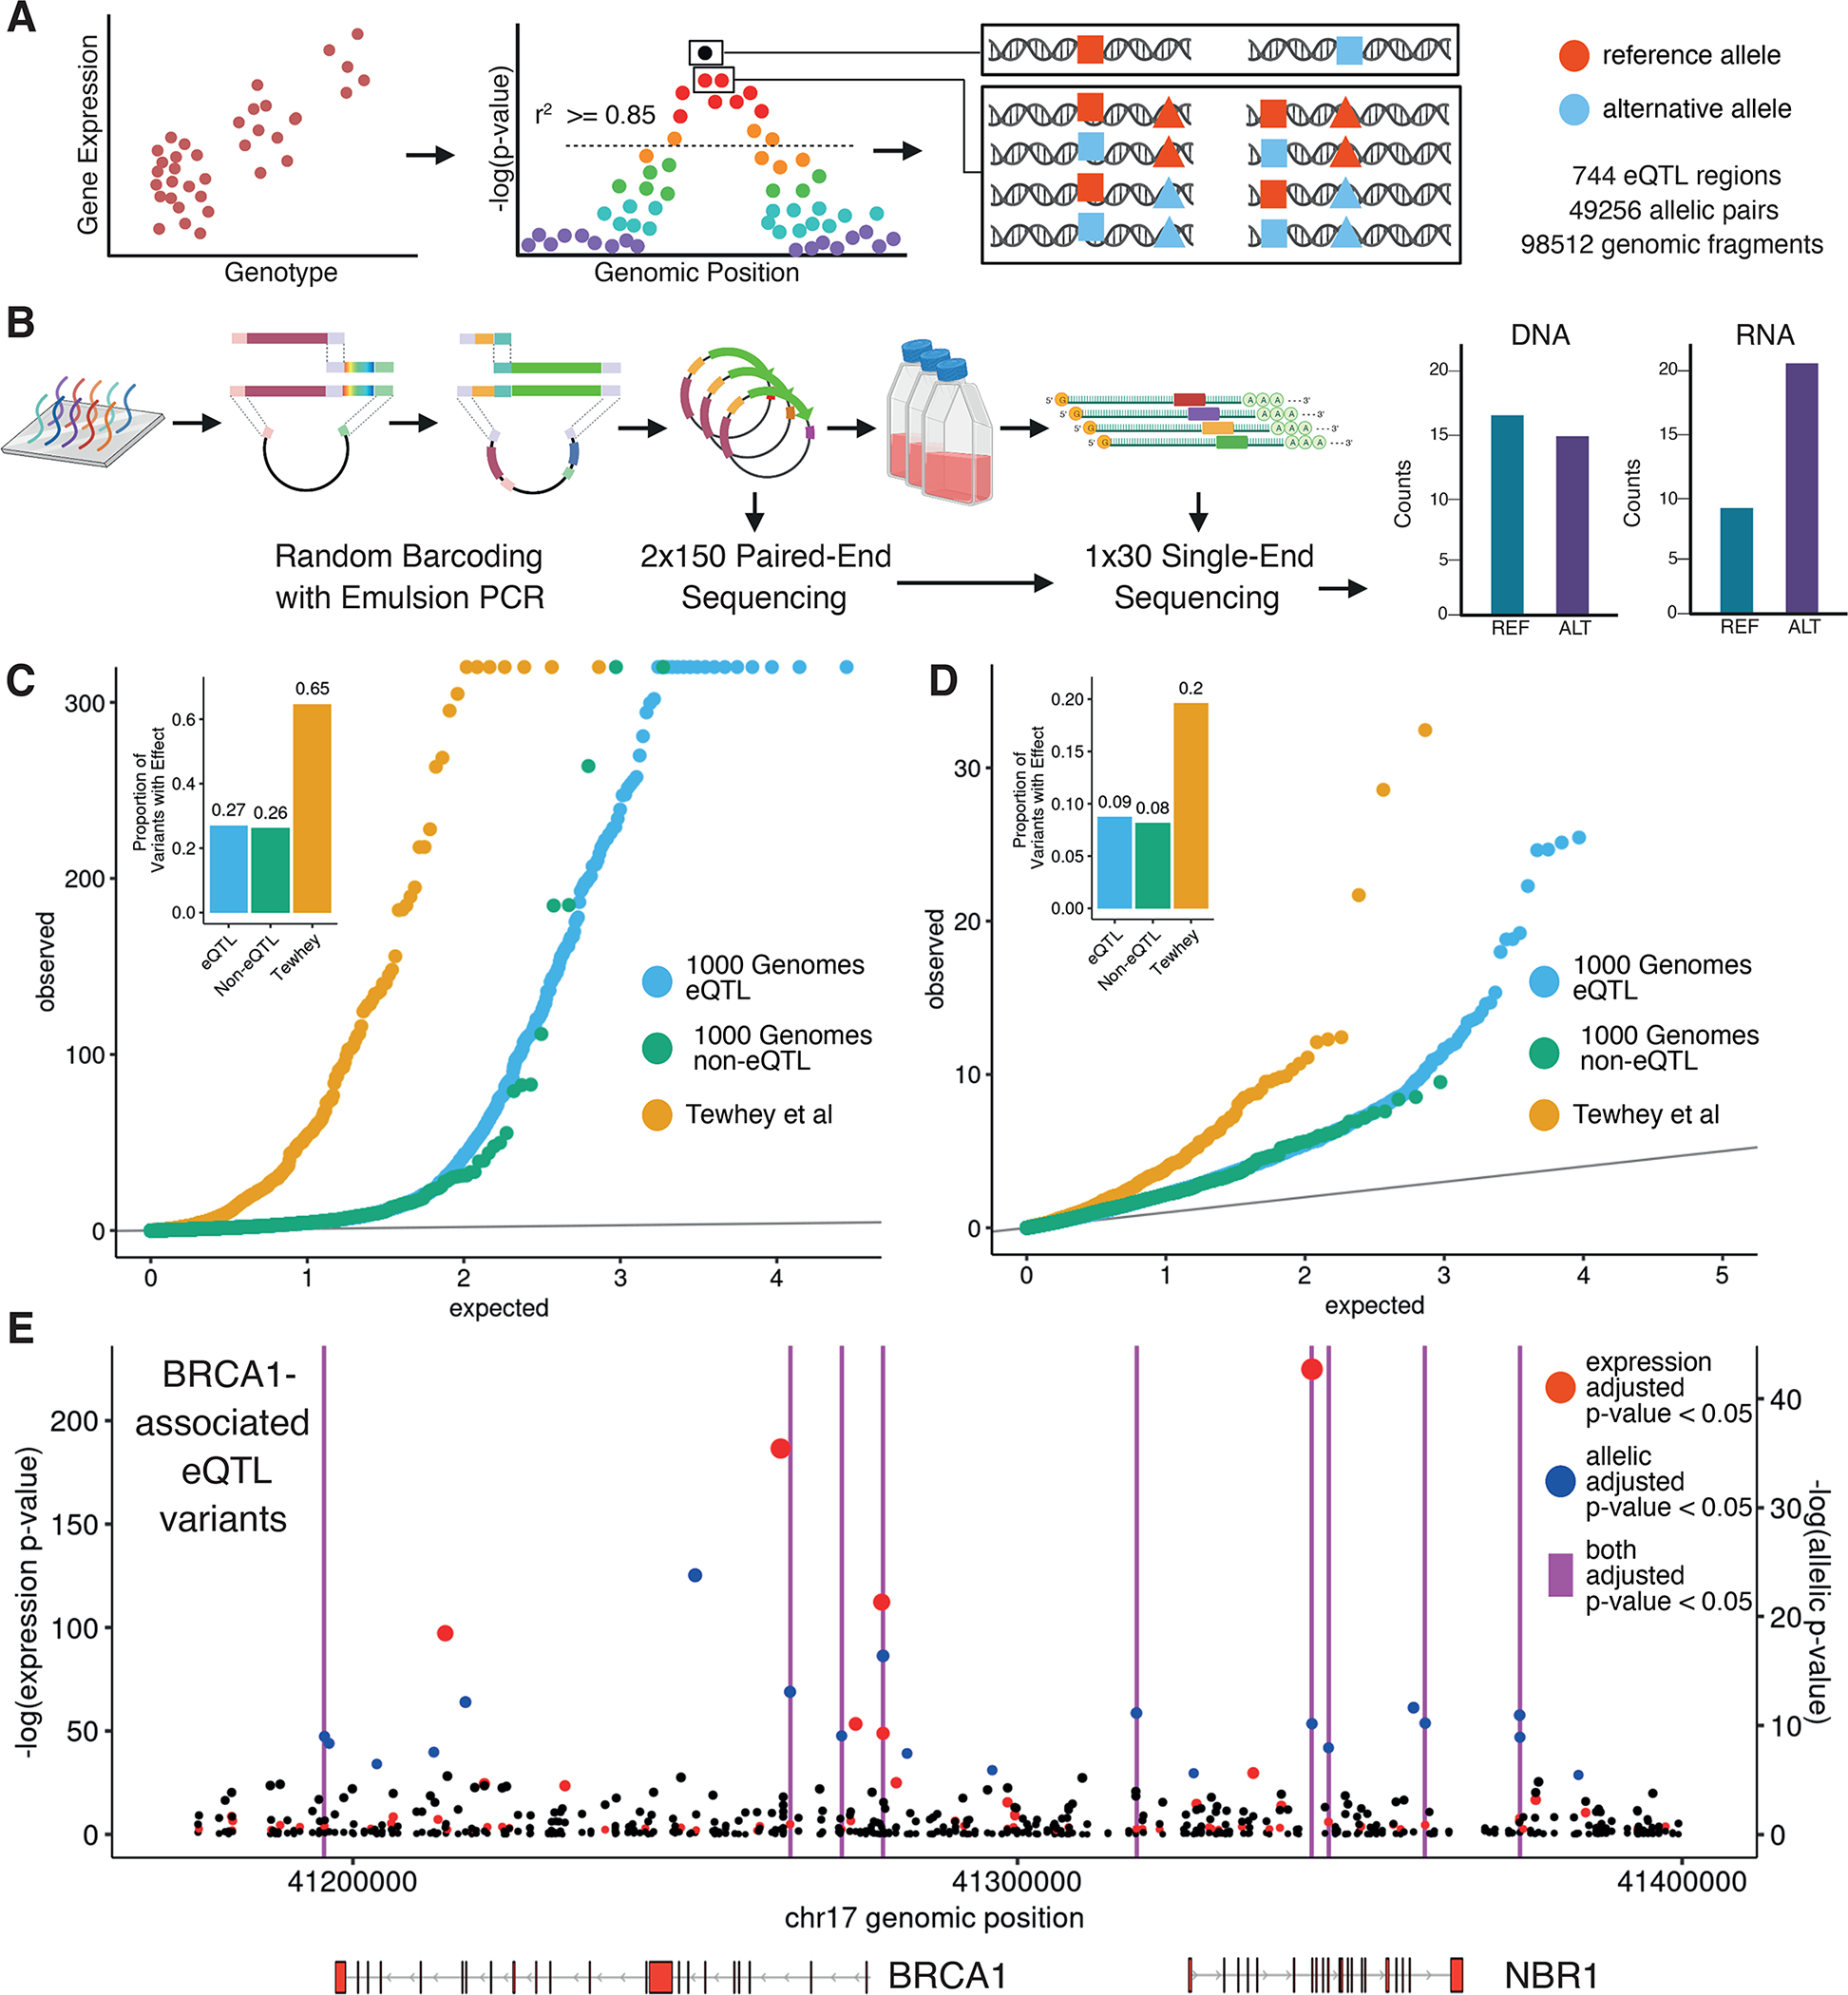
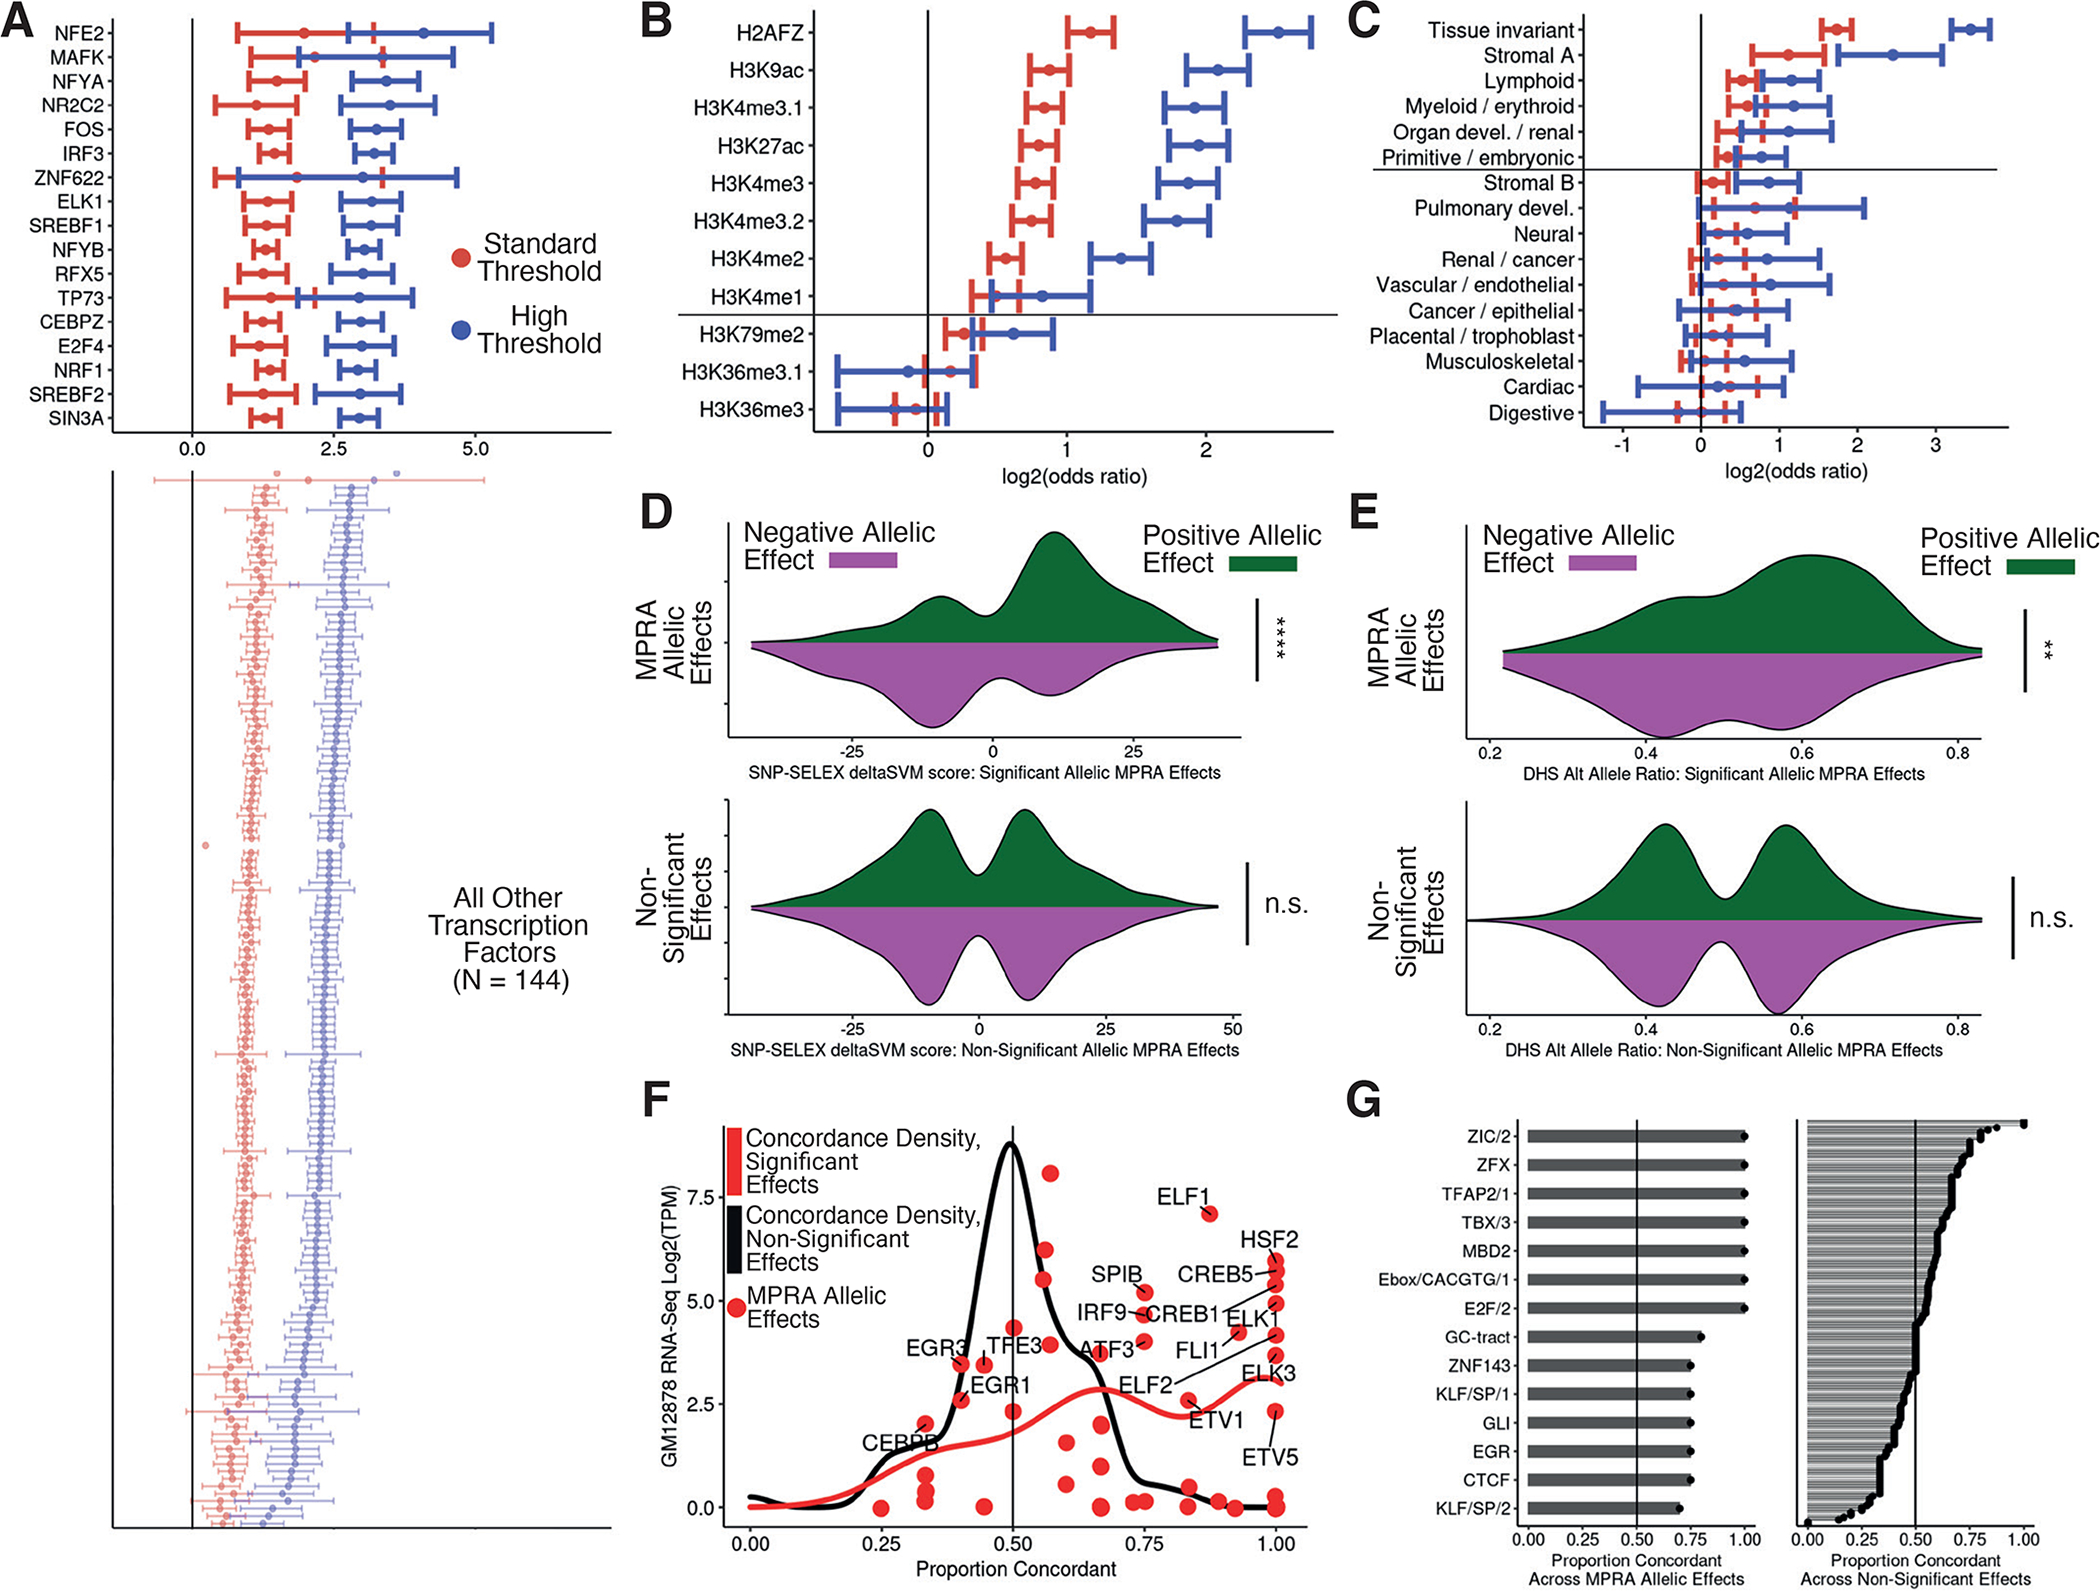
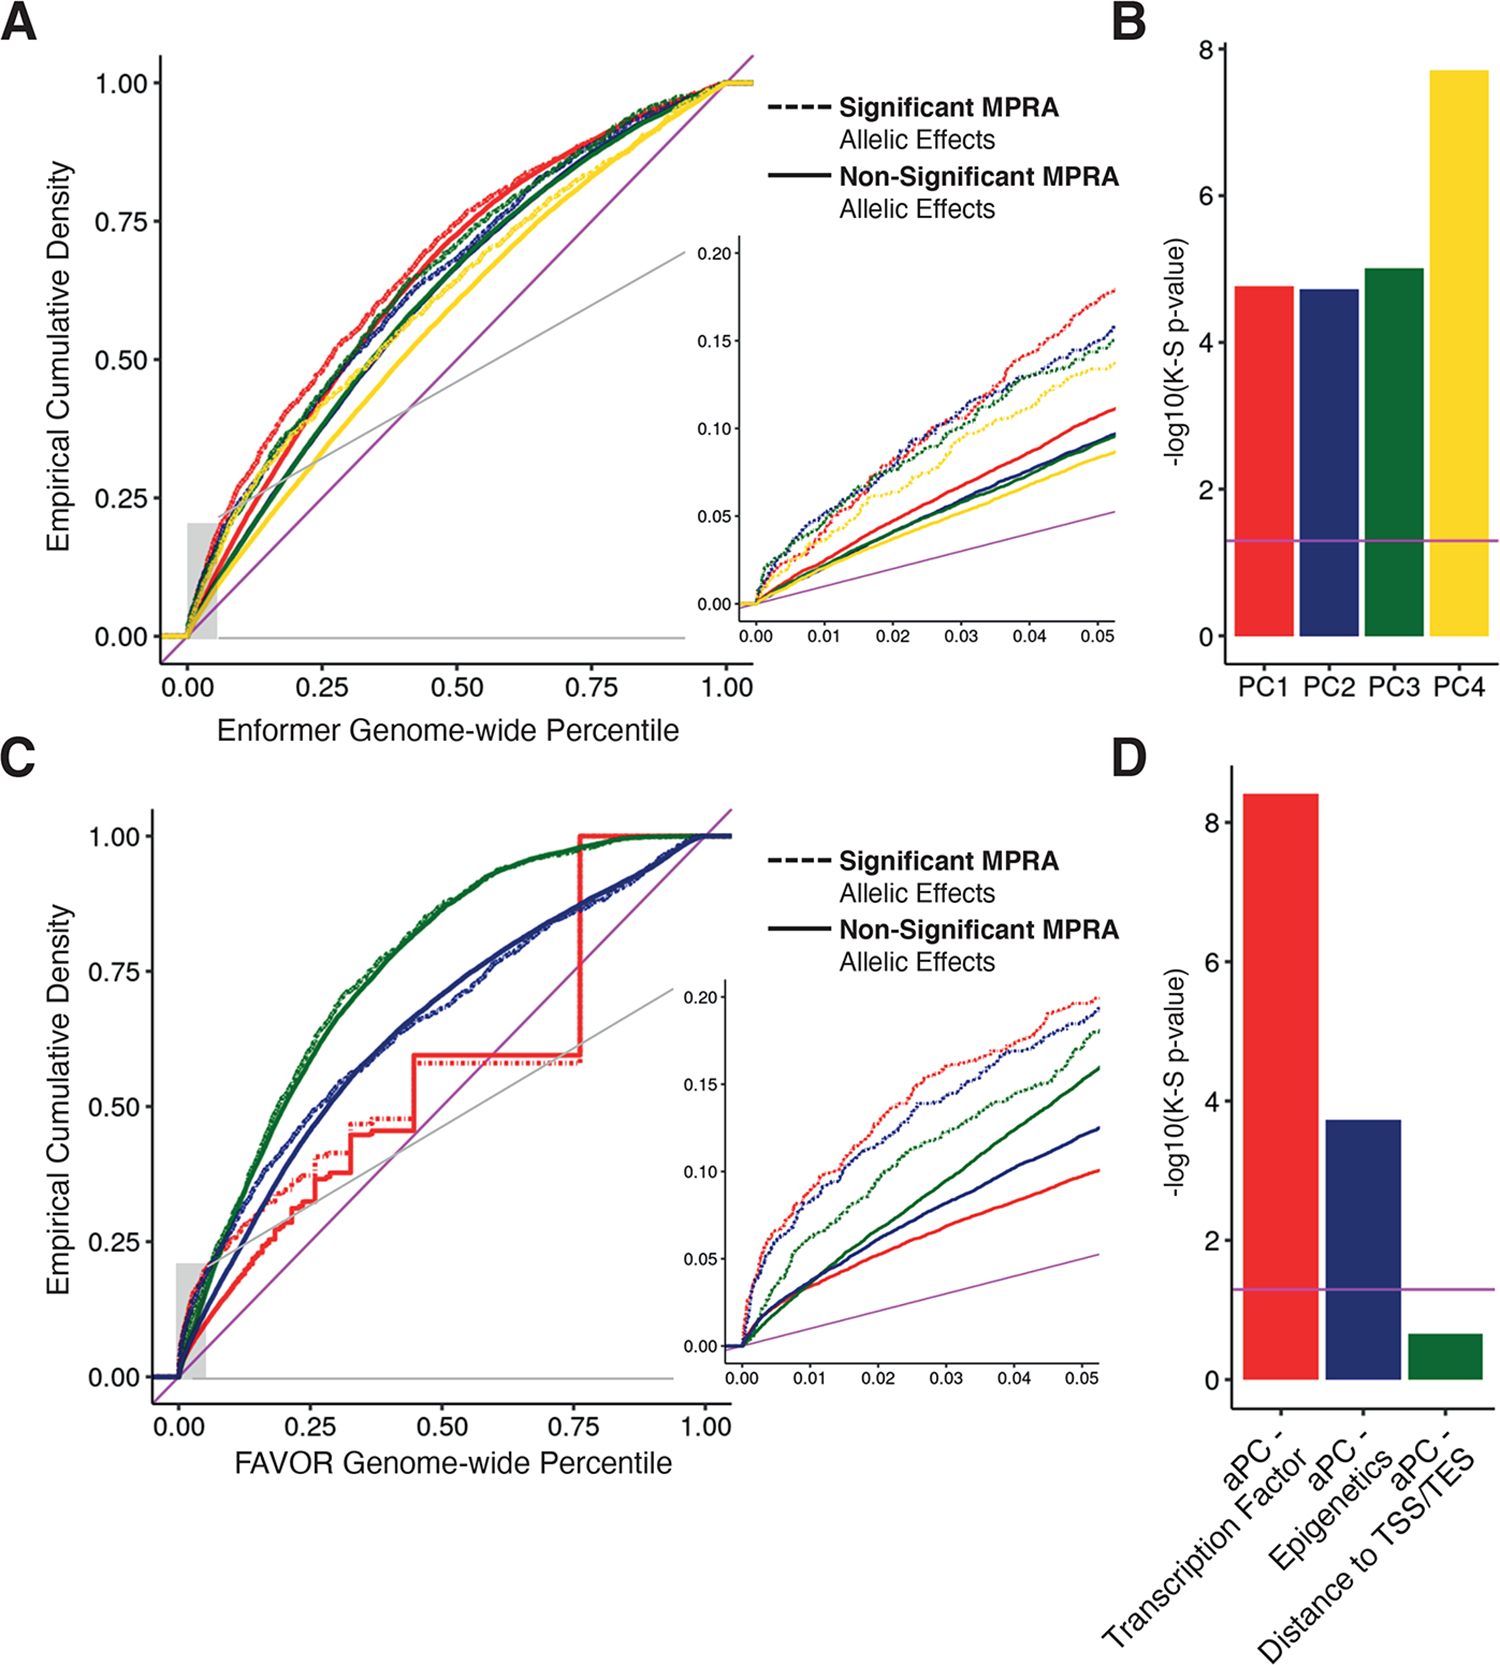
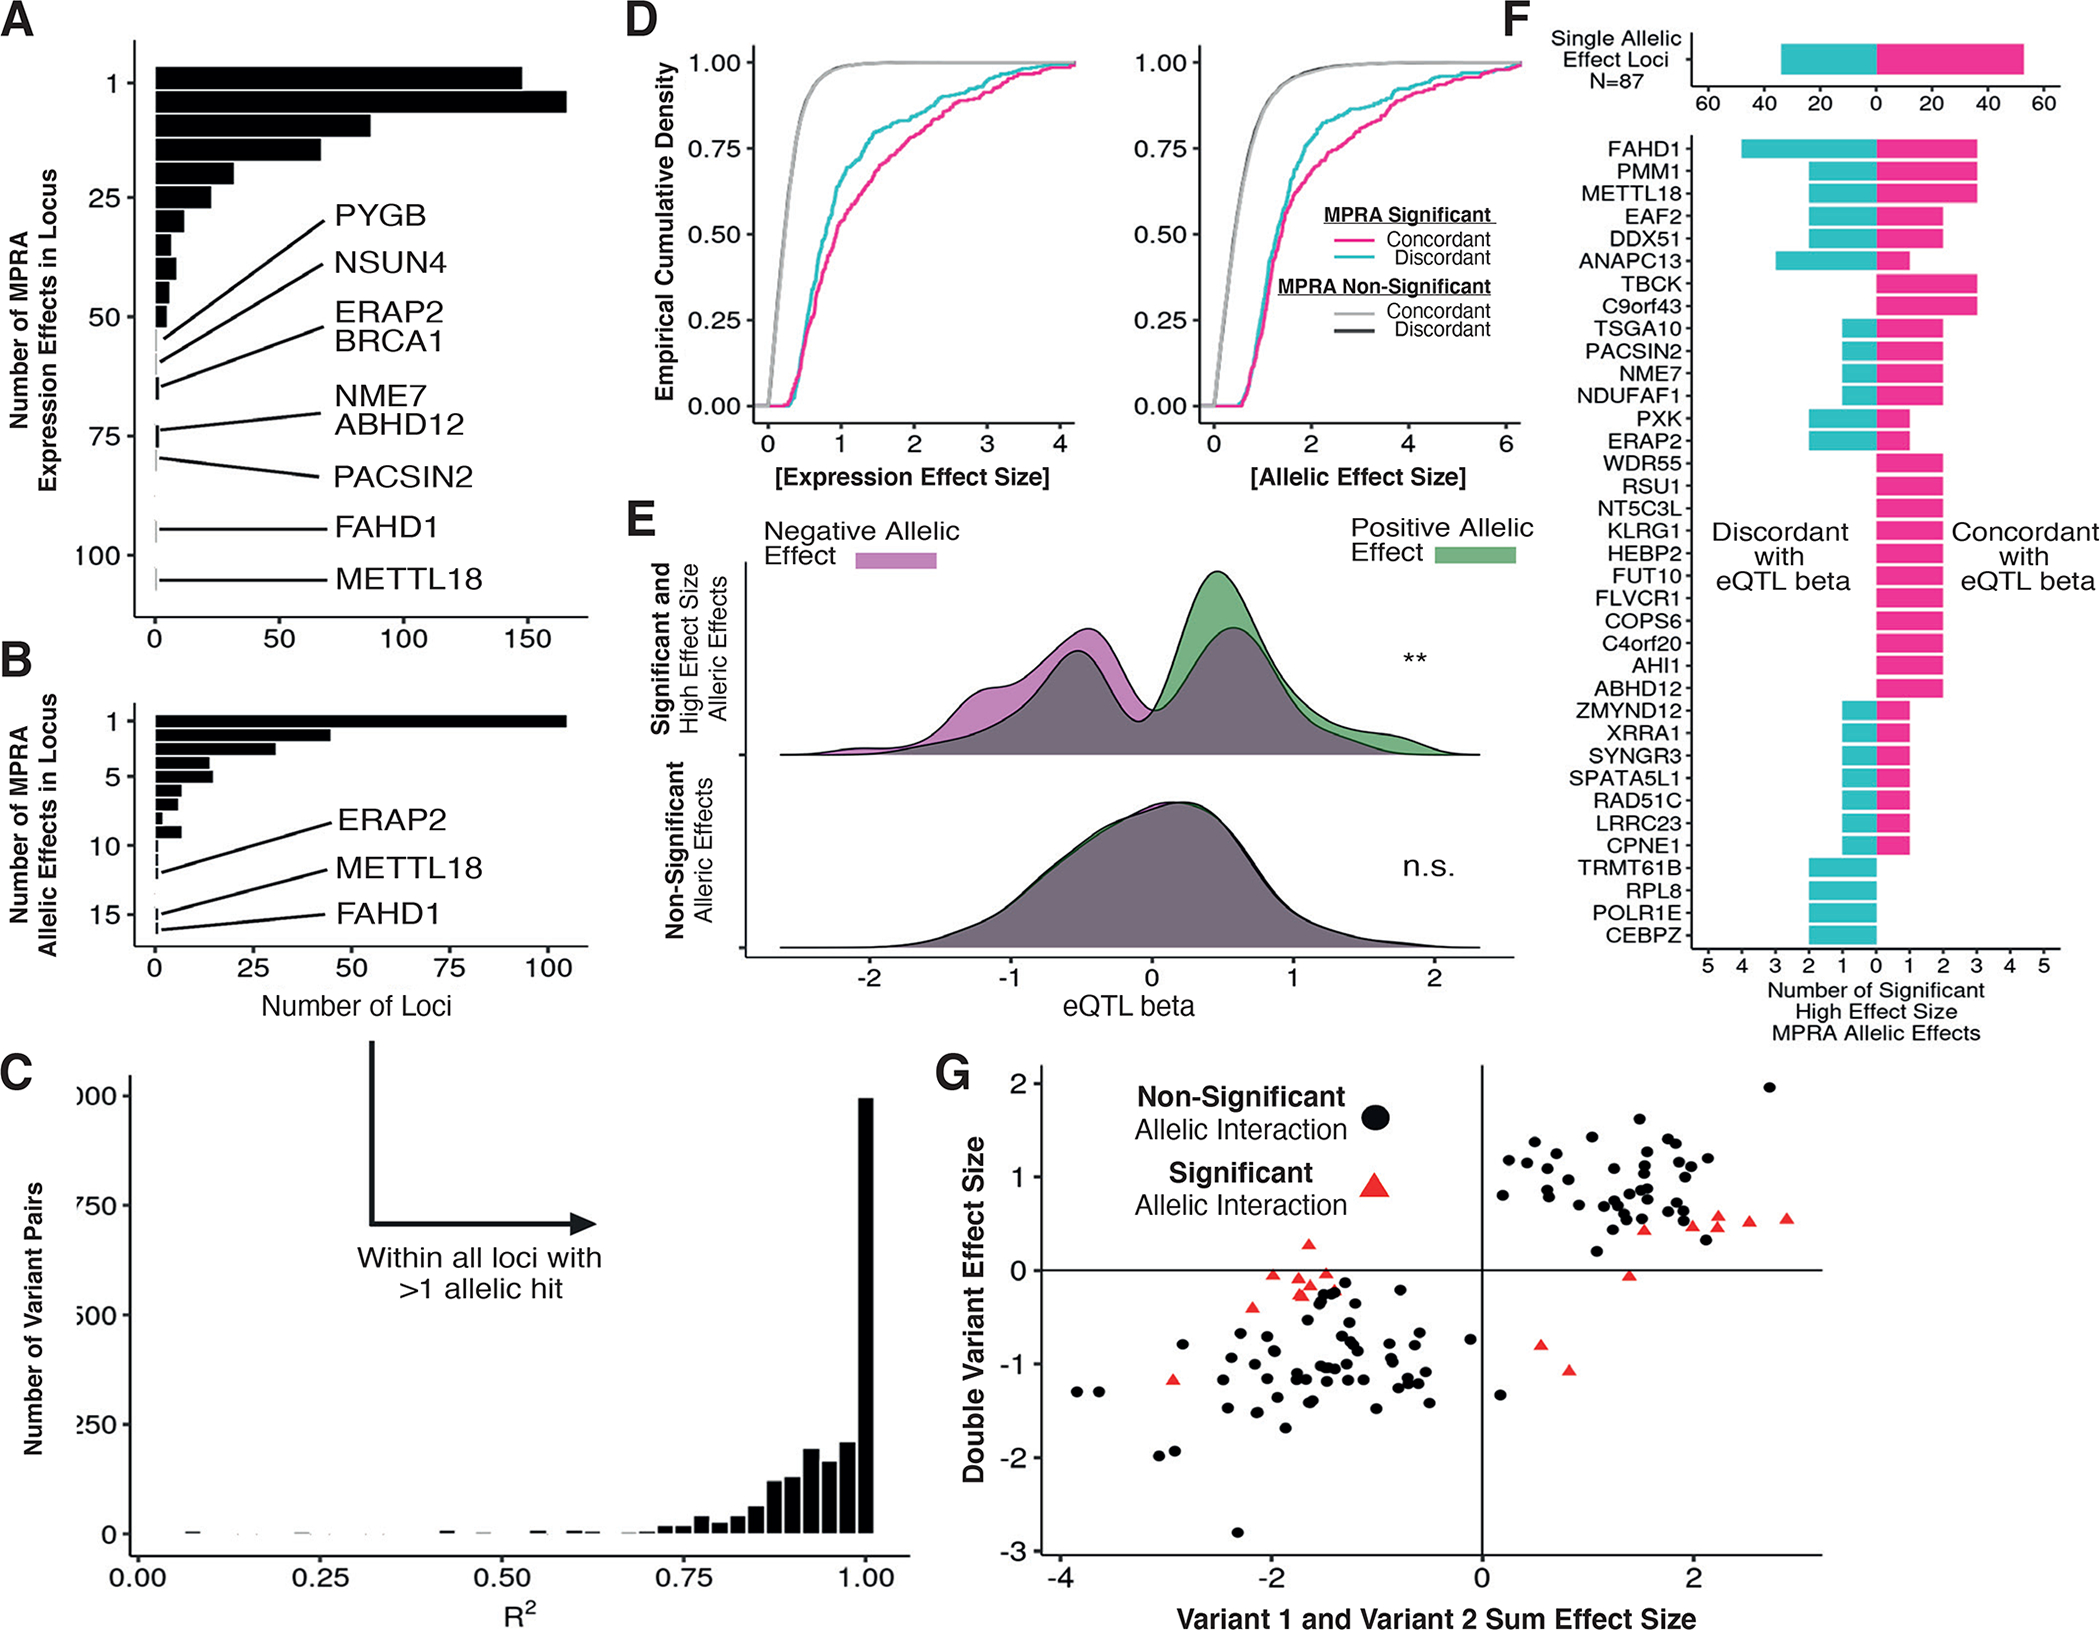
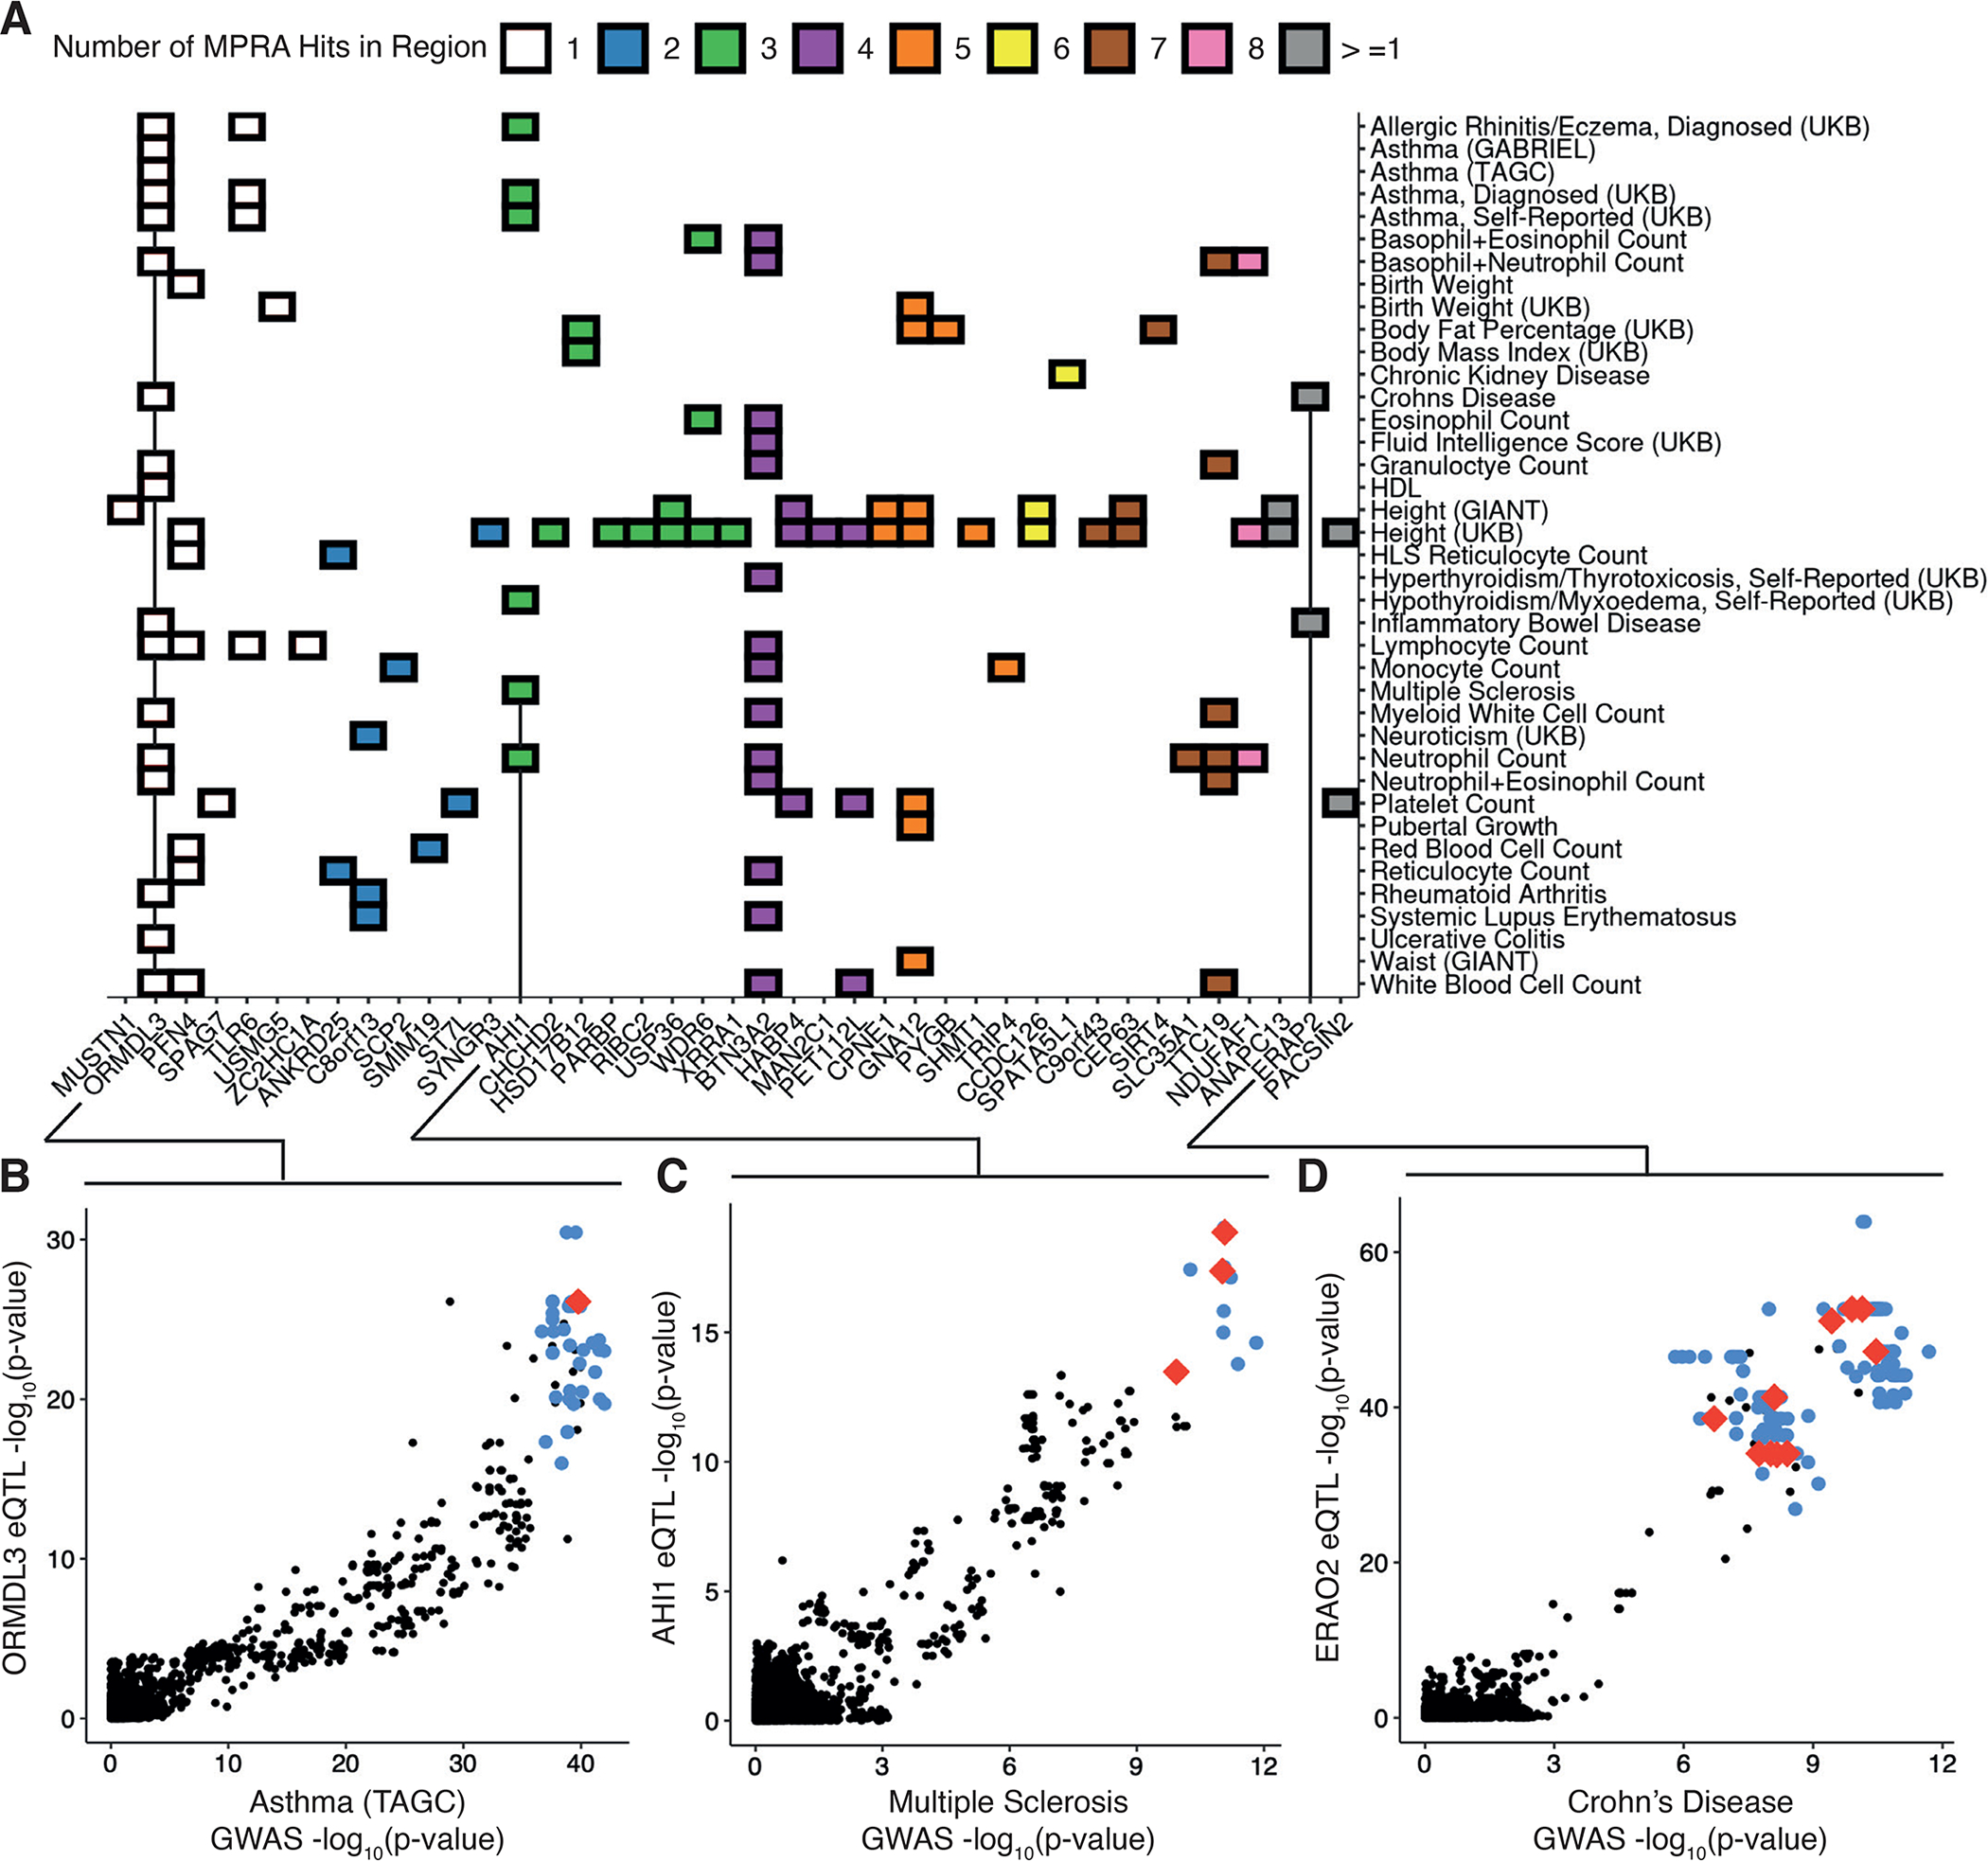
Associations between genetic variation and traits are often in noncoding regions with strong linkage disequilibrium (LD), where a single causal variant is assumed to underlie the association. We applied a massively parallel reporter assay (MPRA) to functionally evaluate genetic variants in high, local LD for independent cis-expression quantitative trait loci (eQTL). We found that 17.7% of eQTLs exhibit more than one major allelic effect in tight LD. The detected regulatory variants were highly and specifically enriched for activating chromatin structures and allelic transcription factor binding. Integration of MPRA profiles with eQTL/complex trait colocalizations across 114 human traits and diseases identified causal variant sets demonstrating how genetic association signals can manifest through multiple, tightly linked causal variants.


Conflict of interest statement

Competing Interests: SBM has consulting agreements with MyOme, Biomarin and Tenaya Therapeutics. All other authors report no competing interests.

Figures

Figure 1 -
Figure 1 -. Design and implementation of a variant-based massively parallel reporter assay
(A) Variant selection and oligonucleotide sequence design. (B) Random barcoding, sequencing and expression of the MPRA library. (C) Distribution of eQTLs (orange) and non-eQTLs (blue) from the 1000 Genomes Project compared to Tewhey et al. (green) (8) variant expression p-values (negative binomial regression) and relative effect proportions. Inset shows proportion of tested variants that are significant MPRA hits. (D) Same as in (C) but with allelic p-values (negative binomial regression) (E) Genomic position and unadjusted p-values for all tested BRCA1-associated variants with colors indicating Benjamini-Hochberg (BH) adjusted p-value <= 0.05. Vertical magenta lines indicate positions of variants that are both expression and allelic MPRA hits.
Figure 2 -
Figure 2 -. General and allele-specific functional properties of regulatory variants
(A) Odds ratios and 95% confidence intervals for enrichment of peaks from 160 ENCODE ChIP-seq datasets within expression MPRA hitss. Standard and high thresholds required an expression BH-adjusted p-value of < 5e-2 or < 5e-10, respectively. Only TFtranscription factors with an enrichment adjusted p-value < 0.005 are shown, and listed TFtranscription factors have BH-adjusted enrichment p-value < 0.05 and odds ratio > 5 (Fisher’s exact test). (B) Same as in (A) but for histone modifications. Marks above the horizontal line have a BH-adjusted p-value < 0.05 at both thresholds. (C) Same as in (A) but for clustered chromatin accessibility regions in fragments with expression effects. (D) Distribution of SNP-SELEX deltaSVM scores at allele-specific binding variants stratified by MPRA allelic hit direction (color) and significance category (top and bottom); MPRA allelic hits have BH-adjusted expression and allelic p-values <= 0.05 while non-significant variants have p-values > 0.75 (negative binomial regression). (E) Same as in (D) but for allelic imbalance in chromatin accessibility from ENCODE. (F) For all TFs evaluated in (D), comparison of the concordance proportion across MPRA variants with the expression of each included TF in GM12878 cells; points indicate significant effect concordances. (G) Comparison of directional concordances within accessible chromatin motifs for significant (left) and non-significant (right) MPRA effects. Significance values for C and D were calculated with Fisher’s exact test and p-values are denoted as follows: * <0.05, **<0.005, ***<0.0005, ****<5e-5.
Figure 3 -
Figure 3 -. Integrative non-coding variant effect prediction
(A) Empirical cumulative probability distribution of the first through fourth principal component (PC) scores from Enformer for allelic MPRA hits and other tested variants significant and non-significant MPRA allelic hits; genome-wide percentiles computed across all common variants in 1000 Genomes Phase 3. Inset shows a blow up of lower genome-wide percentile curves (B) Significance of a Kolgomorov-Smirnov (K-S) test comparing the empirical distributions of Enformer scores for significant and non-significant allelic MPRA hits v; magenta horizontal line indicates significance by K-S test (p-value < 0.05). (C) Same as in (A) except showing annotation principle components from FAVOR; genome-wide percentiles computed across all variants in TOPMed Freeze5. (D) Same as in B, except testing FAVOR aPCs.
Figure 4 -
Figure 4 -. Decomposition of allelic heterogeneity within regulatory loci
(A) Histograms of the number of expression MPRA hits per locus with BH-adjusted p-value <= 0.05 (negative binomial regression). (B) Same as in (A) but requiring BH-adjusted p-value <= 0.05 for allelic MPRA hits. (C) Distribution of linkage disequilibrium R2 values between all pairs of allelic MPRA hits within genes with multiple hits. (D) Cumulative distribution of effect sizes stratified by concordance; concordance is defined as the sign of the allelic effect size matching the sign of eQTL beta. (E) Distribution of eQTL betas measured in GTEx v8 LCLs for strong MPRA hits (log expression effect size >= 1.4), stratified by MPRA allelic effect direction and significance from negative binomial regression. (F) Using the same variants as (E), counts of directionally concordant and discordant allelic MPRA hits across all loci. (G) Comparison of haplotype regression coefficients for variants tested individually or jointly; red points indicate allelic interaction BH-adjusted p-value <= 0.05 (negative binomial regression). The x-axis displays the sum of effect sizes associated with oligos containing each variant individually, and the y-axis displays the effect size associated with the oligo containing both variants.
Figure 5 -
Figure 5 -. Resolving complex trait associations with multiple causal variants
(A) Heatmap of significant colocalizations between eQTL loci and selected GWAS; color indicates the number of allelic MPRA hits within the colocalized regions. (B) Comparison of genetic associations for Asthma and ORMDL3 expression in GTEx v8 LCLs; red and blue points indicate allelic MPRA hits and other tested variants significant and non-significant allelic MPRA hits, respectively, black points indicate untested variants not included in our library. (C) Same as in (B) for associations with Multiple Sclerosis and AHI1 expression. (D) Same as in (B) and (C) for associations with Crohn’s Disease and ERAP2 expression which was also colocalized with Inflammatory Bowel Disease (fig. S5A). All GWAS and eQTL colocalizations are retrieved from (22), and lead variants were required to be genome-wide significant (reported GWAS p-value <= 5e-8 and reported eQTL p-value <= 5e-5) even if colocalization probability was high.

Comment in

References

    1. Buniello A, MacArthur JAL, Cerezo M, Harris LW, Hayhurst J, Malangone C, McMahon A, Morales J, Mountjoy E, Sollis E, Suveges D, Vrousgou O, Whetzel PL, Amode R, Guillen JA, Riat HS, Trevanion SJ, Hall P, Junkins H, Flicek P, Burdett T, Hindorff LA, Cunningham F, Parkinson H, The NHGRI-EBI GWAS Catalog of published genome-wide association studies, targeted arrays and summary statistics 2019. Nucleic Acids Res. 47, D1005–D1012 (2019). - PMC - PubMed
    1. Tam V, Patel N, Turcotte M, Bossé Y, Paré G, Meyre D, Benefits and limitations of genome-wide association studies. Nat. Rev. Genet. 20, 467–484 (2019). - PubMed
    1. Schaid DJ, Chen W, Larson NB, From genome-wide associations to candidate causal variants by statistical fine-mapping. Nat. Rev. Genet. 19, 491–504 (2018). - PMC - PubMed
    1. Melnikov A, Zhang X, Rogov P, Wang L, Mikkelsen TS, Massively parallel reporter assays in cultured mammalian cells. J. Vis. Exp. (2014), doi:10.3791/51719. - DOI - PMC - PubMed
    1. Ernst J, Melnikov A, Zhang X, Wang L, Rogov P, Mikkelsen TS, Kellis M, Genome-scale high-resolution mapping of activating and repressive nucleotides in regulatory regions. Nat. Biotechnol. 34, 1180–1190 (2016). - PMC - PubMed

Publication types

MeSH terms