. 2022 May 16;132(10):e155693.
doi: 10.1172/JCI155693.

microRNA-92a promotes CNS autoimmunity by modulating the regulatory and inflammatory T cell balance

Affiliations

microRNA-92a promotes CNS autoimmunity by modulating the regulatory and inflammatory T cell balance

Mai Fujiwara et al. J Clin Invest. .

Abstract

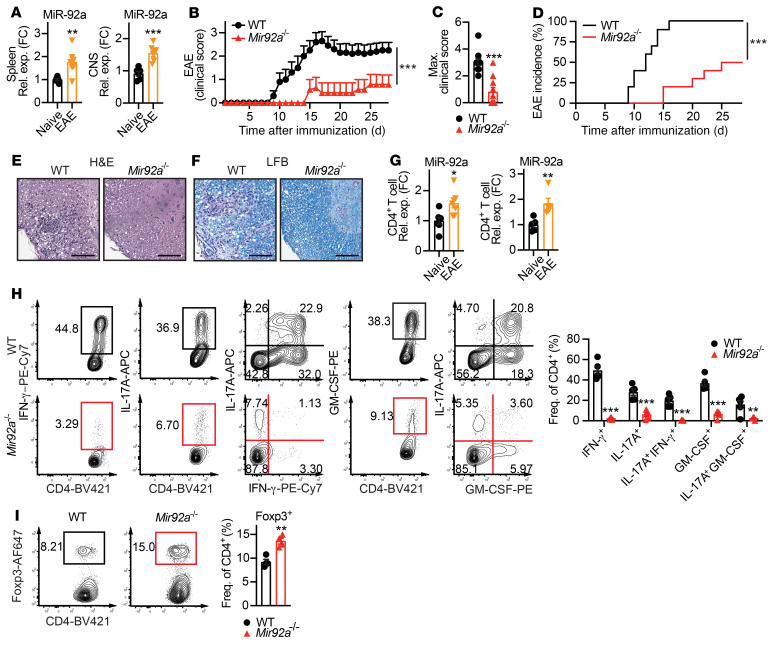
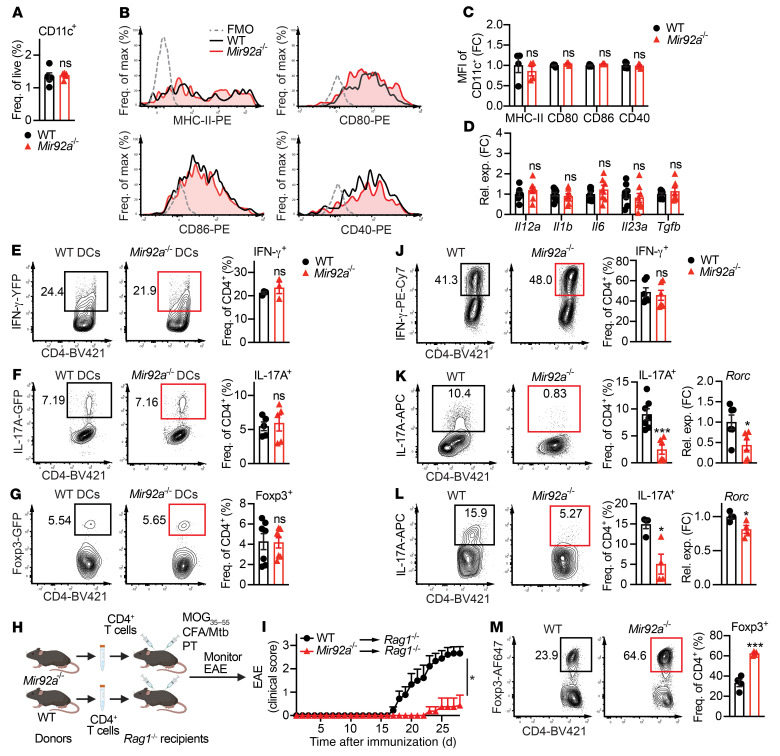
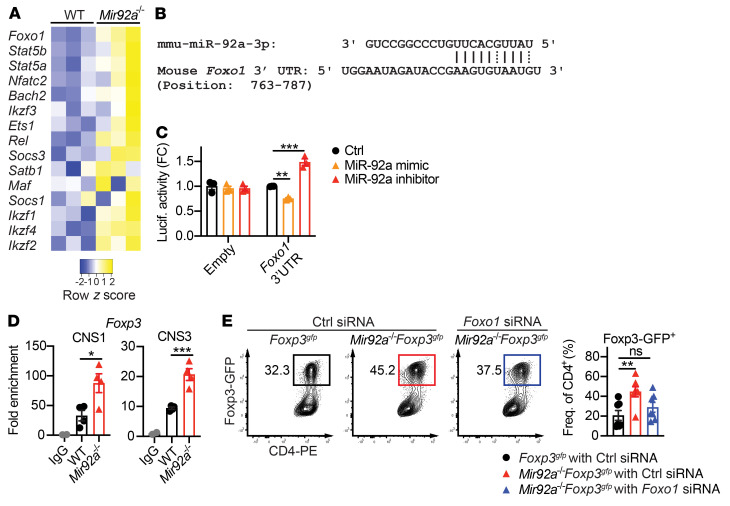
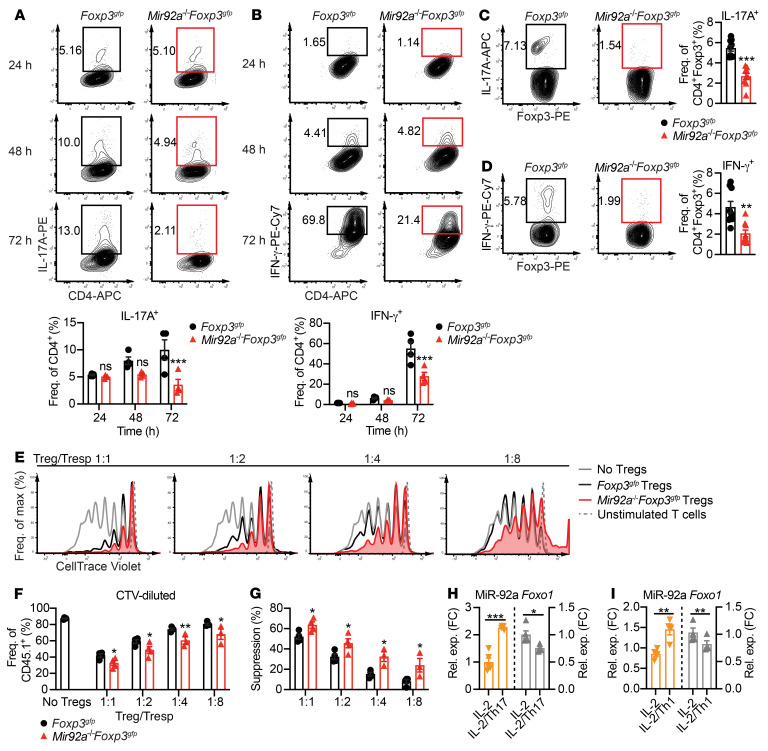
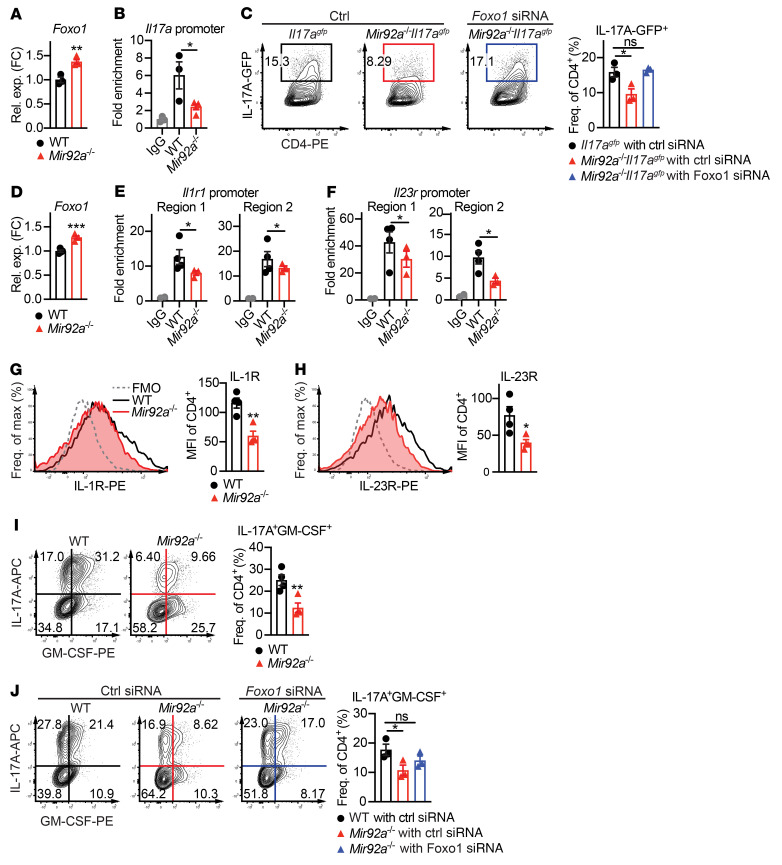
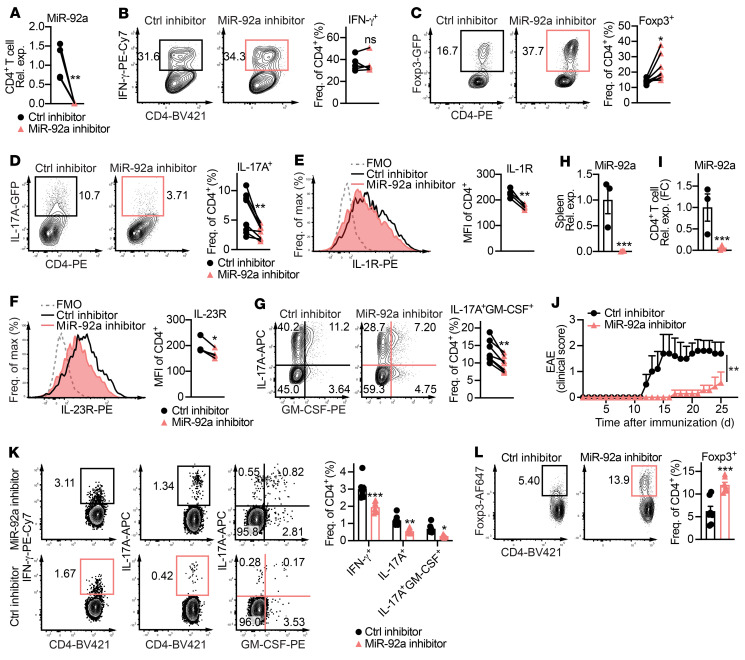
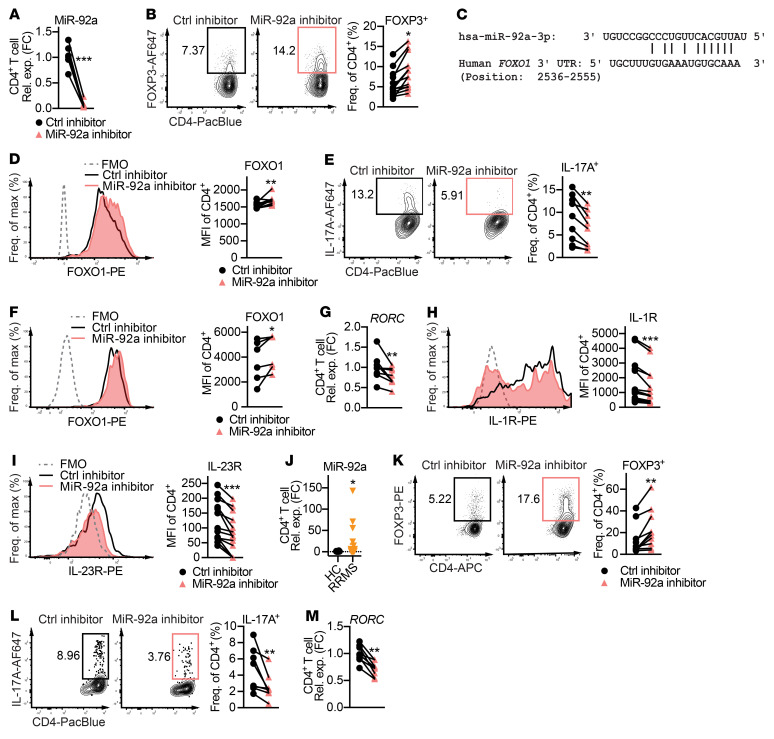
A disequilibrium between immunosuppressive Tregs and inflammatory IL-17-producing Th17 cells is a hallmark of autoimmune diseases, including multiple sclerosis (MS). However, the molecular mechanisms underlying the Treg and Th17 imbalance in CNS autoimmunity remain largely unclear. Identifying the factors that drive this imbalance is of high clinical interest. Here, we report a major disease-promoting role for microRNA-92a (miR-92a) in CNS autoimmunity. miR-92a was elevated in experimental autoimmune encephalomyelitis (EAE), and its loss attenuated EAE. Mechanistically, miR-92a mediated EAE susceptibility in a T cell-intrinsic manner by restricting Treg induction and suppressive capacity, while supporting Th17 responses, by directly repressing the transcription factor Foxo1. Although miR-92a did not directly alter Th1 differentiation, it appeared to indirectly promote Th1 cells by inhibiting Treg responses. Correspondingly, miR-92a inhibitor therapy ameliorated EAE by concomitantly boosting Treg responses and dampening inflammatory T cell responses. Analogous to our findings in mice, miR-92a was elevated in CD4+ T cells from patients with MS, and miR-92a silencing in patients' T cells promoted Treg development but limited Th17 differentiation. Together, our results demonstrate that miR-92a drives CNS autoimmunity by sustaining the Treg/Th17 imbalance and implicate miR-92a as a potential therapeutic target for MS.

Keywords: Autoimmune diseases; Autoimmunity; Inflammation; Multiple sclerosis; T cells.


Figures

Figure 1
Figure 1. Mir92a–/– mice develop attenuated EAE.
(A) qPCR analysis of miR-92a in total splenocytes (spleen, left) and spinal cords (CNS, right) from WT mice at EAE onset (n = 6–7). (B) Clinical EAE scores for WT and Mir92a–/– mice (n = 9–10) via standardized EAE clinical scale for ascending paralysis from 0–5 on each day during the observation period for each mouse. (C) Maximum (Max.) EAE clinical scores reached for each individual WT and Mir92a–/– mouse (n = 9–10) during the observation period from B. (D) Percentage of disease incidence for WT and Mir92a–/– mice (n = 9–10) on each day during the observation period from B. (E and F) Representative histopathological sections of spinal cords from WT and Mir92a–/– mice at peak EAE, showing immune cell infiltration via H&E staining (E) and demyelination via LFB staining (F). Scale bars: 100 μm. Original magnification, ×100. (G) qPCR analyses of miR-92a in splenic CD4+ T cells from naive WT mice versus that in EAE WT mice (n = 7) (left) and miR-92a in splenic CD4+ T cells from naive WT mice versus CNS-infiltrating CD4+ T cells from EAE WT mice (n = 5) (right). FC, fold change. (H) Representative flow cytometric plots (left) and frequencies (right) of IFN-γ+, IL-17A+, IFN-γ+IL-17A+, GM-CSF+, and IL-17A+GM-CSF+CD4+ T cells in the spleens of WT and Mir92a–/– mice at peak EAE (n = 5–6). PE-Cy7, phycoerythrin/cyanine7. (I) Representative flow cytometric plots and frequencies of Foxp3+ Tregs in the spleens of WT and Mir92a–/– mice at EAE onset (n = 4). AF647, Alexa Fluor 647. Data are representative of 2 or more independent experiments and indicate the mean ± SEM. *P < 0.05, **P < 0.01, and ***P < 0.001, by unpaired, 2-tailed Student’s t test (A, C, G, and I), Mann-Whitney U test (B), log-rank (Mantel-Cox) test (D), or 1-way ANOVA with Šidák’s multiple-comparison test between WT and Mir92a–/– mice within each condition (H). Rel. exp., relative expression; Freq., frequency; BV421, Brilliant Violet 421.
Figure 2
Figure 2. T cell–intrinsic miR-92a promotes EAE.
(A) Frequency of CD11c+ splenic DCs from WT and Mir92a–/– mice at EAE onset (n = 5). (B and C) Representative flow cytometric histograms (B) and the MFI values (C) for MHC-II, CD80, CD86, and CD40 in DCs from these EAE mice (n = 4–5). MFIs are represented as the fold change relative to WT conditions. (D) qPCR analyses of Th-polarizing cytokines in DCs isolated from these EAE mice (n = 6–9). (EG) Representative flow cytometric plots and frequencies of IFN-γ-YFP+ (n = 3) (E), IL-17A-GFP+ (n = 5) (F), and Foxp3-GFP+ (n = 7) (G) cells in WT naive CD4+ T cells cocultured with WT or Mir92a–/– DCs. (H) Adoptive transfer schematic. Total CD4+ T cells from WT and Mir92a–/– mice were transferred into Rag1–/– recipient mice, which were then immunized and monitored for EAE. Created with BioRender.com. (I) Clinical EAE scores of Rag1–/– recipient mice (n = 8–9) in (H). (J) Representative flow cytometric plots and frequencies of IFN-γ+ cells in Th1-polarized WT and Mir92a–/– naive CD4+ T cells (n = 6). (K and L) Representative flow cytometric plots and frequencies of IL-17A+ cells and qPCR analysis of Rorc expression in nonpathogenic Th17-polarized (n = 6–7) (K) or pathogenic Th17-polarized (n = 4) (L) WT and Mir92a–/– naive CD4+ T cells. (M) Representative flow cytometric plots and frequencies of Foxp3+ cells in Treg-polarized WT and Mir92a–/– naive CD4+ T cells (n = 4). Data are representative of 2–3 independent experiments and indicate the mean ± SEM. *P < 0.05 and ***P < 0.001, by unpaired, 2-tailed Student’s t test (A, EG, and JM), 1-way ANOVA with Šidák’s multiple-comparison test between WT and Mir92a–/– mice within each condition (C and D), or Mann-Whitney U test (I).
Figure 3
Figure 3. miR-92a inhibits Treg differentiation by targeting Foxo1.
(A) Heatmap showing qPCR analyses of selected Treg/Th17-associated transcription factors in Treg-polarized WT and Mir92a–/– naive CD4+ T cells (n = 3). (B) In silico prediction analysis of complementary binding between miR-92a and the Foxo1 3′-UTR. (C) Luciferase activity in a HEK293T cell line cotransfected with luciferase plasmid containing no insert (empty) or a Foxo1 3′-UTR sequence, along with either LNA control (Ctrl), a miR-92a mimic, or a miR-92a inhibitor (n = 3). (D) ChIP analyses of Foxo1 binding to Foxp3 CNS1 or CNS3 loci in Treg-polarized Foxp3gfp and Mir92a–/– Foxp3gfp naive CD4+ T cells (n = 4). Fold enrichment is shown relative to WT IgG conditions. (E) Representative flow cytometric plots and frequencies of Foxp3+ cells in Foxp3gfp and Mir92a–/– Foxp3gfp naive CD4+ T cells transfected with control or Foxo1 siRNA and cultured under Treg-polarizing conditions (n = 7). Data are representative of 2–3 independent experiments and indicate the mean ± SEM. *P < 0.05, **P < 0.01, and ***P < 0.001, by 1-way ANOVA with Dunnet’s multiple-comparison test (C and D) or Šidák’s multiple-comparison test (E).
Figure 4
Figure 4. miR-92a promotes Treg acquisition of an inflammatory phenotype and impairs suppressive function.
(A and B) Naive CD4+ T cells from Foxp3gfp and Mir92a–/– Foxp3gfp mice were differentiated in vitro into Tregs and sorted for GFP+ cells, followed by culturing with IL-2 and IL-1β/IL-6/IL-23 (A) or with IL-2 and IL-12/IL-6 (B) for 24, 48, and 72 hours. Representative flow cytometric plots and frequencies of IL-17A+ cells (A) and IFN-γ+ cells (B) are shown (n = 4). (C and D) Representative flow cytometric plots and frequencies of IL-17A+ Tregs (C) and IFN-γ+ Tregs (D) from the spleens of Foxp3gfp and Mir92a–/– Foxp3gfp mice at EAE onset (n = 9–10). (E and F) Foxp3gfp and Mir92a–/– Foxp3gfp mice were immunized with MOG35–55/CFA, and then GFP+ Tregs from dLNs and spleens were sorted at EAE onset and cocultured with CTV-labeled WT CD45.1+ naive CD4+ Tresp cells and APCs. Representative flow cytometric plots (E) and frequencies (F) of CTV-labeled WT Tresp cells at the indicated Treg/Tresp ratios (n = 3–4). (G) Percentage of suppression calculated for the Foxp3gfp and Mir92a–/– Foxp3gfp Tregs in F. (H and I) Naive CD4+ T cells from Foxp3gfp mice were differentiated into Tregs and then sorted for GFP+ cells, followed by culturing with IL-2 alone or IL-2 plus either IL-1β/IL-6/IL-23 (IL-2/Th17) (H) or IL-6/IL-12 (IL-2/Th1) (I) for 24 hours. qPCR analyses of miR-92a (left) and Foxo1 (right) are shown (n = 4–5). Data are representative of 2–3 independent experiments and indicate the mean ± SEM. *P < 0.05, **P < 0.01, and ***P < 0.001, by unpaired, 2-tailed Student’s t test (C, D, H, and I) or 1-way ANOVA with Šidák’s multiple-comparison test between WT and Mir92a–/– mice within each condition (A, B, F, and G).
Figure 5
Figure 5. miR-92a promotes nonpathogenic and pathogenic Th17 development by targeting Foxo1.
(A) qPCR analysis of Foxo1 expression in nonpathogenic Th17-polarized WT and Mir92a–/– naive CD4+ T cells (n = 3–4). (B) ChIP analysis of RORγt binding to the Il17a locus in nonpathogenic Th17-polarized WT and Mir92a–/– naive CD4+ T cells (n = 3–4). (C) Representative flow cytometric plots and frequencies of IL-17AGFP+ cells in Il17agfp and Mir92a–/– Il17agfp naive CD4+ T cells, transfected in vitro with control or Foxo1 siRNA and then cultured under nonpathogenic Th17-polarizing conditions (n = 3). (D) qPCR analysis of Foxo1 expression in pathogenic Th17-polarized WT and Mir92a–/– naive CD4+ T cells (n = 4). (E and F) ChIP analyses of RORγt binding to the Il1r1 promoter loci (E) and Il23r promoter loci (F) in pathogenic Th17-polarized WT and Mir92a–/– naive CD4+ T cells (n = 3–4). (G and H) Representative flow cytometric histograms and MFIs of IL-1R (G) and IL-23R (H) in pathogenic Th17-polarized WT and Mir92a–/– CD4+ T cells (n = 4). MFI values shown were obtained after subtracting the MFI values of fluorescence minus one (FMO) controls for IL-1R or IL-23R. (I) Representative flow cytometric plots and frequencies of IL-17A+GM-CSF+ cells from G and H (n = 4). (J) Representative flow cytometric plots and frequencies of IL-17A+GM-CSF+ cells in WT and Mir92a–/– naive CD4+ T cells transfected with control or Foxo1 siRNA followed by culturing under pathogenic Th17-polarizing conditions (n = 3). Fold enrichment is shown relative to WT IgG conditions (B, G, and H). Data are representative of 2 independent experiments and indicate the mean ± SEM. *P < 0.05, **P < 0.01, and ***P < 0.001, by unpaired, 2-tailed Student’s t test (A, D, GI) or 1-way ANOVA with Dunnet’s multiple-comparison test (B, C, E, F, and J).
Figure 6
Figure 6. miR-92a inhibitor treatment ameliorates EAE.
(A) qPCR analysis of miR-92a in splenic CD4+ T cells cultured in vitro with miR-92a or a control inhibitor (n = 5). (BD) Representative flow cytometric plots and frequencies of IFN-γ+ (n = 5) (B), Foxp3+ (n = 7) (C), and IL-17A+ (n = 8) (D) cells among WT naive CD4+ T cells cultured under either Th1- (B), Treg- (C), or (D) nonpathogenic Th17-polarizing conditions with miR-92a or a control inhibitor, respectively. (E and F) Representative flow cytometric histograms and MFIs of IL-1R (E) and IL-23R (F) in pathogenic Th17-polarized WT naive CD4+ T cells cultured with a control or miR-92a inhibitor (n = 4). MFI values shown were obtained after subtracting the MFI values of the FMO controls for IL-1R or IL-23R. (G) Representative flow cytometric plots and frequencies of IL-17A+GM-CSF+ cells under the same conditions as in E and F. (H and I) qPCR analyses of miR-92a levels in total splenocytes (H) and splenic CD4+ T cells (I) from control and miR-92a inhibitor–treated mice (n = 3). (J) Clinical EAE scores for treated WT mice (n = 5–7). (K and L) Representative flow cytometric plots and frequencies of IFN-γ+, IL-17A+, GM-CSF+ (K), and Foxp3+ (L), splenic CD4+ T cells from treated mice at EAE onset (n = 6). Data are representative of 2 or more independent experiments and indicate the mean ± SEM. *P < 0.05, **P < 0.01, and ***P < 0.001, by paired, 2-tailed Student’s t test (AG), unpaired, 2-tailed Student’s t test (H, I, and L), Mann-Whitney U test (J), or 1-way ANOVA with Šidák’s multiple-comparison test between control inhibitor and miR-92a inhibitor treatment within each condition (K).
Figure 7
Figure 7. miR-92a inhibitor promotes Treg induction and inhibits Th17 differentiation in CD4+ T cells from patients with MS.
(A) qPCR analysis of miR-92a expression in HC naive CD4+ T cells cultured with a control or miR-92a inhibitor (n = 7). (B) Representative flow cytometric plots and frequencies of Foxp3+ cells in Treg-polarized HC naive CD4+ T cells cultured with a control or miR-92a inhibitor (n = 13). (C) In silico prediction of the complementary miR-92a and FOXO1 3′-UTR sequences. (D) Flow cytometric histograms and MFIs of Foxo1 in Treg-polarized HC naive CD4+ T cells cultured with a control or miR-92a inhibitor (n = 10). (E) Representative flow cytometric plots and frequencies of IL-17A in Th17-polarized HC naive CD4+ T cells cultured with either inhibitor (n = 9). (F) Representative flow cytometric histograms and MFIs of Foxo1 in these cells (n = 7). (G) qPCR analysis of RORC expression in these cells (n = 8). (H and I) Representative flow cytometric histograms and MFIs of IL-1R (H) and IL-23R (I) in these cells (n = 14). MFI values shown were obtained after subtracting the MFI values of the FMO controls for IL-1R or IL-23R. (J) qPCR analysis of miR-92a levels in total CD4+ T cells from HCs (n = 23) and untreated patients with RRMS (n = 28). (K) Representative flow cytometric plots and frequencies of Foxp3 in Treg-polarized MS naive CD4+ T cells cultured with a control or miR-92a inhibitor (n = 10). (L) Representative flow cytometric plots and frequencies of IL-17A+ cells in Th17-polarized MS naive CD4+ T cells cultured with either inhibitor (n = 8). (M) qPCR analysis of RORC expression in these cells. Data are representative of 2 or more independent experiments and indicate the mean ± SEM. *P < 0.05, **P < 0.01, and ***P < 0.001, by Wilcoxon signed-rank test (A, B, DI, and KM) or Mann-Whitney U test (J). PacBlue, Pacific blue stain.

References

    1. Sospedra M, Martin R. Immunology of multiple sclerosis. Semin Neurol. 2016;36(2):115–127. doi: 10.1055/s-0036-1579739. - DOI - PubMed
    1. Littman DR, Rudensky AY. Th17 and regulatory T cells in mediating and restraining inflammation. Cell. 2010;140(6):845–858. doi: 10.1016/j.cell.2010.02.021. - DOI - PubMed
    1. Jamshidian A, et al. Biased Treg/Th17 balance away from regulatory toward inflammatory phenotype in relapsed multiple sclerosis and its correlation with severity of symptoms. J Neuroimmunol. 2013;262(1-2):106–112. doi: 10.1016/j.jneuroim.2013.06.007. - DOI - PubMed
    1. Chen W, et al. Conversion of peripheral CD4+CD25– naive T cells to CD4+CD25+ regulatory T cells by TGF-beta induction of transcription factor Foxp3. J Exp Med. 2003;198(12):1875–1886. doi: 10.1084/jem.20030152. - DOI - PMC - PubMed
    1. Dalla Libera D, et al. T regulatory cells are markers of disease activity in multiple sclerosis patients. PLoS One. 2011;6(6):e21386. doi: 10.1371/journal.pone.0021386. - DOI - PMC - PubMed

Publication types