. 2022 Mar 17;17(3):e0263998.
doi: 10.1371/journal.pone.0263998. eCollection 2022.

Mapping oysters on the Pacific coast of North America: A coast-wide collaboration to inform enhanced conservation

Affiliations

Mapping oysters on the Pacific coast of North America: A coast-wide collaboration to inform enhanced conservation

Aaron Kornbluth et al. PLoS One. .

Abstract

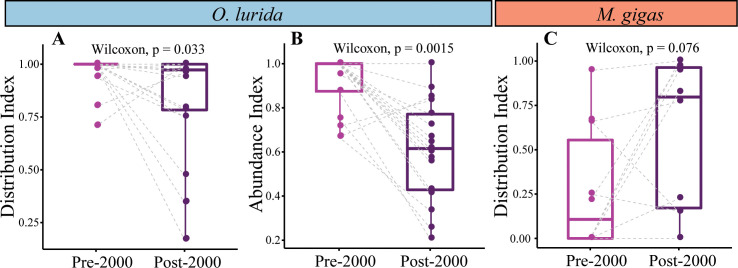
To conserve coastal foundation species, it is essential to understand patterns of distribution and abundance and how they change over time. We synthesized oyster distribution data across the west coast of North America to develop conservation strategies for the native Olympia oyster (Ostrea lurida), and to characterize populations of the non-native Pacific oyster (Magallana gigas). We designed a user-friendly portal for data entry into ArcGIS Online and collected oyster records from unpublished data submitted by oyster experts and from the published literature. We used the resulting 2,000+ records to examine spatial and temporal patterns and made an interactive web-based map publicly available. Comparing records from pre-2000 vs. post-2000, we found that O. lurida significantly decreased in abundance and distribution, while M. gigas increased significantly. Currently the distribution and abundance of the two species are fairly similar, despite one species being endemic to this region since the Pleistocene, and the other a new introduction. We mapped the networks of sites occupied by oysters based on estimates of larval dispersal distance, and found that these networks were larger in Canada, Washington, and southern California than in other regions. We recommend restoration to enhance O. lurida, particularly within small networks, and to increase abundance where it declined. We also recommend restoring natural biogenic beds on mudflats and sandflats especially in the southern range, where native oysters are currently found most often on riprap and other anthropogenic structures. This project can serve as a model for collaborative mapping projects that inform conservation strategies for imperiled species or habitats.


Conflict of interest statement

The Pew Charitable Trusts (www.pewtrusts.org) is a 501(c)(3) non-profit organization, not a commercial entity, and has no competing interests relevant to the submitted research. Pew staff member A.K. participated as co-PI in the design, data collection and analysis, and preparation of the manuscript, and was a part of the decision to publish the manuscript.

Figures

Fig 1
Fig 1. Native and non-native oysters.
Photos of M. gigas (A) and O. lurida (B) shucked (top row) and intact (bottom row), collected from San Diego Bay, CA in 2021.
Fig 2
Fig 2. Oyster distribution networks.
Examples of oyster larval and adult networks and larval optimal network connections from the San Francisco Bay area (Northern California) for O. lurida (A) and M. gigas (B). For O. lurida, the distance between the San Francisco Bay larval network (O-11) and the next closest network to the south (O-12) is due to oysters present in the Monterey Bay area, which is a shorter distance than for M. gigas, for which the next closest adults to the south (contained within network M-10, not pictured) are in Southern California.
Fig 3
Fig 3. North American west coast coast-wide distribution of O. lurida and M. gigas, 2000–2020.
Records are color-coded according to whether one, the other, both, or neither species were documented as present during this period. Note that in some cases, records overlay each other. An interactive map of these data is available (S4 File).
Fig 4
Fig 4. Summary of oyster records.
This table shows the number of records by presence/absence, region, and publication type for O. lurida and M. gigas. Grey columns indicate total records by region. Note that individual records sometimes contain data for both species, meaning the total sums of records by species exceed the total number of records collected. Abbreviations: Pub = Published, Unpub = Unpublished, iNat = iNaturalist.
Fig 5
Fig 5. Oyster records over time.
(A) unpublished records, which increased after 2000, and especially in 2020 as a result of our crowdsourced effort. (B) published records. This graph omits records before 1900, which consisted of one record from 1602, one from 1804, and 105 from 1840–1899.
Fig 6
Fig 6. Number of estuaries with oysters present by species, pre-2000 vs. post-2000.
Fig 7
Fig 7. Paired comparisons of distribution and abundance indices in the same estuary over time.
(A) O. lurida distribution index (n = 21 estuaries). (B) O. lurida abundance index (n = 17). (C) M. gigas distribution index (n = 10). A dashed line connects the same estuary pre-2000 vs. post-2000.
Fig 8
Fig 8. Distribution and abundance indices across estuaries over time.
The index is shown for estuaries if at least three records were available for the time period. Estuaries were included in this table only if at least one species had three records for both periods for at least one index. Blank cells indicate that fewer than three records were available. The change in the index at each estuary is shown if data are available for both periods.
Fig 9
Fig 9. Summary of oyster network data.
Networks are listed from north to south. In the eight rows with bold font and gray shading, the networks for both oyster species share the same focal estuary, and can be directly compared. Adult network size could not be calculated for the northern estuaries since no geospatial layer of estuarine boundaries was available. Conditional formatting was applied, in green to parameters that are favorable to oyster population persistence (large networks, high abundance, etc.) and in red for network isolation, where high numbers indicate long distances to the next adjacent network, which is unfavorable to among-network population connectivity.
Fig 10
Fig 10. Coast-wide larval networks.
Larval networks for O. lurida (A) and M. gigas (B) showing large larval networks in the Salish Sea to the north and in Southern California to the south. Networks are similar in size and location between species but not identical.
Fig 11
Fig 11. Coast-wide oyster abundance.
The abundances of O. lurida (A) and M. gigas (B) vary by region. Note that some points may not be visible (i.e., they are hidden beneath other points) due to map scale.
Fig 12
Fig 12. Relationship of estuary latitude and area with distribution index.
(A) The distribution index for both O. lurida and M. gigas is plotted against latitude using local polynomial regression fitting for this distinctly non-linear relationship. (B) The distribution index for both O. lurida and M. gigas is plotted against the log10 of the area of the estuary and fitted with linear regression; the Kendall rank correlation is shown. Each point represents a single estuary in all graphs.
Fig 13
Fig 13. Paired comparisons of distribution and abundance indices between O. lurida and M. gigas in the same estuaries.
(A) Distribution index (n = 39 estuaries); (B) Abundance index (n = 19). A dashed line connects records of the two species in the same estuary and p value indicates significance of Wilcoxon test.
Fig 14
Fig 14. Proportion of substrate types used across regions for both oysters.
The number of records for each species and region is shown in parentheses above each column. Abbreviations: CN = Canada, WA = Washington, OR = Oregon, N CA / S CA = Northern / Southern California. Substrate types are arranged from smallest (bottom) to largest (top); details on substrate type definitions are in the Methods.
Fig 15
Fig 15. Examples of substrate types in survey.
(A) O. lurida bed in North Bay, Case Inlet, Washington (Photo: B. Blake). (B) M. gigas on cobble at Chula Vista Wildlife Reserve, San Diego Bay, California (Photo: D. Zacherl). (C) M. gigas on riprap and pier piling in San Diego Bay, California (Photo: B. Perog). (D) M. gigas and O. lurida on seawall in San Diego Bay, California (Photo: D. Zacherl).

References

    1. Dayton PK. Toward an understanding of community resilience and the potential effects of enrichments to the benthos at McMurdo Sound, Antarctica. Allen Press Lawrence, Kansas, USA; 1972. pp. 81–96.
    1. Babcock RC, Bustamante RH, Fulton EA, Fulton DJ, Haywood MDE, Hobday AJ, et al.. Severe continental-scale impacts of climate change are happening now: extreme climate events impact marine habitat forming communities along 45% of Australia’s coast. Front Mar Sci. 2019;0. doi: 10.3389/fmars.2019.00411 - DOI
    1. Angelini C, Altieri AH, Silliman BR, Bertness MD. Interactions among foundation species and their consequences for community organization, biodiversity, and conservation. BioScience. 2011;61: 782–789. doi: 10.1525/bio.2011.61.10.8 - DOI
    1. Hughes TP, Barnes ML, Bellwood DR, Cinner JE, Cumming GS, Jackson JBC, et al.. Coral reefs in the Anthropocene. Nature. 2017;546: 82–90. doi: 10.1038/nature22901 - DOI - PubMed
    1. Waycott M, Duarte CM, Carruthers TJB, Orth RJ, Dennison WC, Olyarnik S, et al.. Accelerating loss of seagrasses across the globe threatens coastal ecosystems. Proc Natl Acad Sci. 2009;106: 12377–12381. doi: 10.1073/pnas.0905620106 - DOI - PMC - PubMed

Publication types