

COVID-19 Risk Stratification and Mortality Prediction in Hospitalized Indian Patients: Harnessing clinical data for public health benefits
- PMID: 35298502
- PMCID: PMC8929610
- DOI: 10.1371/journal.pone.0264785
COVID-19 Risk Stratification and Mortality Prediction in Hospitalized Indian Patients: Harnessing clinical data for public health benefits
Abstract
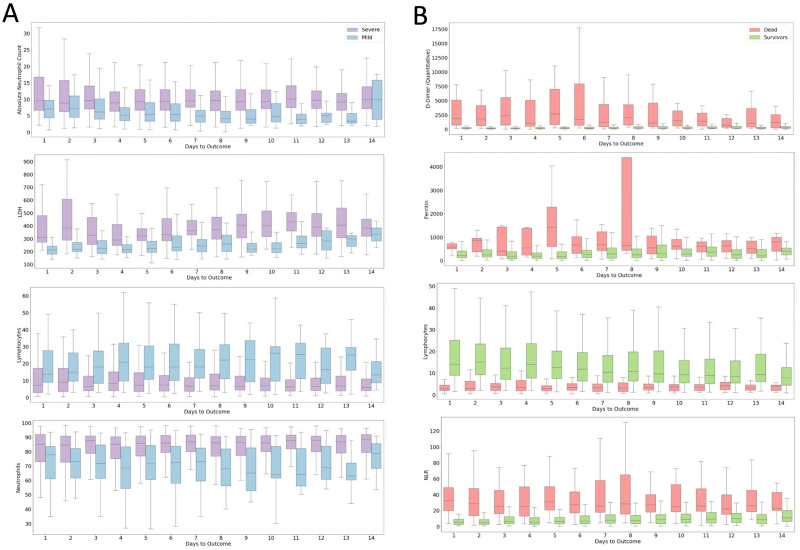
The variability of clinical course and prognosis of COVID-19 highlights the necessity of patient sub-group risk stratification based on clinical data. In this study, clinical data from a cohort of Indian COVID-19 hospitalized patients is used to develop risk stratification and mortality prediction models. We analyzed a set of 70 clinical parameters including physiological and hematological for developing machine learning models to identify biomarkers. We also compared the Indian and Wuhan cohort, and analyzed the role of steroids. A bootstrap averaged ensemble of Bayesian networks was also learned to construct an explainable model for discovering actionable influences on mortality and days to outcome. We discovered blood parameters, diabetes, co-morbidity and SpO2 levels as important risk stratification features, whereas mortality prediction is dependent only on blood parameters. XGboost and logistic regression model yielded the best performance on risk stratification and mortality prediction, respectively (AUC score 0.83, AUC score 0.92). Blood coagulation parameters (ferritin, D-Dimer and INR), immune and inflammation parameters IL6, LDH and Neutrophil (%) are common features for both risk and mortality prediction. Compared with Wuhan patients, Indian patients with extreme blood parameters indicated higher survival rate. Analyses of medications suggest that a higher proportion of survivors and mild patients who were administered steroids had extreme neutrophil and lymphocyte percentages. The ensemble averaged Bayesian network structure revealed serum ferritin to be the most important predictor for mortality and Vitamin D to influence severity independent of days to outcome. The findings are important for effective triage during strains on healthcare infrastructure.
Conflict of interest statement
Authors, Ramanathan Sethuraman, C. Subramanian, Mashrin Srivastava, Avinash Chakravarthi, Johnny Jacob, Madhuri Namagiri, and Varma Konala are employed by the company, Intel Technology India Private Limited, Bangalore, India. The remaining authors declare that the research was conducted in the absence of any commercial or financial relationships that could be construed as a potential conflict of interest. This does not alter our adherence to PLOS ONE policies on sharing data and materials.
Figures


Similar articles
-
Clinical and inflammatory features based machine learning model for fatal risk prediction of hospitalized COVID-19 patients: results from a retrospective cohort study.Ann Med. 2021 Dec;53(1):257-266. doi: 10.1080/07853890.2020.1868564. Ann Med. 2021. PMID: 33410720 Free PMC article.
-
Machine Learning to Predict Mortality and Critical Events in a Cohort of Patients With COVID-19 in New York City: Model Development and Validation.J Med Internet Res. 2020 Nov 6;22(11):e24018. doi: 10.2196/24018. J Med Internet Res. 2020. PMID: 33027032 Free PMC article.
-
Multivariable mortality risk prediction using machine learning for COVID-19 patients at admission (AICOVID).Sci Rep. 2021 Jun 17;11(1):12801. doi: 10.1038/s41598-021-92146-7. Sci Rep. 2021. PMID: 34140592 Free PMC article.
-
Predictive Modeling of Morbidity and Mortality in Patients Hospitalized With COVID-19 and its Clinical Implications: Algorithm Development and Interpretation.J Med Internet Res. 2021 Jul 9;23(7):e29514. doi: 10.2196/29514. J Med Internet Res. 2021. PMID: 34081611 Free PMC article.
-
Machine-learning-based COVID-19 mortality prediction model and identification of patients at low and high risk of dying.Crit Care. 2021 Sep 8;25(1):328. doi: 10.1186/s13054-021-03749-5. Crit Care. 2021. PMID: 34496940 Free PMC article.
Cited by
-
Predicting Intensive Care Unit Admission for COVID-19 Patients from Laboratory Results.Dis Markers. 2022 May 26;2022:4623901. doi: 10.1155/2022/4623901. eCollection 2022. Dis Markers. 2022. PMID: 35634446 Free PMC article.
-
Association of COVID-19 with acute and post-acute risk of multiple different complications and mortality in patients infected with omicron variant stratified by initial disease severity: a cohort study in Hong Kong.BMC Med. 2024 Oct 14;22(1):461. doi: 10.1186/s12916-024-03630-6. BMC Med. 2024. PMID: 39402606 Free PMC article.
-
Design of an artificial neural network to predict mortality among COVID-19 patients.Inform Med Unlocked. 2022;31:100983. doi: 10.1016/j.imu.2022.100983. Epub 2022 May 29. Inform Med Unlocked. 2022. PMID: 35664686 Free PMC article.
-
Predicting clinical outcomes of SARS-CoV-2 infection during the Omicron wave using machine learning.PLoS One. 2024 Apr 25;19(4):e0290221. doi: 10.1371/journal.pone.0290221. eCollection 2024. PLoS One. 2024. PMID: 38662748 Free PMC article.
-
Towards Improved XAI-Based Epidemiological Research into the Next Potential Pandemic.Life (Basel). 2024 Jun 21;14(7):783. doi: 10.3390/life14070783. Life (Basel). 2024. PMID: 39063538 Free PMC article. Review.
References
Publication types
MeSH terms
LinkOut - more resources
Full Text Sources
Medical
