. 2022 Apr 7;82(7):1329-1342.e8.
doi: 10.1016/j.molcel.2022.02.026. Epub 2022 Mar 16.

High-throughput biochemical profiling reveals functional adaptation of a bacterial Argonaute

Affiliations

High-throughput biochemical profiling reveals functional adaptation of a bacterial Argonaute

Benjamin Ober-Reynolds et al. Mol Cell. .

Abstract

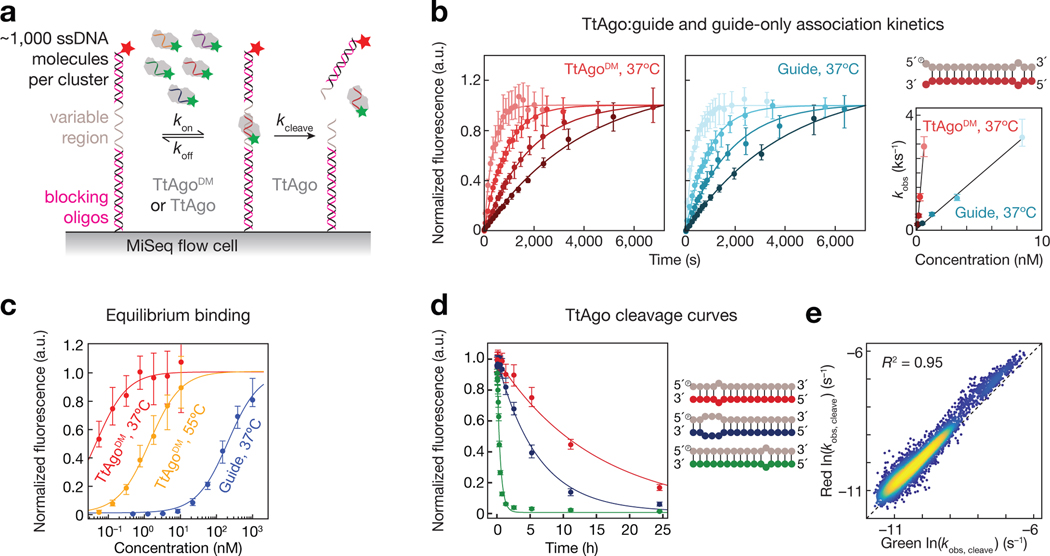
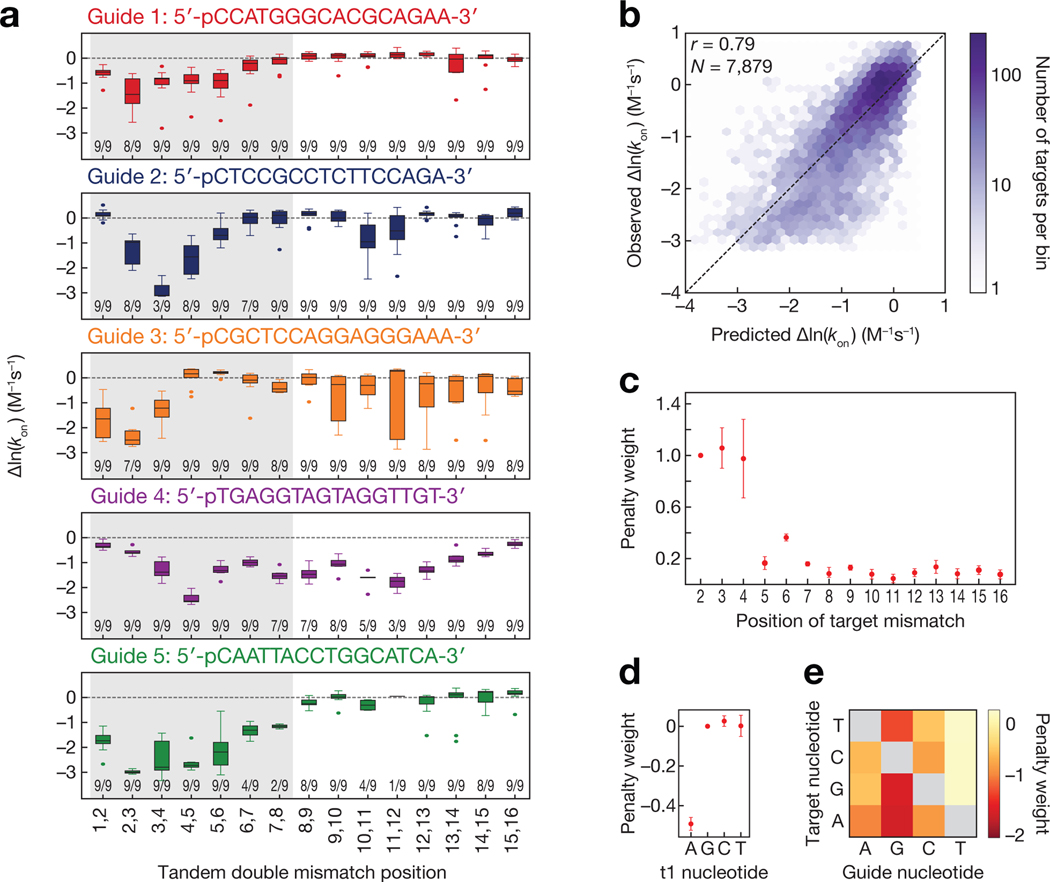
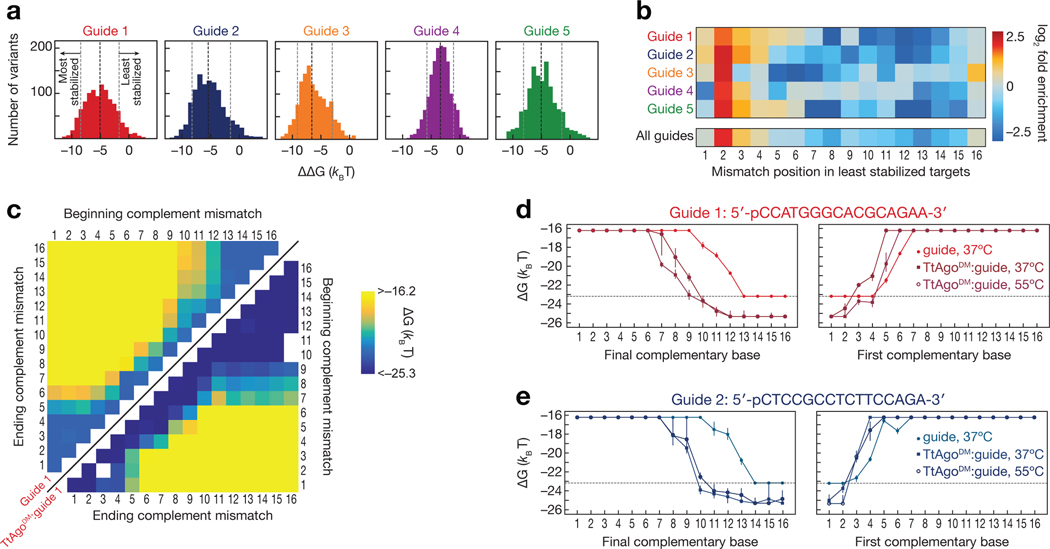
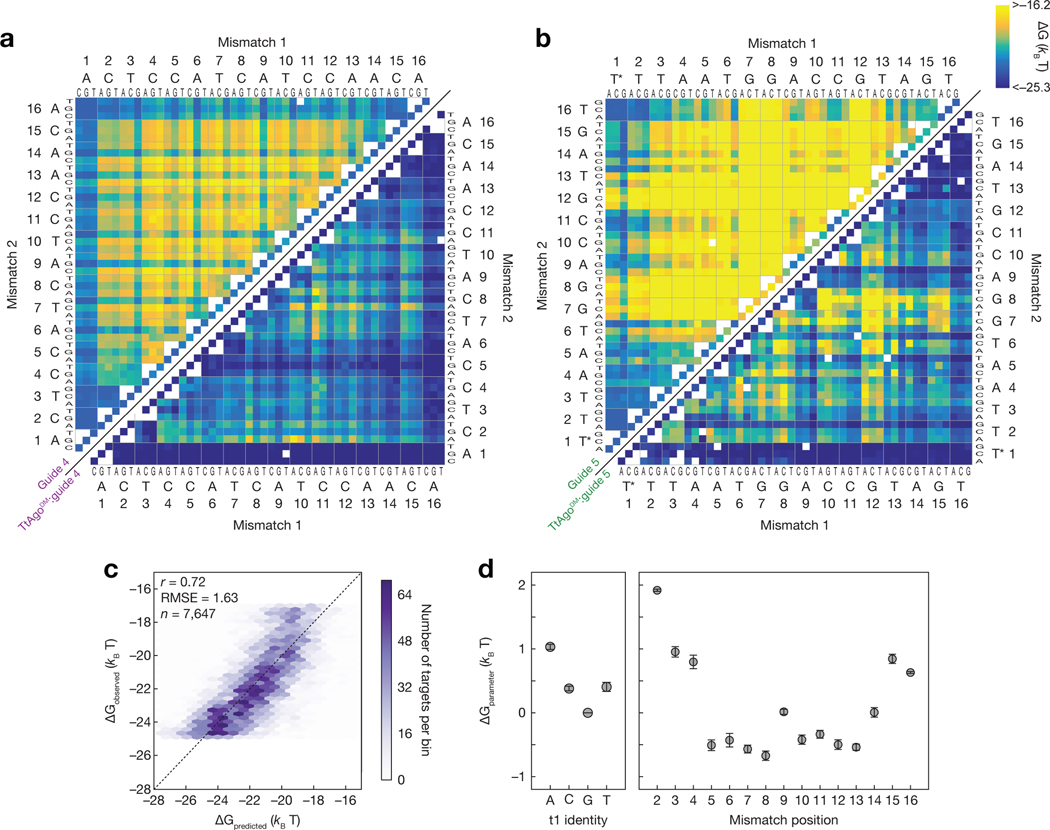
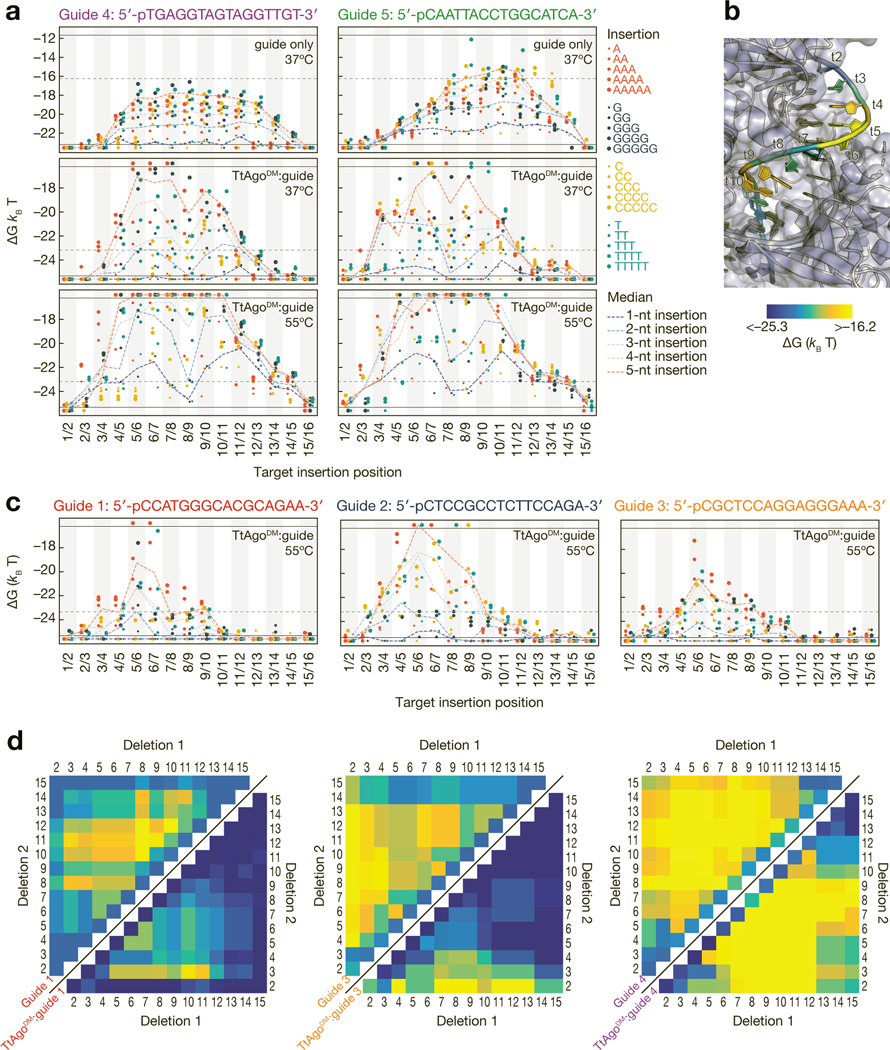
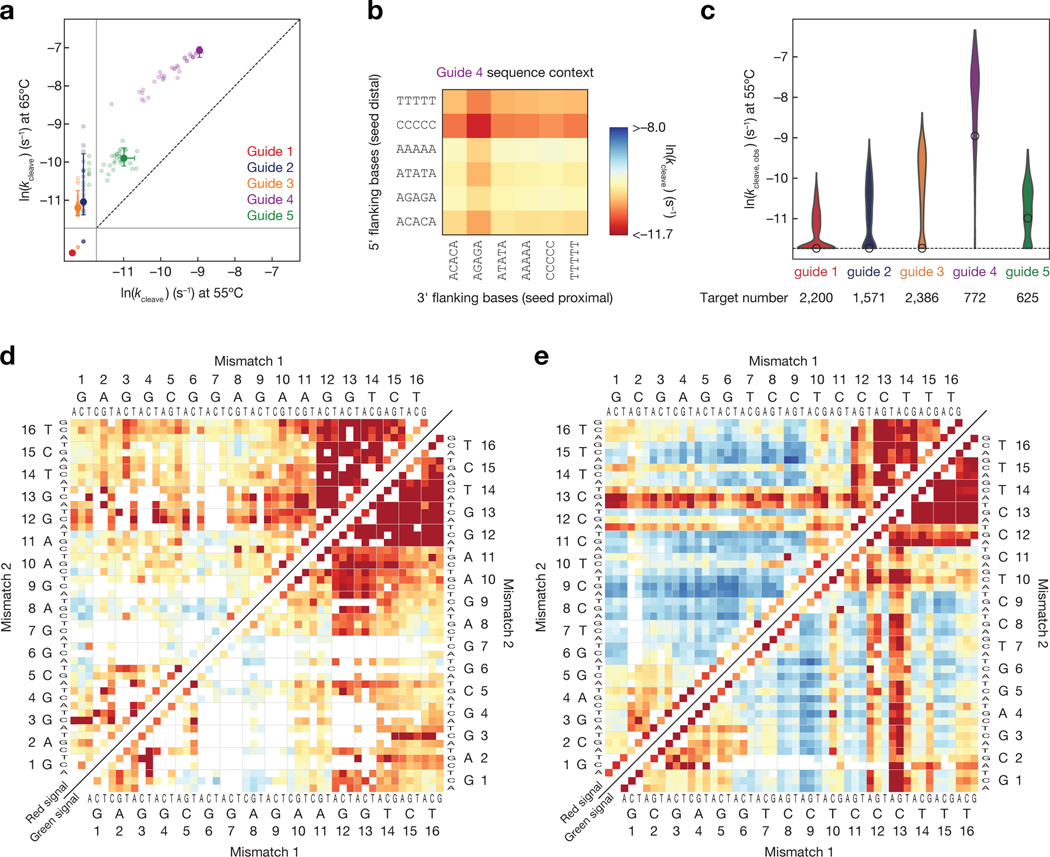
Argonautes are nucleic acid-guided proteins that perform numerous cellular functions across all domains of life. Little is known about how distinct evolutionary pressures have shaped each Argonaute's biophysical properties. We applied high-throughput biochemistry to characterize how Thermus thermophilus Argonaute (TtAgo), a DNA-guided DNA endonuclease, finds, binds, and cleaves its targets. We found that TtAgo uses biophysical adaptations similar to those of eukaryotic Argonautes for rapid association but requires more extensive complementarity to achieve high-affinity target binding. Using these data, we constructed models for TtAgo association rates and equilibrium binding affinities that estimate the nucleic acid- and protein-mediated components of the target interaction energies. Finally, we showed that TtAgo cleavage rates vary widely based on the DNA guide, suggesting that only a subset of guides cleaves targets on physiologically relevant timescales.

Keywords: Argonaute; RNA silencing; Thermus thermophilus; TtAgo; high-throughput biochemistry; miRNA; pAGO; siDNA; siRNA; single-molecule biophysics.


Conflict of interest statement

Declaration of interests P.D.Z. is a member of the scientific advisory boards of Alnylam Pharmaceuticals, Voyager Therapeutics, and ProQR. He is also a consultant for The RNA Medicines Company. W.J.G is a scientific co-founder of Protillion and a consultant, and equity holder, for Guardant Health, 10X Genomics, Ultima Genomics, and Quantapore.

Figures

Figure 1 |
Figure 1 |
High-throughput Characterization of TtAgo binding and cleavage. (a) Schematic of TtAgo loaded with a fluorescent guide binding and cleaving ssDNA targets in a sequenced MiSeq flow cell. Target cleavage was scored by loss of red fluorescent signal, signifying release of 3′ cleavage product, or loss of green fluorescent signal, indicating TtAgo departure from cleaved targets. (b) A representative set of association data for a single target. Error bars correspond to the 95% confidence interval on the median fluorescence. The plot to the right shows the relationship between concentration of unloaded guide or guide-loaded TtAgo and observed rate, from which the association rate was determined. (c) Representative binding isotherms for unloaded guide at 37ºC and guide-loaded TtAgo measured at 37ºC and 55ºC. Error bars correspond to the 95% confidence interval on the normalized fit maximum fluorescence from each association experiment. (d) Representative cleavage curves for three different targets (shown in corresponding color in schematic) containing different degrees of complementarity to the guide (in gray). Cleavage was measured at 55ºC. Error bars correspond to the 95% confidence interval on the normalized fit maximum fluorescence from each cleavage experiment. (e) Correlation of fitted cleavage rates using the departure of TtAgo (green), or release of the cleaved product (red) as the signal for cleavage. See also Figure S1.
Figure 2 |
Figure 2 |
Sequence determinants of TtAgo association kinetics. (a) Change in association rates for tandem double mismatches of TtAgo targets relative to a fully complementary target (dashed line). Numbers near the bottom of each plot indicate the number of targets (out of a possible 9) in each group that were within the limits of detection. The region corresponding to the eukaryotic Ago seed region (bases t2–t8) is shaded in gray. (b) Comparison of model predicted TtAgoDM relative association rates to observed relative association rates. Color bar indicates the number of targets in each bin. Guide 4 was excluded from all association model training and testing data due to its outlier association behavior (applies to b-e). (c) Target position penalty weights. Error bars indicate SEM of penalty weights across models fit with each guide held out in turn (n = 4). (d) t1 base identity penalty weights. Error bars as in (c). (e) Guide to target mismatch penalty weights. See also Figure S2.
Figure 3 |
Figure 3 |
Differential effects of mismatches on binding affinity of unloaded guide and guide-loaded TtAgo. (a) Difference in measured binding energies between TtAgoDM:guide and unloaded guide. Shown are targets for which binding affinities of both TtAgoDM:guide and unloaded guide were within limits of detection. The black dotted line indicates the median binding energy difference, while the gray dotted lines indicate the bottom and top 10% of binding energy differences. (b) Enrichment of mismatch positions in the 10% of least TtAgo-stabilized targets, relative to all measured targets. (c) Binding energies for unloaded guide 1 (upper left) and TtAgoDM:guide 1 (lower right) targets containing stretches of complementary nucleotide mismatches (e.g., A to T). E.g., for the 2–4 mismatches, the corresponding targets in the heatmap are located at the intersection of 2 on the “beginning complement mismatch” axis and 4 on the “ending complement mismatch” axis. White asterisks on the upper left heatmap indicate the minimum measurable binding affinity for the unloaded guide. (d–e) Binding energies for guide 1 (d) and guide 2 (e) targets containing progressively more complementarity to the DNA guide. Target mismatches progress from the 5′ end (left panel) or the 3′ end (right panel) of the target. Error bars indicate the 95% confidence interval on the binding energy. The dotted line indicates the minimum measurable binding affinity for unloaded guide. See also Figure S3.
Figure 4 |
Figure 4 |
Predictive model for TtAgo binding. (a) Measured binding energies for unloaded guide 4 (upper left) and TtAgoDM:guide 4 (lower right) binding to single and double mismatched targets at 37°C. Axes are labeled with the 3′ end of the target (5′ end of the guide) starting at position 1. White boxes represent missing data. White asterisks on the upper left heatmap indicate the minimum measurable binding affinity for the unloaded guide. (b) Same as in (a), but for guide 5. (c) Comparison of binding energies predicted by the mismatch-only model to the observed binding energies when trained on all data. (d) Mean parameters obtained when fitting the mismatch-only model with each guide held out in turn (n = 5). Error bars indicate SEM of fitted values across the five model fits. See also Figure S4.
Figure 5 |
Figure 5 |
Effect of insertions and deletions of target nucleotides on binding energy. (a) Binding energies for unloaded guide at 37ºC (top), TtAgoDM:guide at 37ºC (middle) and TtAgoDM:guide at 55ºC (bottom) to targets with 1- to 5-nt insertions. Axes are labeled with the 3′ end of the target (5′ end of the guide) starting at position 1. Horizontal black lines indicate the limits of detection, and points below the bottom black line bound with higher affinity than the detection limit. The horizontal grey dotted lines in the unloaded guide plots indicate the TtAgoDM upper limit of detection and the horizontal grey lines in the TtAgoDM plots indicate the lower limit of detection for the unloaded guide. (b) The median binding energies of double insertions at each position mapped onto the target strand of a TtAgo crystal structure (PDB ID: 4NCB). Affinity of target insertions between t1/t2 are displayed on t2 of the target strand. (c) Binding energies for the three endogenous guides to targets with 1- to 5-nt insertions at 55°C. Color legend as in (a). (d) Binding energies of unloaded guide (upper left) and TtAgoDM:guide (lower right) to DNA targets with single and double deletions at 37°C. Color bar as in (b). White asterisks on the upper left heatmap indicate the minimum measurable binding affinity for the unloaded guide. See also Figure S5.
Figure 6 |
Figure 6 |
Influence of guide sequence and target mismatches on single turnover cleavage kinetics. (a) Cleavage rates of fully complementary targets for each of the five guides at 55°C and 65°C. Error bars indicate the 95% confidence interval on the fit cleavage rate. Light points indicate the cleavage rates of the fully complementary target in alternative flanking sequence contexts. The solid gray lines indicate the limits of detection, and the targets below the solid lines fell beyond those limits. (b) Cleavage rates measured for fully complementary targets of the guide 4 with different 5-nt flanking sequences. (c) Cleavage rates of mismatched targets for each of the five guides. The white dot indicates the cleavage rate of the fully complementary target. Only targets predicted to have saturated binding are shown. (d–e) Single turnover cleavage rates of targets complementary to the guide 2 (d) or guide 3 (e) containing single and double mismatches. Cleavage was measured at 55ºC and was scored by loss of red fluorescence (upper left), i.e. release of the cleaved product, or by loss of the green fluorescence (lower right), i.e. departure of TtAgo. Axes are labeled with the 3′ end of the target (5′ end of the guide) starting at position 1. Color bar as in (b). See also Figure S6.

Similar articles

Cited by

References

    1. Ameres SL, Martinez J, and Schroeder R. (2007). Molecular basis for target RNA recognition and cleavage by human RISC. Cell 130, 101–112. - PubMed
    1. Anzelon TA, Chowdhury S, Hughes SM, Xiao Y, Lander GC, and MacRae IJ (2021). Structural basis for piRNA targeting. Nature 597, 285–289. - PMC - PubMed
    1. Baek D, Villén J, Shin C, Camargo FD, Gygi SP, and Bartel DP (2008). The impact of microRNAs on protein output. Nature 455, 64–71. - PMC - PubMed
    1. Bartel DP (2018). Metazoan MicroRNAs. Cell 173, 20–51. - PMC - PubMed
    1. Becker WR, Ober-Reynolds B, Jouravleva K, Jolly SM, Zamore PD, and Greenleaf WJ (2019). High-Throughput Analysis Reveals Rules for Target RNA Binding and Cleavage by AGO2. Mol. Cell 75, 741–755.e11. - PMC - PubMed

Publication types

MeSH terms

LinkOut - more resources