. 2022 Mar 1:12:777395.
doi: 10.3389/fphar.2021.777395. eCollection 2021.

Lipidomic Analysis Reveals the Protection Mechanism of GLP-1 Analogue Dulaglutide on High-Fat Diet-Induced Chronic Kidney Disease in Mice

Affiliations

Lipidomic Analysis Reveals the Protection Mechanism of GLP-1 Analogue Dulaglutide on High-Fat Diet-Induced Chronic Kidney Disease in Mice

Martin Ho Yin Yeung et al. Front Pharmacol. .

Abstract

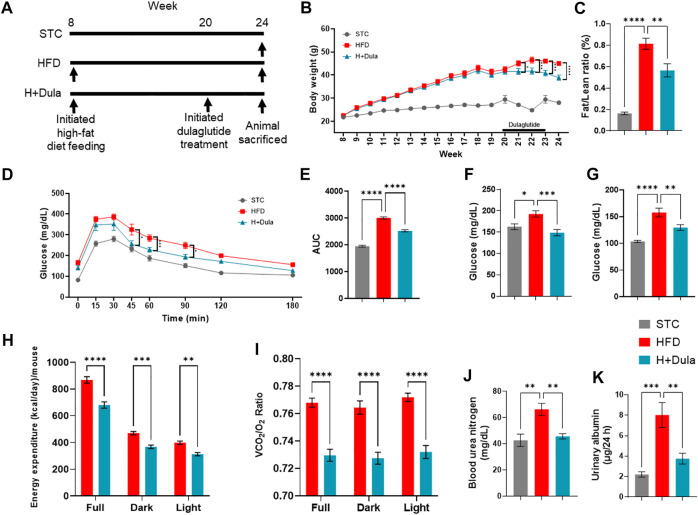
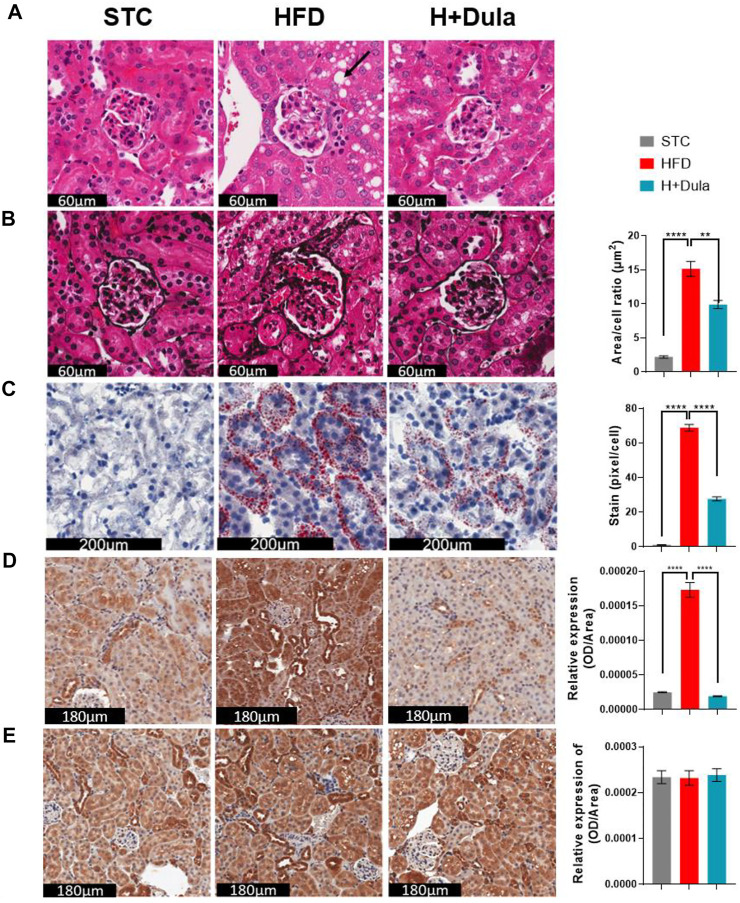
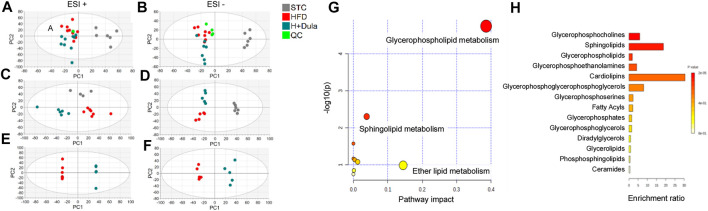
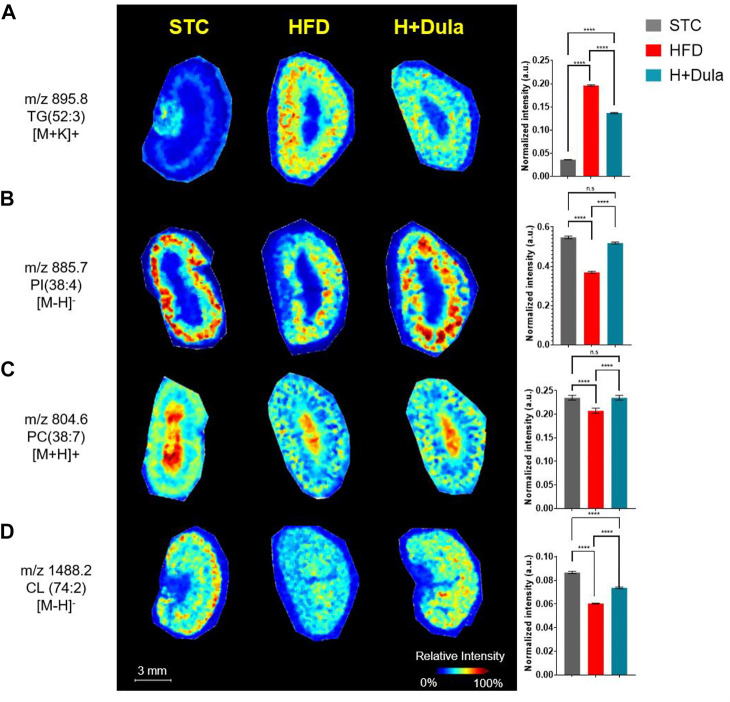
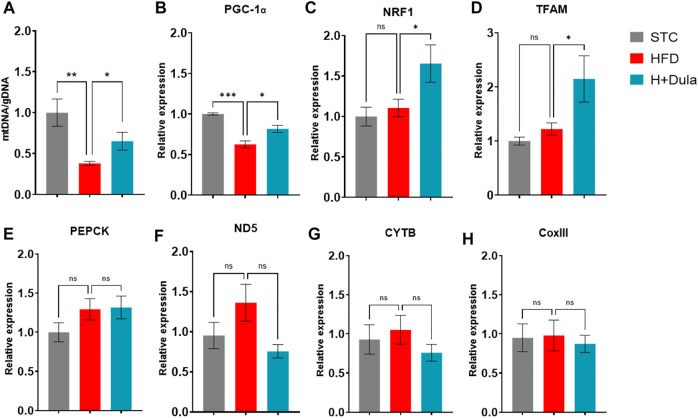
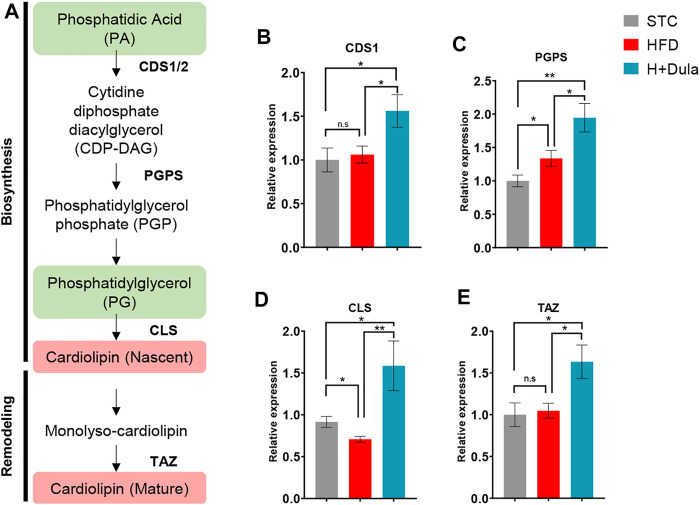
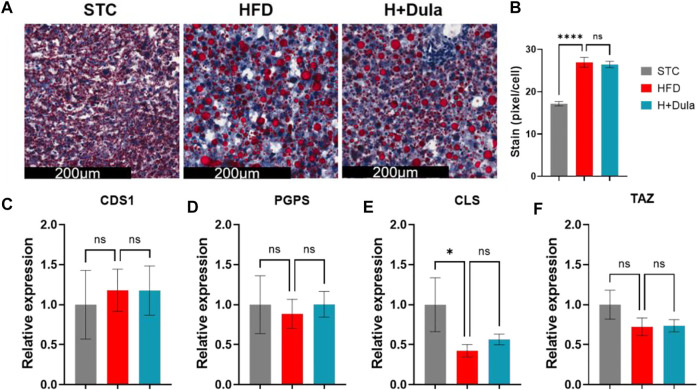
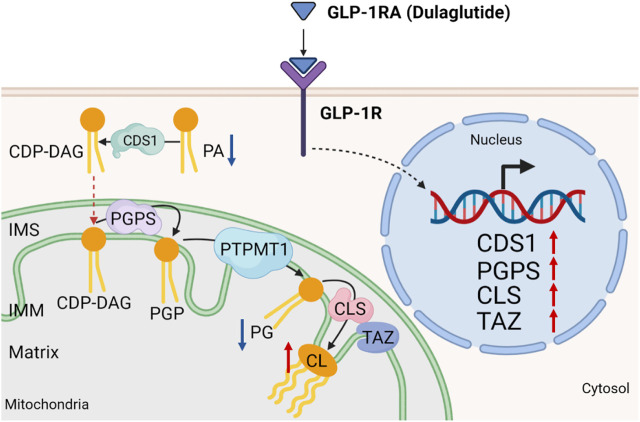
Many clinical studies have suggested that glucagon-like peptide-1 receptor agonists (GLP-1RAs) have renoprotective properties by ameliorating albuminuria and increasing glomerular filtration rate in patients with type 2 diabetes mellitus (T2DM) and chronic kidney disease (CKD) by lowering ectopic lipid accumulation in the kidney. However, the mechanism of GLP-1RAs was hitherto unknown. Here, we conducted an unbiased lipidomic analysis using ultra-high-performance liquid chromatography/electrospray ionization-quadrupole time-of-flight mass spectrometry (UHPLC/ESI-Q-TOF-MS) and matrix-assisted laser desorption/ionization mass spectrometry imaging (MALDI-MSI) to reveal the changes of lipid composition and distribution in the kidneys of high-fat diet-fed mice after treatment with a long-acting GLP-1RA dulaglutide for 4 weeks. Treatment of dulaglutide dramatically improved hyperglycemia and albuminuria, but there was no substantial improvement in dyslipidemia and ectopic lipid accumulation in the kidney as compared with controls. Intriguingly, treatment of dulaglutide increases the level of an essential phospholipid constituent of inner mitochondrial membrane cardiolipin at the cortex region of the kidneys by inducing the expression of key cardiolipin biosynthesis enzymes. Previous studies demonstrated that lowered renal cardiolipin level impairs kidney function via mitochondrial damage. Our untargeted lipidomic analysis presents evidence for a new mechanism of how GLP-1RAs stimulate mitochondrial bioenergetics via increasing cardiolipin level and provides new insights into the therapeutic potential of GLP-1RAs in mitochondrial-related diseases.

Keywords: GLP-1R agonists; chronic kidney disease; diabetic kidney disease; dulaglutide; lipidomics; mass spectrometry imaging; obesity.


Conflict of interest statement

The authors declare that the research was conducted in the absence of any commercial or financial relationships that could be construed as a potential conflict of interest.

Figures

FIGURE 1
FIGURE 1
Dulaglutide improves high-fat diet-induced kidney damage in mice. (A) Timeline of high-fat diet feeding and dulaglutide treatment. (B) Changes in body weight on STC, HFD and H + Dula group of mice (One-way ANOVA with Tukey post-hoc test was performed between the HFD and H + Dula groups; *p < 0.05, ***p < 0.001 and ****p < 0.0001 compared between HFD and H + Dula groups). (C) 1H nuclear magnetic resonance was used to calculate fat/lean ratio (week 24). (D) Intraperitoneal glucose tolerance test (IPGTT) was performed (One-way ANOVA with Tukey post-hoc test was performed between the HFD and H + Dula groups* p < 0.05 and ***p < 0.001) and (E) area under curve was calculated (week 22). (F) Fed and (G) fasting glucose were measured (week 24). (H) Energy expenditure and (I) respiratory exchange ratio (RER) was calculated by volume of carbon dioxide over volume of oxygen over 24 h (Supplementary Figure S1). (J) Serum urea level was determined and blood urea nitrogen (BUN) calculated. (K) 24 h urine was collected and albuminuria determined. Data represents means ± SEM, n = 6–9 mice per group. *p < 0.05, **p < 0.01, ***p < 0.001 and ****p < 0.0001.
FIGURE 2
FIGURE 2
Dulaglutide improves high-fat diet-induced renal morphological changes. (A) Haematoxylin and Eosin (H&E) stain show cytoplasmic vacuole formation in the renal tubules (black arrow) was observed. (B) Periodic Schiff-Methenamine (PASM) was stained to assess for increasing mesangial expansion. The area per cell of glomeruli were also quantified Oil Red O staining was performed to visualize neutral lipids at cortex (C) and medulla (D) region. Immunohistochemistry of (E) kidney injury molecule-1 (KIM-1) and (F) glucagon-like peptide-1 receptor (GLP-1R) was performed. Image analysis was performed using ImageJ software, and the average area of glomeruli was calculated. The average staining of neutral lipids were quantified by red stained pixel/cell. Optical density of renal tubules was calculated for the relative expression of KIM-1 and GLP-1R in the renal tubules. All image analysis was calculated from 30 random area from each mouse. The representative images of all stains are from three different groups. Data represents means ± SEM, n = 6–9 mice per group. **p < 0.01 and ****p < 0.0001.
FIGURE 3
FIGURE 3
Bioinformatics analysis of lipidomics of the kidneys of STC, HFD and H + Dula groups (A–F) The score plots from PCA, PLS-DA and OPLS-DA model between the HFD and the H + Dula group. UHPLC/ESI-QTOF-MS in positive and negative electrospray ionization mode were used. (A,B) PCA score plot, (C,D) PLS-DA score plot and (E,F) OPLS-DA score plot of lipids from UHPLC/ESI-QTOF-MS in positive and negative mode, respectively. Positive PLS-DA score plot: R2X(cum) = 0.534, R2Y(cum) = 0.990, Q2 (cum) = 0.792; negative PLS-DA score plot: R2X(cum) = 0.561, R2Y(cum) = 0.990, Q2 (cum) = 0.885. Positive OPLS-DA score plot: R2X(cum) = 0.563, R2Y(cum) = 0.999, Q2 (cum) = 0.706; negative OPLS-DA score plot: R2X(cum) = 0.414, R2Y(cum) = 0.975, Q2 (cum) = 0.614. (G) Summary of renal lipidomic pathways of high-fat diet-fed mice altered by dulaglutide treatment. Each point represents one lipidomic pathway. The size of dot and the shade of color are positively related to the effect on the lipidomic pathway. (H) Lipid sets enrichment overview of the kidneys of high-fat diet-fed mice after treatment with dulaglutide.
FIGURE 4
FIGURE 4
Dulaglutide can trigger the spatial redistribution of lipids in the kidneys of high-fat diet-fed mice visualized by MALDI-MSI. MALDI images of mouse kidney sections obtained at a spatial resolution of 100 μm. Alterations in lipid content of PC, PI and CL in the kidney cortex after dulaglutide treatment are visualized by MALDI-MSI. Spatial visualization of (A) TG (52:3), [M + K]+, m/z 895.8 was performed in positive mode. (B) PI (38:4), [M-H]-, m/z 885.7 was performed in negative mode. (C) PC(38:7), [M + H]+, m/z 804.6) was performed in positive mode and (D) CL (74:2), [M + H]-, m/z 1,488.2 was performed in negative mode. Bar chart of normalized intensities was plotted and used to calculate changes. Data represents means ± SEM, n = 6–9 mice per group. ****p < 0.0001 and n. s = not significant.
FIGURE 5
FIGURE 5
Dulaglutide treatment increases the level of renal mtDNA not via the expression of mitochondrial biogenesis genes. Quantification of (A) mitochondrial DNA (mtDNA) normalized with genomic DNA (gDNA) in renal tissue. RT-qPCR was used to determine the mRNA expression level of (B) PGC-1α, (C) Nuclear respiratory factor 1 (NRF1), (D) Mitochondrial transcription factor A (TFAM). (E) gluconeogenic phosphoenolpyruvate carboxykinase (PEPCK). (F) NADH-ubiquinone oxidoreductase chain five protein (ND5), (G) cytochrome b (CYTB), and (H) cytochrome oxidase III (CoxIII). Gene expression data were normalized against glyceraldehyde 3-phosphate dehydrogenase (GAPDH), and are shown relative to STC group, which were set arbitrary to 1. Values are mean ± SEM. *p < 0.05, **p < 0.01 and n. s = not significant.
FIGURE 6
FIGURE 6
Dulaglutide treatment increases the mRNA expression of renal cardiolipin synthesis genes. (A) Overview of cardiolipin biosynthesis pathway. Lipid groups with increased and decreased abundance from UHPLC/ESI-QTOF-MS data are highlighted in red and green respectively. The mRNA level of enzymes involved in CL biosynthesis and remodeling includes (B) cytidine diphosphate diacylglycerol synthetase 1 (CDS1), (C) phosphatidylglycerol phosphate synthase (PGPS), (D) cardiolipin synthase (CLS) and (E) tafazzin (TAZ) by RT-qPCR. (Gene expression data were normalized against GAPDH, and are shown relative to STC group, which were set arbitrary to 1. Data represents means ± SEM, n = 6–9 mice per group. *p < 0.05, **p < 0.01 and n. s = not significant.
FIGURE 7
FIGURE 7
Dulaglutide cannot reduce ectopic lipid accumulation and increase the expression of cardiolipin synthesis genes in the livers of high-fat diet-fed mice. (A) The representative images of Oil Red O staining of liver from three different groups, n = 6–9 in each group. Image analysis was performed using ImageJ software, and the red stained pixel/cell was calculated for the different groups’ liver tissue sections. (B) The average red stained pixels were calculated from 30 random area from each mouse. (C–F) Dulaglutide treatment does not increase the mRNA expression of cardiolipin synthesis genes in liver. Gene expressions of enzymes involved in cardiolipin synthesis were quantified after dulaglutide treatment using reverse transcription polymerase chain reaction in the liver. The mRNA level of enzymes involved in CL biosynthesis and remodeling includes (C) cytidine diphosphate diacylglycerol synthetase 1 (CDS1), (D) phosphatidylglycerol phosphate synthase (PGPS), (E) cardiolipin synthase (CLS), and (F) tafazzin (TAZ) were measured by RT-qPCR. Gene expression data were normalized against GAPDH, and are shown relative to STC group, which were set arbitrary to 1. Data represents means ± SEM, n = 6–9 mice per group. ****p < 0.0001 and n. s = not significant.
FIGURE 8
FIGURE 8
Working model. Dulaglutide attenuates high-fat diet-induced kidney damage by increasing cardiolipin level via the expression of cardiolipin synthesis genes. Activation of GLP-1R by dulaglutide led to the reduction in abundance of phosphatidic acids (PA) and phosphatidylglycerols (PG) and an increase in abundance of cardiolipins (CL) by increasing the expression of cardiolipin synthesis enzymes. CDS1, cytidine diphosphate diacylglycerol synthetase one; CLS, cardiolipin synthase; PGPS, phosphatidylglycerol phosphate synthase; PTPMT1, protein tyrosine phosphatase mitochondrial one; IMS, inner mitochondrial space; IMM, inner mitochondrial membrane. Red arrow ↑ denotes increased abundance and blue arrow ↓ denotes reduced abundance.

Similar articles

Cited by

References

    1. Afkarian M., Zelnick L. R., Hall Y. N., Heagerty P. J., Tuttle K., Weiss N. S., et al. (2016). Clinical Manifestations of Kidney Disease Among US Adults with Diabetes, 1988-2014. JAMA 316 (6), 602–610. 10.1001/jama.2016.10924 - DOI - PMC - PubMed
    1. Alchi B., Griffiths M., Jayne D. (2010). What Nephrologists Need to Know about Antiphospholipid Syndrome. Nephrol. Dial. Transpl. 25 (10), 3147–3154. 10.1093/ndt/gfq356 - DOI - PubMed
    1. Alicic R. Z., Rooney M. T., Tuttle K. R. (2017). Diabetic Kidney Disease: Challenges, Progress, and Possibilities. Clin. J. Am. Soc. Nephrol. 12 (12), 2032–2045. 10.2215/CJN.11491116 - DOI - PMC - PubMed
    1. Amorim R. G., Guedes G. D. S., Vasconcelos S. M. L., Santos J. C. F. (2019). Kidney Disease in Diabetes Mellitus: Cross-Linking between Hyperglycemia, Redox Imbalance and Inflammation. Arq Bras Cardiol. 112 (5), 577–587. 10.5935/abc.20190077 - DOI - PMC - PubMed
    1. Bhargava P., Schnellmann R. G. (2017). Mitochondrial Energetics in the Kidney. Nat. Rev. Nephrol. 13 (10), 629–646. 10.1038/nrneph.2017.107 - DOI - PMC - PubMed

LinkOut - more resources