Review
. 2022 Mar 1:12:860740.
doi: 10.3389/fonc.2022.860740. eCollection 2022.

Cystic Neoplasms of the Pancreas: Differential Diagnosis and Radiology Correlation

Affiliations
Review

Cystic Neoplasms of the Pancreas: Differential Diagnosis and Radiology Correlation

Feixiang Hu et al. Front Oncol. .

Abstract

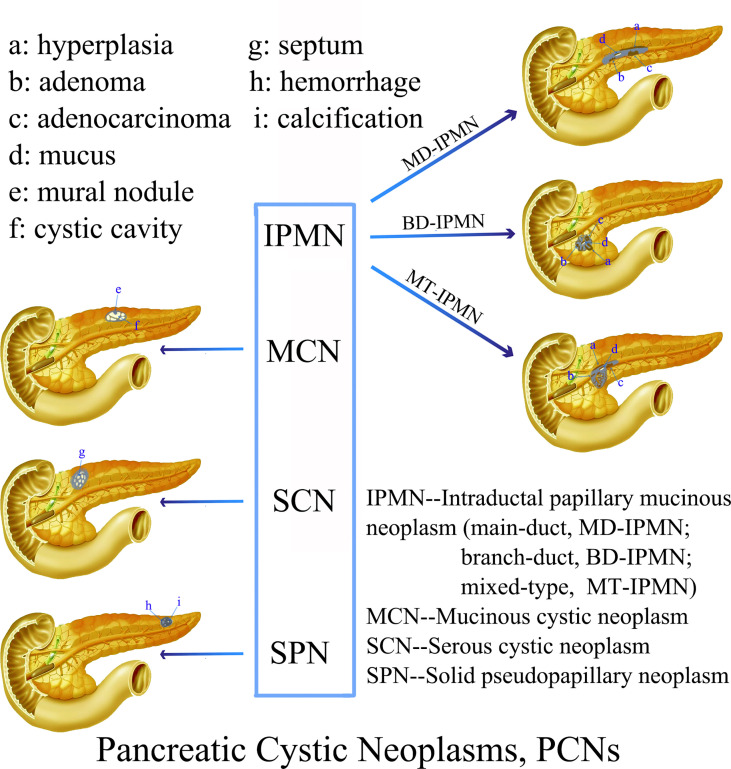
Although the probability of pancreatic cystic neoplasms (PCNs) being detected is raising year by year, their differential diagnosis and individualized treatment are still a challenge in clinical work. PCNs are tumors containing cystic components with different biological behaviors, and their clinical manifestations, epidemiology, imaging features, and malignant risks are different. Some are benign [e.g., serous cystic neoplasms (SCNs)], with a barely possible that turning into malignant, while others display a low or higher malignant risk [e.g., solid pseudopapillary neoplasms (SPNs), intraductal papillary mucinous neoplasms (IPMNs), and mucinous cystic neoplasms (MCNs)]. PCN management should concentrate on preventing the progression of malignant tumors while preventing complications caused by unnecessary surgical intervention. Clinically, various advanced imaging equipment are usually combined to obtain a more reliable preoperative diagnosis. The challenge for clinicians and radiologists is how to accurately diagnose PCNs before surgery so that corresponding surgical methods and follow-up strategies can be developed or not, as appropriate. The objective of this review is to sum up the clinical features, imaging findings and management of the most common PCNs according to the classic literature and latest guidelines.

Keywords: intraductal papillary mucinous neoplasms (IPMNs); mucinous cystic neoplasms (MCNs); pancreatic cystic neoplasms (PCNs); radiology; serous cystic neoplasms (SCN); solid pseudopapillary neoplasms (SPN).


Conflict of interest statement

Author PW was employed by GE Healthcare. The remaining authors declare that the research was conducted in the absence of any commercial or financial relationships that could be construed as a potential conflict of interest.

Figures

Figure 1
Figure 1
Schematic representation of the characteristic morphological and imaging features of various PCNs.
Figure 2
Figure 2
Branch-type IPMN (Male, 66y, physical examination revealed a pancreatic mass for a week). (A–C) The CT plain scan, arterial phase and venous phase at the same level; (D) Coronal image in arterial phase. (E) T2-weighted cross-sectional image; (F) T2-weighted cross-sectional image at another level of the same patient; (G). T2-weighted coronal image; H. MRCP reconstruction map; (A) The CT plain scan showed multilocular cystic mass of pancreatic head with septation and clear boundary. The density is slightly higher than that of water. (B–D) Contrast enhanced scan showed moderate enhancement of mural nodules in the dilated branch pancreatic duct. (E–H) Septa can be seen in the lesion and the MPD was slightly dilated. The white arrows in the Figures only indicate the location of the neoplasm.
Figure 3
Figure 3
Main-duct IPMN (Male, 57y, abdomen pain for one month). The sequence distribution of images is the same as that in Figure 2 . (A) The CT plain scan showed nodule in the neck of the pancreas, with a CT value of about 31HU. The MPD is obviously dilated, the pancreatic parenchyma is slightly atrophied, the dilated pancreatic duct is low-density, and the density is similar to that of water. (B, D) In the arterial phase, the nodule of the pancreatic neck was moderate enhanced, with a CT value of about 65HU, and the dilated pancreatic duct showed more clearly. (C) In the venous phase, the nodule showed continuous enhancement, at this time, the CT value is 72HU; (E–G) The T2-weighted imaging shows pancreatic duct dilatation with multiple mural nodules. (H) MRCP shows the MPD dilated significantly throughout the whole pancreas. The white arrows in the Figures only indicate the location of the neoplasm.
Figure 4
Figure 4
Mixed-type IPMN (Female, 56y, abdomen pain for half year). (A–C) The CT plain scan, arterial phase and venous phase at the same level; (D) Coronal image in arterial phase. (E) PET cross-sectional image; (F) T2-weighted cross-sectional image; (G) T2-weighted coronal image; (H) MRCP reconstruction map; (A) The CT plain scan showed multilocular cystic mass of pancreatic head with septation and clear boundary. The density is slightly higher than that of water. (B, C) Contrast enhanced scan showed moderate enhancement of mural nodules in the dilated MPD and branch pancreatic duct. (D) Diffuse dilatation of the MPD with enhanced mural nodules, which is the key to the diagnosis of mixed-type IPMN. (E) No obvious FDG uptake was found in the lesions by PET-CT. (F–H) Magnetic resonance imaging showed a multilocular cystic mass in the pancreatic head with multiple mural nodules, which communicated with the pancreatic duct. The white arrows in the Figures only indicate the location of the neoplasm.
Figure 5
Figure 5
Mucinous cystic neoplasms, MCN (Female, 33y, physical examination revealed a pancreatic mass for one month). The sequence distribution of images is the same as that in Figure 2 . (A–D) Huge cystic mass in the body and tail of the pancreas, irregular in shape, high tension, watery low density, thin and uniform cyst wall, multiple thin septum and small walled cysts can be seen in the cyst, and the septation and mild cyst wall can be seen enhanced after contrast injection. (E–H) Magnetic resonance images showed clearer septum and small sacs. There were no signs of pancreatic duct dilatation. The white arrows in the Figures only indicate the location of the neoplasm.
Figure 6
Figure 6
Serous microcystic adenoma, SMA (Male, 65y, physical examination revealed a pancreatic mass for one month). The sequence distribution of images is the same as that in Figure 2 . (A–D) Polycystic or honeycomb cystic foci in the head of the pancreas, with a lobulated outline, like a collapsed wall dumping to the center, and slightly continuous enhancement of the cyst wall and septum. Punctate calcification can be seen in the capsule wall. The enhanced scan shows progressive medium-strength enhancement of the central scars. (E–H) Magnetic resonance imaging reveals microcapsule-like structures more clearly and the MPD was slightly dilated. A stellate scar can be seen in the center of the lesion. The white arrows in the Figures only indicate the location of the neoplasm.
Figure 7
Figure 7
Serous oligocystic adenoma, SOA (Female, 39y, physical examination revealed a pancreatic mass for two weeks). (A–C) The CT plain scan, arterial phase and venous phase at the same level; (D) T2-weighted cross-sectional image; (E). T2-weighted coronal image; (F) MRCP reconstruction map; (A–C) Low-density cystic mass in the neck of the pancreas with clear boundary and uniform density, no enhancement on dynamic contrast enhancement phase. (D–F) Magnetic resonance fat suppression T2WI showed a small cyst and a thin-walled separation next to the large cyst, and no signs of pancreatic duct dilatation. The white arrows in the Figures only indicate the location of the neoplasm.
Figure 8
Figure 8
Solid serous cystadenomas, SSCA (Female, 43y, physical examination revealed a pancreatic mass for three weeks). (A–D) The CT plain scan, arterial phase, portal and venous phase at the same level; (A) The CT plain scan showed a solid mass in the head of the pancreas, with a CT value of about 31HU. (B) In the arterial phase, the mass of the pancreatic head was obviously enhanced, with a CT value of about 123HU. The focal low enhancement area can be seen in the center. (C) In the portal phase, the neoplasm showed progressive significantly enhancement, at this time, the CT value was 163HU; (D) The contrast wash-out can be seen in the venous phase of the mass, with a CT value of about 120HU. The overall manifestation was solid tumor with rich blood supply of pancreas. The white arrows in the Figures only indicate the location of the neoplasm.
Figure 9
Figure 9
Solid pseudopapillary neoplasm, SPN (Female, 28y, physical examination revealed a pancreatic mass for a week). (A–C) The CT plain scan, arterial phase and venous phase at the same level; (D) Coronal image in arterial phase. (E) Arterial phase cross-sectional image at another level of the same patient. (F). T2-weighted cross-sectional image; (G) T2-weighted coronal image; (H). MRCP reconstruction map; (A) The CT plain scan showed a low-density mass in the head of the pancreas with cystic degeneration. Calcification was visible in the mass. (B–E) The solid component reinforcement was not obvious. The incomplete arc-shaped calcification of the envelope can be seen. (F–H) MRI shows old hemorrhagic signal with fluid-fluid level. There were no signs of pancreatic duct dilatation. The white arrows in the Figures only indicate the location of the neoplasm.
Figure 10
Figure 10
Solid pseudopapillary neoplasm, SPN (Female, 58y, physical examination revealed a pancreatic mass for one month). (A–D) The CT plain scan, arterial phase, portal phase and venous phase at the same level. The lesions are large in size, with cystic and solid components visible inside. The cystic part is not enhanced, but the internal solid components are enhanced and distributed in patches in low-density liquid tissue, showing the “floating cloud sign”. Besides, note that the pancreatic tissue had a “cup-mouth” boundary. The white arrows in the Figures only indicate the location of the neoplasm.

Similar articles

Cited by

References

    1. van Huijgevoort N, Del CM, Wolfgang CL, van Hooft JE, Besselink MG. Diagnosis and Management of Pancreatic Cystic Neoplasms: Current Evidence and Guidelines. Nat Rev Gastroenterol Hepatol (2019) 16:676–89. doi: 10.1038/s41575-019-0195-x - DOI - PubMed
    1. Mamone G, Barresi L, Tropea A, Di Piazza A, Miraglia R. MRI of Mucinous Pancreatic Cystic Lesions: A New Updated Morphological Approach for The Differential Diagnosis. Updates Surg (2020) 72:617–37. doi: 10.1007/s13304-020-00800-y - DOI - PubMed
    1. Perri G, Marchegiani G, Frigerio I, Dervenis CG, Conlon KC, Bassi C, et al. . Management of Pancreatic Cystic Lesions. Dig Surg (2020) 37:1–9. doi: 10.1159/000496509 - DOI - PMC - PubMed
    1. Abdelkader A, Hunt B, Hartley CP, Panarelli NC, Giorgadze T. Cystic Lesions of the Pancreas: Differential Diagnosis and Cytologic-Histologic Correlation. Arch Pathol Lab Med (2020) 144:47–61. doi: 10.5858/arpa.2019-0308-RA - DOI - PubMed
    1. Dalal V, Carmicheal J, Dhaliwal A, Jain M, Kaur S, Batra SK. Radiomics in Stratification of Pancreatic Cystic Lesions: Machine Learning in Action. Cancer Lett (2020) 469:228–37. doi: 10.1016/j.canlet.2019.10.023 - DOI - PMC - PubMed

LinkOut - more resources