. 2022 Mar 1:12:786931.
doi: 10.3389/fonc.2022.786931. eCollection 2022.

Metabolic Adaptations in an Endocrine-Related Breast Cancer Mouse Model Unveil Potential Markers of Tumor Response to Hormonal Therapy

Affiliations

Metabolic Adaptations in an Endocrine-Related Breast Cancer Mouse Model Unveil Potential Markers of Tumor Response to Hormonal Therapy

Rita Araújo et al. Front Oncol. .

Abstract

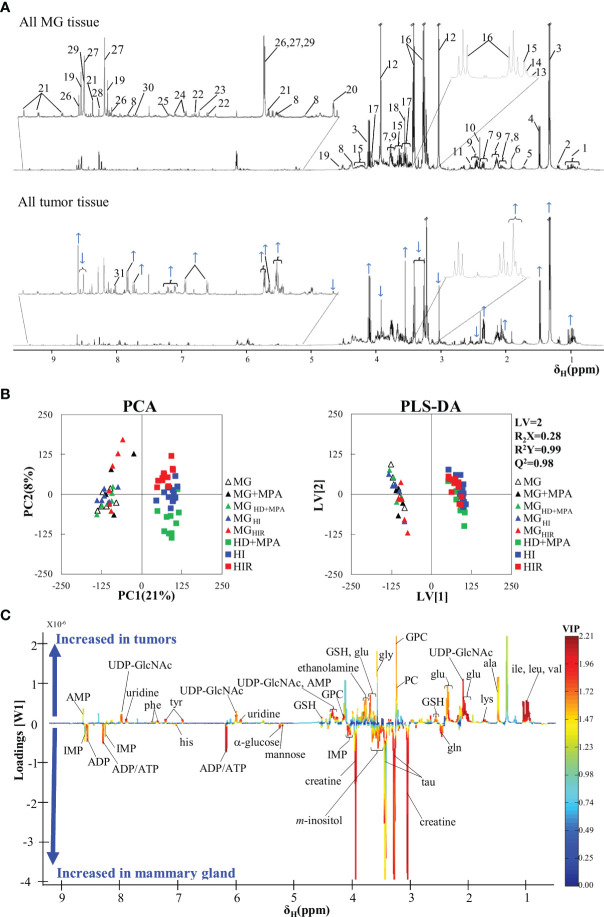
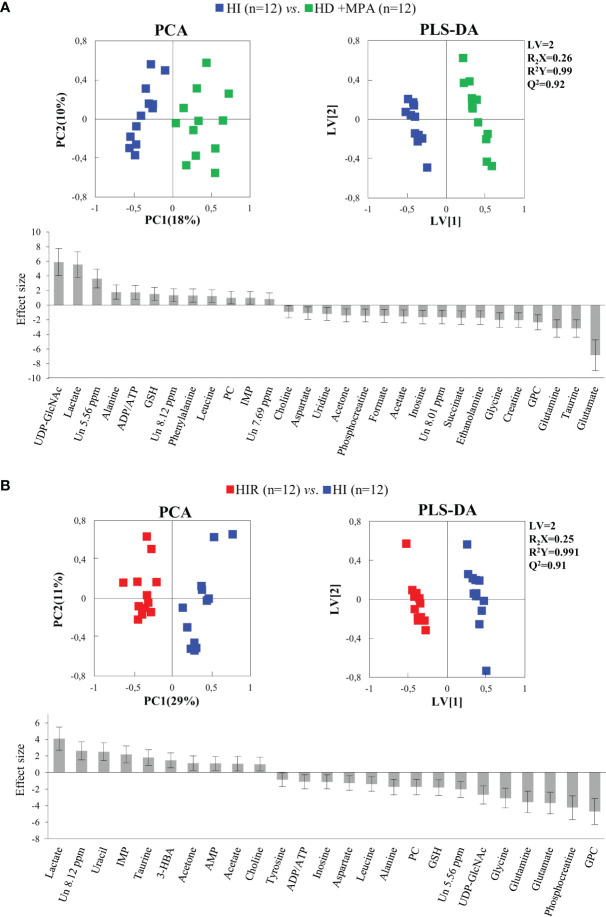
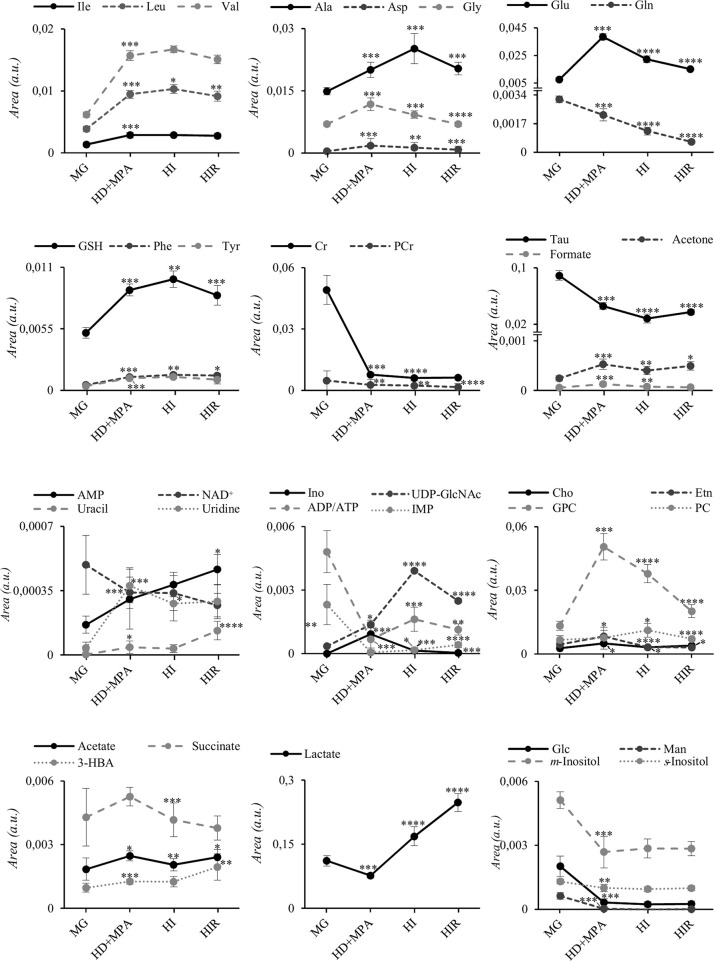
Breast cancer (BC) is the most common type of cancer in women and, in most cases, it is hormone-dependent (HD), thus relying on ovarian hormone activation of intracellular receptors to stimulate tumor growth. Endocrine therapy (ET) aimed at preventing hormone receptor activation is the primary treatment strategy, however, about half of the patients, develop resistance in time. This involves the development of hormone independent tumors that initially are ET-responsive (HI), which may subsequently become resistant (HIR). The mechanisms that promote the conversion of HI to HIR tumors are varied and not completely understood. The aim of this work was to characterize the metabolic adaptations accompanying this conversion through the analysis of the polar metabolomes of tumor tissue and non-compromised mammary gland from mice implanted subcutaneously with HD, HI and HIR tumors from a medroxyprogesterone acetate (MPA)-induced BC mouse model. This was carried out by nuclear magnetic resonance (NMR) spectroscopy of tissue polar extracts and data mining through multivariate and univariate statistical analysis. Initial results unveiled marked changes between global tumor profiles and non-compromised mammary gland tissues, as expected. More importantly, specific metabolic signatures were found to accompany progression from HD, through HI and to HIR tumors, impacting on amino acids, nucleotides, membrane percursors and metabolites related to oxidative stress protection mechanisms. For each transition, sets of polar metabolites are advanced as potential markers of progression, including acquisition of resistance to ET. Putative biochemical interpretation of such signatures are proposed and discussed.

Keywords: biomarkers; endocrine-related breast cancer; metabolomics; metabonomics; murine model; therapy resistance.


Conflict of interest statement

The authors declare that the research was conducted in the absence of any commercial or financial relationships that could be construed as a potential conflict of interest.

Figures

Figure 1
Figure 1
Experimental design and nomenclature of tissues from each group. (A) Two-month-old healthy, virgin female mice were divided into two groups, one implanted with 20 mg depot MPA and the other one left without depot (control). After 16 days, the mammary gland (MG) tissue was excised for analysis (MG+MPA and MG); and (B) the syngeneic tumors C4-HD (hormone-dependent; HD), C4-HI (hormone-independent; HI) and C4-HIR (hormone-independent and endocrine therapy-resistant; HIR) were implanted in the right and left inguinal flanks of 2-month-old virgin female mice. The mice bearing C4-HD tumors were also implanted with 20 mg MPA depot. The tumors (HD, HI and HIR) and MG tissue from the same animal (MGHD+MPA, MGHI and MGHIR) were excised and analysed. *Indicates that 12 tumors were obtained from six mice that were implanted on both inguinal flanks.
Figure 2
Figure 2
Average 1H NMR (500 MHz) spectra of aqueous extracts, PCA and PLS-DA scatter plots and corresponding loadings plots. (A) Average 1H NMR spectra of aqueous extracts of all tumors (top) and mammary gland (MG) samples (bottom). Peak assignments: 1: isoleucine/leucine/valine, 2: 3-HBA (3-hydroxybutyrate), 3: lactate, 4: alanine, 5: lysine, 6: acetate, 7: glutamate, 8: UDP-GlcNAc (UDP-N-acetylglucosamine), 9: glutamine, 10: succinate, 11: GSH (reduced glutathione), 12: creatine, 13: choline, 14: PC (phosphocholine), 15: GPC (glycerophosphocholine), 16: taurine, 17: m-inositol, 18: glycine, 19: IMP (inosine monophosphate), 20: α-glucose, 21: NAD+ (oxidized nicotinamide adenine dinucleotide), 22: tyrosine, 23: histidine, 24: phenylalanine, 25: uracil, 26: AMP (adenosine monophosphate), 27: ADP (adenosine diphosphate), 28: inosine, 29: ATP (adenosine triphosphate), 30: uridine 31: Un8.12: unassigned metabolite at δ 8.12; (B) PCA and PLS-DA scatter plots of all tumor samples (n = 36) vs. all MG samples (n = 30); and (C) corresponding PLS-DA loadings plots for the model in B) (right).
Figure 3
Figure 3
PCA and PLS-DA scatter plots, loadings plots and metabolic variations in the first step of tumor progression. (A) PCA and PLS-DA of HD+MPA tumors (n = 12) vs. MGHD+MPA tissue (n = 6); (B) PLS-DA loadings plots; three-letter code used for amino acids and all other abbreviations defined as in Figure 2 caption; and (C) metabolic variations reported in the transition from MGHD+MPA tissue to HD+MPA tumors expressed by effect-size (ES), with corresponding error.
Figure 4
Figure 4
PCA and PLS-DA scatter plots and metabolic variations for acquisition of hormonal independence and acquisition of treatment resistance. (A) PCA and PLS-DA of HI tumors (n = 12) vs. HD+MPA tumors (n = 12) and corresponding metabolic variations expressed by ES; (B) PCA and PLS-DA of HIR tumors (n = 12) vs. HI tumors (n = 12) and corresponding metabolic variations expressed by ES. All abbreviations defined as in Figure 2 caption.
Figure 5
Figure 5
Metabolite trajectories throughout tumor stage progression. Peak areas corresponding to each metabolite were normalized by total spectral area. MG, mammary gland from healthy mice; HD+MPA, hormone-dependent tumor; HI, hormone-independent tumor; HIR, hormone-independent and therapy resistant tumor. *p-value < 0.05; **p-value < 0.01; ***p-value < 0.001; ****p-value < 0.0001. Three-letter code used for amino acids; Cr, creatine; Etn, ethanolamine; Glc, glucose; Ino, inosine; Man, mannose; PCr, phosphocreatine. All other abbreviations are defined as in Figure 2 caption.
Figure 6
Figure 6
Graphical representation of selected metabolite ratios. All ratios were obtained from the average normalized peak areas. All abbreviations defined as in Figure 2 caption. Asterisks represent the statistical relevance of a certain group compared to the previously represented one: *p-value < 0.05; **p-value < 0.01; ***p-value < 0.001; ****p-value < 0.0001.
Figure 7
Figure 7
Metabolic pathways putatively identified as the main metabolic adaptations found between polar extracts of MGHD+MPA, HD+MPA, HI and HIR tissues. Metabolite names in bold identify compounds detected by NMR (irrespective of their variation). Colored arrows (↓↑) and dashes (-) indicated after a metabolite name illustrate variations corresponding to each pairwise comparison, following the order: HD+MPA vs MGHD+MPA (left symbol), HI vs HD+MPA (middle symbol), and HIR vs HI (right symbol). Three letter code were used for amino acids; CDP-Cho, cytidine diphosphate-choline; GAA, guanidoacetate; PE, phosphoethanolamine; PtdCho, phosphatidylcholine, all other abbreviations defined as in Figure 2 caption.

Similar articles

Cited by

References

    1. Dai X, Cheng H, Bai Z, Li J. Breast Cancer Cell Line Classification and Its Relevance With Breast Tumor Subtyping. J Cancer (2017) 8:16. doi: 10.7150/jca.18457 - DOI - PMC - PubMed
    1. Zattarin E, Leporati R, Ligorio F, Lobefaro R, Vingiani A, Pruneri G, et al. . Hormone Receptor Loss in Breast Cancer: Molecular Mechanisms, Clinical Settings, and Therapeutic Implications. Cells (2020) 9:12. doi: 10.7150/jca.18457 - DOI - PMC - PubMed
    1. Morandi A, Indraccolo S. Linking Metabolic Reprogramming to Therapy Resistance in Cancer. Biochim Biophys Acta Rev Cancer (2017) 1868:1. doi: 10.1016/j.bbcan.2016.12.004 - DOI - PubMed
    1. Brisken C. Progesterone Signaling in Breast Cancer: A Neglected Hormone Coming Into the Limelight. Nat Rev Cancer (2013) 13:6. doi: 10.1038/nrc3518 - DOI - PubMed
    1. Lamb CA, Fabris VT, Jacobsen BM, Molinolo A, Lanari C. Biological and Clinical Impact of Imbalanced Progesterone Receptor Isoform Ratios in Breast Cancer. Endocr Relat Cancer (2018) 25:12. doi: 10.1530/erc-18-0179 - DOI - PubMed

LinkOut - more resources