. 2022 Mar 10:15:177-193.
doi: 10.2147/PGPM.S348565. eCollection 2022.

MicroRNA Dysregulation in Prostate Cancer

Affiliations

MicroRNA Dysregulation in Prostate Cancer

Vlad Horia Schitcu et al. Pharmgenomics Pers Med. .

Abstract

Prostate cancer biology is complex, and needs to be deciphered. The latest evidence reveals the significant role of non-coding RNAs, particularly microRNAs (miRNAs), as key regulatory factors in cancer. Therefore, the identification of altered miRNA patterns involved in prostate cancer will allow them to be used for development of novel diagnostic and prognostic biomarkers.

Patients and methods: We performed a miRNAs transcriptomic analysis, using microarray (10 matched pairs tumor tissue versus normal adjacent tissue, selected based on inclusion criteria), followed by overlapping with TCGA data. A total of 292 miRNAs were differentially expressed, with 125 upregulated and 167 downregulated in TCGA patients' cohort with PRAD (prostate adenocarcinoma), respectively for the microarray experiments; 16 upregulated and 44 downregulated miRNAs were found in our cohort. To confirm our results obtained for tumor tissue, we performed validation with qRT-PCR at the tissue and plasma level of two selected transcripts, and finally, we focused on the identification of altered miRNAs involved in key biological processes.

Results: A common signature identified a panel of 12 upregulated and 1 downregulated miRNA, targeting and interconnected in a network with the TP53, AGO2, BIRC5 gene and EGFR as a core element. Among this signature, the overexpressed transcripts (miR-20b-5p, miR-96-5p, miR-183-5p) and the downregulated miR-542-5p were validated by qRT-PCR in an additional patients' cohort of 34 matched tumor and normal adjacent paired samples. Further, we performed the validation of the expression level for miR-20b-5p, miR-96-5p, miR-183-5p plasma, on the same patients' cohort versus a healthy control group, confirming the overexpression of these transcripts in the PRAD group, demonstrating the liquid biopsy as a potential investigational tool in prostate cancer.

Conclusion: In this pilot study, we provide evidence on miRNA dysregulation and its association with key functional components of the PRAD landscape, where an important role is acted by miR-20b-5p, miR-542-5p, or the oncogenic cluster miR-183-96-182.

Keywords: biological network; microRNA; molecular signature; plasma; prostate adenocarcinoma; tissue.


Conflict of interest statement

The authors declare no conflicts of interest in this work.

Figures

Figure 1
Figure 1
MiRNA pattern in PRAD in UMPh and TCGA patient cohort. Heatmap of miRNA microarray expression data for (A) UMPh patient cohort, (B)TCGA data; (C) scatter plot used to visualize variations in miRNA expression between tumor values on the X-axes) and normal adjacent tissue (values on the Y axes), using the default fold-change value 1.5, displayed as green lines) of differentially expressed miRNAs for UMPh group (D) scatter plot of differentially expressed miRNAs for TCGA cohort; (E) volcano plot for UMPh group (F) volcano plot for TCGA group, graphical representation generated using Gene Spring (PRAD tumor tissue versus normal adjacent tissues); abscissa represents the log2 transformation value of the differential expression fold change between the tumor and the normal samples.
Figure 2
Figure 2
Summary of common miRNAs which are differentially expressed in PRAD between UMPh and TCGA. The common miRNAs are presented by overlapping the altered miRNAs as Venny diagram in the two analyzed groups using Gene Spring: (A) overexpressed miRNAs in the two analyzed cohorts and (B) downregulated miRNAs in the two cohorts.
Figure 3
Figure 3
Tissue qRT-PCR data validation (A) Graphical representation of the expression levels for miR-20b-5p, miR-96-5p, miR-183-5p and miR-543-5p in tumor versus normal adjacent tissue. The data were normalized using U6 and RNU48 (*p ≤ 0.05, ***p≤ 0.001) (B) ROC curves for the selected miRNAs, displaying the specificity and sensitivity for the discrimination among the tumoral tissue (TT) versus normal tissue (TN).
Figure 4
Figure 4
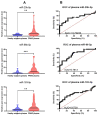
Plasma qRT-PCR data validation. (A) Graphical representation of the expression levels for miR-20b-5p, miR-96-5p, miR-183-5p in plasma PRAD patients versus healthy controls plasma. The data were normalized using U6 and RNU48 (**p ≤ 0.01, ***p≤ 0.001) (B) ROC curves for the selected miRNAs, displaying the specificity and sensitivity for the discrimination among expression levels in plasma for PRAD patients versus healthy controls.
Figure 5
Figure 5
miRNA-mRNA interaction network generated using IPA, based on the common miRNA signature among the two-patient cohort; the downregulated miRNAs are presented in green; the overexpressed miRNAs are presented in red; the red circle is highlighted the miRNAs validated by qRT-PCR, blue squares are highlighted the core genes of the network.
Figure 6
Figure 6
Expression level and overall survival of the main genes presented in the miRNA-mRNA network (AGO2, TP53, BIRC, and EGFR), according to TCGA data downloaded from the UALCAN online tool. (A) Expression levels and overall survival graphical representation of AGO2 (or EIF2C2), TP53, BIRC5, and EGFR generated using UALCAN online tool (B) Graphical representation of the overall survival for AGO2, TP53, BIRC5, and EGFR, generated using UALCAN online tool. (B) Overall survival for AGO2, TP53, BIRC5, and EGFR, generated using UALCAN online tool (*p ≤ 0.05, ***p ≤ 0.001).
Figure 7
Figure 7
(A) Hierarchical cluster and miRNA/KEGG pathways heat map among the selected miRNAs deregulated in PRAD. The map was generated using the Diana tools miRPath v.3 software (B) overlapping of the target genes for miR-20b-5p, miR-96-5p, miR-183-5p, and miR-543-5p.
Figure 8
Figure 8
The altered transcriptomic pattern was generated using the online tool UALCAN and considering the TP53 mutation status as a clinical variable in PRAD (based on the TCGA dataset). (A) Overall TP53 gene mutations across various PRAD projects data of cBioPortal. (B) miRNA expression level depending on TP53 mutation status, normal adjacent PRAD tissue (n=50), TP53 mutant PRAD cases (n=52), TP53 wild-type PRAD cases (n=438) (*p ≤ 0.05, ***p≤ 0.001; ****p ≤ 0.0001).
Figure 9
Figure 9
The altered transcriptomic pattern was generated using the online tool UALCAN and considering the Gleason score as a clinical variable in PRAD (based on TCGA dataset).

References

    1. Verma S, Pandey M, Shukla GC, Singh V, Gupta S. Integrated analysis of miRNA landscape and cellular networking pathways in stage-specific prostate cancer. PLoS One. 2019;14(11):e0224071. doi:10.1371/journal.pone.0224071 - DOI - PMC - PubMed
    1. Sung H, Ferlay J, Siegel RL, et al. Global cancer statistics 2020: GLOBOCAN estimates of incidence and mortality worldwide for 36 cancers in 185 countries. CA Cancer J Clin. 2021;71:209–249. doi:10.3322/caac.21660 - DOI - PubMed
    1. Lin Y, Chen F, Shen L, et al. Biomarker microRNAs for prostate cancer metastasis: screened with a network vulnerability analysis model. J Transl Med. 2018;16(1):134. doi:10.1186/s12967-018-1506-7 - DOI - PMC - PubMed
    1. Salciccia S, Capriotti AL, Laganà A, et al. Biomarkers in prostate cancer diagnosis: from current knowledge to the role of metabolomics and exosomes. Int J Mol Sci. 2021;22(9):4367. doi:10.3390/ijms22094367 - DOI - PMC - PubMed
    1. Chys B, Devos G, Everaerts W, et al. Preoperative risk-stratification of high-risk prostate cancer: a multicenter analysis. original research. Front Oncol. 2020;10(246). doi:10.3389/fonc.2020.00246 - DOI - PMC - PubMed