. 2022 Mar;15(3):158-164.
doi: 10.1038/s41561-022-00909-2. Epub 2022 Mar 11.

Confronting the water potential information gap

Affiliations

Confronting the water potential information gap

Kimberly A Novick et al. Nat Geosci. 2022 Mar.

Abstract

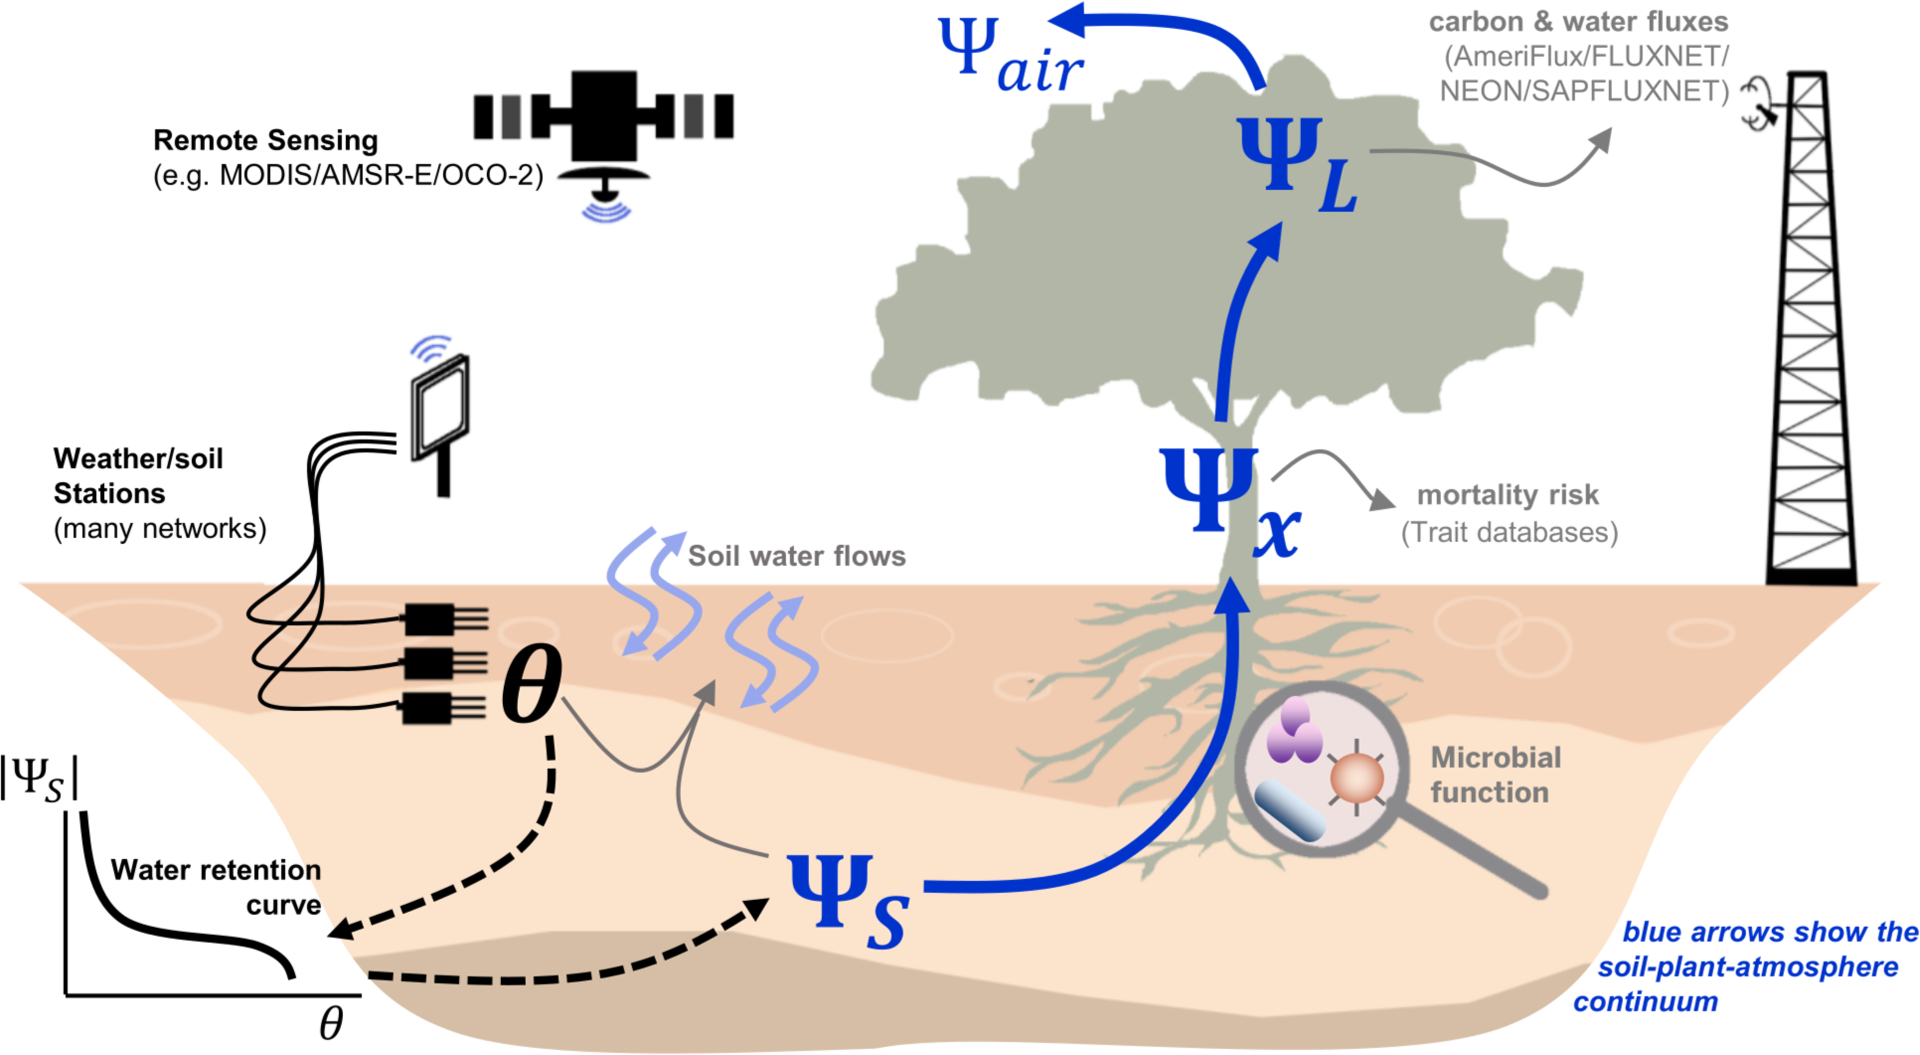
Water potential directly controls the function of leaves, roots, and microbes, and gradients in water potential drive water flows throughout the soil-plant-atmosphere continuum. Notwithstanding its clear relevance for many ecosystem processes, soil water potential is rarely measured in-situ, and plant water potential observations are generally discrete, sparse, and not yet aggregated into accessible databases. These gaps limit our conceptual understanding of biophysical responses to moisture stress and inject large uncertainty into hydrologic and land surface models. Here, we outline the conceptual and predictive gains that could be made with more continuous and discoverable observations of water potential in soils and plants. We discuss improvements to sensor technologies that facilitate in situ characterization of water potential, as well as strategies for building new networks that aggregate water potential data across sites. We end by highlighting novel opportunities for linking more representative site-level observations of water potential to remotely-sensed proxies. Together, these considerations offer a roadmap for clearer links between ecohydrological processes and the water potential gradients that have the 'potential' to substantially reduce conceptual and modeling uncertainties.


Conflict of interest statement

Competing interests: The authors declare no competing interests.

Figures

Figure 1:
Figure 1:. Water potential links environmental drivers to biophysical responses.
Water flows “downhill” along gradients of water potential in the soils (ΨS, where water potential is relatively high, often >-1 MPa) through the stems (Ψx) to the leaves (ΨL, where potential is relatively low) and eventually to the air (Ψair, where it can be as low as −100 MPa). Water potential also directly controls key biological processes, including microbial function, mortality risk arising from damaged plant xylem, and plant-atmosphere gas exchange. While observations of environmental drivers, soil moisture content (θ) and carbon and water fluxes are broadly accessible from environmental networks and remote sensing, Ψ timeseries are more discrete, sparse, and generally not coordinated or discoverable.
Figure 2:
Figure 2:. Water retention curve and pedotransfer function (PTF) uncertainty.
Across soil types, ΨS can differ by an order of magnitude for a given soil moisture content (panel a, with curves generated from the van Genutchen model,, see methods). Panels b-d illustrate the uncertainty in the water retention curve attributable to PTF parameter uncertainty. The shaded area shows the 90% confidence interval due solely to variation in a single parameter of the van Genuchten model (the ‘n’ shape parameter, which is linked to pore size) within just one standard deviation of its reported distribution for each soil class from a popular PTF. Thick lines in panels b-d are the same as in panel a. The PTF-driven uncertainty in the water retention curve propagates into large uncertainty for modeled fluxes and pools. Specifically, variation in the van Genuchten ‘n’ parameter within again just one standard deviation of its reported range causes the 90% confidence intervals on modeled evapotranspiration (ET), soil moisture content (θ, and ΨS (shaded gray areas, panels e-f) to vary by a magnitude comparable to the mean value of each parameter (thick black line). Simulations were run using the HYDRUS 1-D model for a forest site in Indiana, US during a drought event (see methods for details).
Figure 3.
Figure 3.. Water retention curve parameters are a key source of land surface model uncertainty.
A sensitivity analysis of key model parameters of the ORCHIDEE land surface model, was performed to demonstrate the relative importance of each parameter in simulating daily GPP at three contrasting FLUXNET sites: a) a temperate broadleaf forest (Harvard Forest, FLUXNET code US-Ha1); b) a boreal needleleaf forest (Sodankyla, FI-Sod,); and c) a semi-arid savanna (Demokeya, SD-Dem). The Sobol method was used to perform the sensitivity analysis; this method is based on variance decomposition and is able to capture interactions between parameters. More details can be found in the methods.
Figure 4:
Figure 4:. Soil water potential better explains variability in GPP when compared to soil moisture content.
Across four AmeriFlux sites for which site-specific water retention curves were measured,–, the relationship between GPP (normalized by its well-watered rate) and ΨS (bottom row) is more linear than the relationship between GPP and θ (top row). Moreover, cross-site heterogeneity in the response functions is reduced when it is ΨS, as opposed to θ, on the x-axis (compare panel e to panel j). GPP estimates were obtained from AmeriFlux, with site codes given in parentheses. Error bars indicate one standard error of the mean, which is quite small for some of the binned averages. See methods for more details.

References

    1. Brutsaert W Hydrology: An Introduction. Cambridge University Press; (2005).
    1. Philip J Plant water relations: some physical aspects. Annual Review of Plant Physiology 17, 245–268 (1966).
    1. Ghezzehei TA, Sulman B, Arnold CL, Bogie NA & Berhe AA On the role of soil water retention characteristic on aerobic microbial respiration. Biogeosciences 16, 1187–1209 (2019).
    1. Boyer J Differing sensitivity of photosynthesis to low leaf water potentials in corn and soybean. Plant Physiology 46, 236–239 (1970). - PMC - PubMed
    1. Jarvis P The interpretation of the variations in leaf water potential and stomatal conductance found in canopies in the field. Philosophical Transactions of the Royal Society of London. B, Biological Sciences 273, 593–610 (1976). - PMC - PubMed